Author Archive for InvestMacro – Page 605

How to make leverage work in your favor (B2C)

By Adinah Brown

Leverage will turbocharge your trading profits in a way that nothing else can. It gives you the power to trade $50 dollars like it was $50,000, and lets you keep the profits on the $50,000 transaction. It’s the only way to trade in Forex, unless your last name is Zuckerberg.

But to some, leverage is considered toxic. Why? Because it can turbocharge your losses in the same way that it can turbocharge your profits. That makes it both very powerful and very dangerous.

So, which is it, toxic or turbo?

Both.

Leverage needs to be carefully used to create power for your trading.

There is only one fundamental way that you can make leverage work in your favor, and that is to pick the direction of the market. If your position is moving in the right direction, no amount of leverage in the world is enough.

But, even if the position is not moving in the correct direction, there are still a few tricks you can use to protect yourself.

Hedging
For anyone that does not know, hedging is when you open a position in the opposite direction to the position that you currently have. The net profit and loss from this situation is zero, so you are paying swaps for nothing, but it can have useful strategic value in that it can control the loss of a position if you are looking for the trade to turn around.

A useful practical method is a partial hedge, where the hedge position is not as large as the original position taken. It will effectively slow the losses without providing full protection. If you put in stops when the original position moves back into profit, you will have taken a portion of the profits off the table, but you will not be cutting into your ongoing profits.

Another option is to set a full hedge at the stop loss point of the original position. That way the original position remains open, but any movement below the stop loss point will trigger the hedge and cause you to effectively make no further losses. Again, when the original position moves into profit, you need to have a stop to remove the hedge.

Options
Businesses with foreign currency risk will often take out an options contract in order to stabilize the values of their income in different countries. Using an option as a hedge is a good way to ensure that your position has protection. It has more upside than a normal hedge, because you are not obliged to exercise the option, giving you control over the final cost of the hedge position.

So, even though leverage is the friend of traders in its ability to turbocharge profits, it can and will do the same with your losses. Using the methods described above, you can create a situation where the leverage is greater in the profit direction and less in the loss direction. To put it in simple terms, you can still turbocharge your profits without doing the same to your losses.

About the Author:

Adinah Brown is a professional writer who has worked in a wide range of industry settings, including corporate industry, government and non-government organizations. Within many of these positions, Adinah has provided skilled marketing and advertising services and is currently the Content Manager at Leverate.


Currency Speculators slightly reduced US Dollar bullish positions for 2nd week

By CountingPips.comGet our weekly COT Reports by Email

US Dollar net speculator positions slipped to $24.44 billion last week

The latest data for the weekly Commitment of Traders (COT) report, released by the Commodity Futures Trading Commission (CFTC) on Friday, showed that large traders and currency speculators slightly decreased their bullish bets for the US dollar last week for a second consecutive week.

Non-commercial large futures traders, including hedge funds and large speculators, had an overall US dollar long position totaling $24.44 billion as of Tuesday January 17th, according to the latest data from the CFTC and dollar amount calculations by Reuters. This was a weekly decline of $-0.51 billion from the $24.95 billion total long position that was registered the previous week, according to the Reuters calculation (totals of the US dollar contracts against the combined contracts of the euro, British pound, Japanese yen, Australian dollar, Canadian dollar and the Swiss franc).

Despite falling for two straight weeks, the US dollar aggregate speculative level remains above the +$20 billion level for a twelfth straight week.

Weekly Speculator Contract Changes:

The individual major currencies that improved versus the US dollar last week were the Japanese yen (2,009 weekly change in contracts), Swiss franc (563 contracts), Canadian dollar (2,479 contracts), Australian dollar (8,693 contracts) and the New Zealand dollar (1,672 contracts).

The currencies whose speculative bets declined last week against the dollar were the euro (-677 weekly change in contracts), British pound sterling (-411 contracts) and the Mexican peso (-1,545 contracts).


Table of Weekly Commercial Traders and Speculators Levels & Changes:

CurrencyNet CommercialsComms Weekly ChgNet SpeculatorsSpecs Weekly Chg
EuroFx745771747-66500-677
GBP77179-880-66242-411
JPY107213-375-778302009
CHF26213-2895-13683563
CAD4856-6469-54562479
AUD3372-1267148458693
NZD12022-1729-122881672
MXN739391667-73321-1545


This latest COT data is through Tuesday and shows a quick view of how large speculators or non-commercials (for-profit traders) as well as the commercial traders (hedgers & traders for business purposes) were positioned in the futures markets. All currency positions are in direct relation to the US dollar where, for example, a bet for the euro is a bet that the euro will rise versus the dollar while a bet against the euro will be a bet that the dollar will gain versus the euro.


Weekly Charts: Large Trader Weekly Positions vs Price

EuroFX:


British Pound Sterling:


Japanese Yen:


Swiss Franc:


Canadian Dollar:


Australian Dollar:


New Zealand Dollar:


Mexican Peso:

*COT Report: The weekly commitment of traders report summarizes the total trader positions for open contracts in the futures trading markets. The CFTC categorizes trader positions according to commercial hedgers (traders who use futures contracts for hedging as part of the business), non-commercials (large traders who speculate to realize trading profits) and nonreportable traders (usually small traders/speculators). Find CFTC criteria here: (http://www.cftc.gov/MarketReports/CommitmentsofTraders/ExplanatoryNotes/index.htm).

The Commitment of Traders report is published every Friday by the Commodity Futures Trading Commission (CFTC) and shows futures positions data that was reported as of the previous Tuesday (3 days behind).

Each currency contract is a quote for that currency directly against the U.S. dollar, a net short amount of contracts means that more speculators are betting that currency to fall against the dollar and a net long position expect that currency to rise versus the dollar.

(The charts overlay the forex closing price of each Tuesday when COT trader positions are reported for each corresponding spot currency pair.) See more information and explanation on the weekly COT report from the CFTC website.

Article by CountingPips.com


WTI Crude Oil Speculators sharply added to bullish net positions last week

By CountingPips.comGet our weekly COT Reports by Email

WTI Crude Oil Non-Commercial Positions:

Large speculators and traders sharply increased their net positions in the WTI crude oil futures markets last week following two weeks of modest declines, according to the latest Commitment of Traders (COT) data released by the Commodity Futures Trading Commission (CFTC) on Friday.

The non-commercial contracts of WTI crude futures, traded by large speculators and hedge funds, totaled a net position of 464,678 contracts in the data reported through January 17th. This was a weekly gain of 31,116 contracts from the previous week which had a total of 433,562 net contracts.

The weekly speculative gain pushed bets to the highest level since before 2012 and over the +400,000 net contract level for a sixth consecutive week.

WTI Crude Oil Commercial Positions:

The commercial traders position, categorized by the CFTC as hedgers or traders engaged in buying and selling for business purposes, totaled a net position of -482,371 contracts last week. This is a weekly fall of -16,971 contracts from the total net of -465,400 contracts reported the previous week.

USO Crude Oil ETF:

Over the same weekly reporting time-frame, from Tuesday to Tuesday, the USO Crude Oil ETF, which tracks the price of WTI crude oil, closed at approximately $11.43 which was a change of $0.36 from the previous close of $11.07, according to ETF market data.

*COT Report: The COT data, released weekly to the public each Friday, is updated through the previous Tuesday (data is 3 days old) and shows a quick view of how large speculators or non-commercials (for-profit traders) as well as the commercial traders (hedgers & traders for business purposes) were positioned in the futures markets. The CFTC categorizes trader positions according to commercial hedgers (traders who use futures contracts for hedging as part of the business), non-commercials (large traders who speculate to realize trading profits) and nonreportable traders (usually small traders/speculators). Find CFTC criteria here: (http://www.cftc.gov/MarketReports/CommitmentsofTraders/ExplanatoryNotes/index.htm).

Article by CountingPips.com


Gold Speculators decreased bullish net positions, down 9 out of last 10 weeks

By CountingPips.comGet our weekly COT Reports by Email

Gold Non-Commercial Positions:

Large speculators and traders renewed their recent bearishness in the gold futures markets last week, according to the latest Commitment of Traders (COT) data released by the Commodity Futures Trading Commission (CFTC) on Friday.

The non-commercial futures contracts of Comex gold futures, traded by large speculators and hedge funds, totaled a net position of 107,041 contracts in the data reported through January 17th. This was a weekly change of -2,441 contracts from the previous week which had a total of 109,482 net contracts.

Gold speculative positions have now fallen nine out of the past ten weeks.

Gold Commercial Positions:

The commercial traders position, categorized by the CFTC as hedgers or traders engaged in buying and selling for business purposes, totaled a net position of -123,111 contracts last week. This is a weekly change of 2,705 contracts from the total net of -125,816 contracts reported the previous week.

Gold ETF:

Over the same weekly reporting time-frame, from Tuesday to Tuesday, the GLD ETF, which tracks the price of gold, closed at approximately $115.85 which was a rise of $2.70 from the previous close of $113.15, according to ETF financial market data.

*COT Report: The COT data, released weekly to the public each Friday, is updated through the previous Tuesday (data is 3 days old) and shows a quick view of how large speculators or non-commercials (for-profit traders) as well as the commercial traders (hedgers & traders for business purposes) were positioned in the futures markets. The CFTC categorizes trader positions according to commercial hedgers (traders who use futures contracts for hedging as part of the business), non-commercials (large traders who speculate to realize trading profits) and nonreportable traders (usually small traders/speculators). Find CFTC criteria here: (http://www.cftc.gov/MarketReports/CommitmentsofTraders/ExplanatoryNotes/index.htm).

Article by CountingPips.com


10 Year Treasury Note Speculators reduced bearish net positions last week

By CountingPips.comGet our weekly COT Reports by Email

10 Year Treasury Note Non-Commercial Positions:

Large speculators and traders reduced their bearish net positions in the 10-year treasury note futures markets last week for the first time in four weeks, according to the latest Commitment of Traders (COT) data released by the Commodity Futures Trading Commission (CFTC) on Friday.

The non-commercial futures contracts of 10-year treasury note futures, traded by large speculators and hedge funds, totaled a net position of -375,736 contracts in the data reported through January 17th. This was a weekly change of 18,953 contracts from the previous week which had a total of -394,689 net contracts.

The decline in the bearish positioning of the speculators brings them off their record short position of almost -400,000 contracts (actual of -394,689 contracts) that was set the previous week on January 10th.

10 Year Treasury Note Commercial Positions:

The commercial traders position, categorized by the CFTC as hedgers or traders engaged in buying and selling for business purposes, totaled a net position of 593,813 contracts last week. This is a weekly change of -50,746 contracts from the total net of 644,559 contracts reported the previous week.

IEF 7-10 Year Bond ETF:

Over the same weekly reporting time-frame, from Tuesday to Tuesday, the 7-10 Year Treasury Bond ETF (IEF) closed at approximately $105.92 which was a change of $0.48 from the previous close of $105.44, according to ETF market data.

*COT Report: The COT data, released weekly to the public each Friday, is updated through the previous Tuesday (data is 3 days old) and shows a quick view of how large speculators or non-commercials (for-profit traders) as well as the commercial traders (hedgers & traders for business purposes) were positioned in the futures markets. The CFTC categorizes trader positions according to commercial hedgers (traders who use futures contracts for hedging as part of the business), non-commercials (large traders who speculate to realize trading profits) and nonreportable traders (usually small traders/speculators). Find CFTC criteria here: (http://www.cftc.gov/MarketReports/CommitmentsofTraders/ExplanatoryNotes/index.htm).

Article by CountingPips.com


S&P500 Speculators trimmed bullish net positions for 5th week

By CountingPips.comGet our weekly COT Reports by Email

S&P500 Non-Commercial Positions:

Large speculators and traders decreased their net positions in the S&P500 stock futures markets last week for the fifth consecutive week, according to the latest Commitment of Traders (COT) data released by the Commodity Futures Trading Commission (CFTC) on Friday.

The non-commercial futures contracts of S&P500 futures, traded by large speculators and hedge funds, totaled a net position of 1,842 contracts in the data reported through January 17th. This was a weekly change of -298 contracts from the previous week which had a total of 2,140 net contracts.

Speculative positions are now at their lowest level since October 4th when total positions equaled +1,708 contracts. The last time speculators were net bearish was just a brief dip on September 13th.

S&P500 Commercial Positions:

The commercial traders position, categorized by the CFTC as hedgers or traders engaged in buying and selling for business purposes, totaled a net position of -10,754 contracts last week. This is a weekly change of 4,199 contracts from the total net of -14,953 contracts reported the previous week.

S&P500 Stock Market Index:

Over the same weekly reporting time-frame, from Tuesday to Tuesday, the S&P500 index closed at approximately 2267.88 which was a decline of -1.01 from the previous close of 2268.89, according to market data.

*COT Report: The COT data, released weekly to the public each Friday, is updated through the previous Tuesday (data is 3 days old) and shows a quick view of how large speculators or non-commercials (for-profit traders) as well as the commercial traders (hedgers & traders for business purposes) were positioned in the futures markets. The CFTC categorizes trader positions according to commercial hedgers (traders who use futures contracts for hedging as part of the business), non-commercials (large traders who speculate to realize trading profits) and nonreportable traders (usually small traders/speculators). Find CFTC criteria here: (http://www.cftc.gov/MarketReports/CommitmentsofTraders/ExplanatoryNotes/index.htm).

Article by CountingPips.com


Silver Speculators boosted bullish net positions for 3rd week

By CountingPips.comGet our weekly COT Reports by Email

Silver Non-Commercial Positions:

Large speculators and traders increased their net positions in the silver futures markets last week to the highest level since October, according to the latest Commitment of Traders (COT) data released by the Commodity Futures Trading Commission (CFTC) on Friday.

The non-commercial futures contracts of Comex silver futures, traded by large speculators and hedge funds, totaled a net position of 69,482 contracts in the data reported through January 17th. This was a weekly rise of 4,881 contracts from the previous week which had a total of 64,601 net contracts.

Last week’s speculative gain brought silver positions higher for a third straight week and to the highest level since October 4th when total positions equaled +75,803 contracts.

Silver Commercial Positions:

The commercial traders position, categorized by the CFTC as hedgers or traders engaged in buying and selling for business purposes, totaled a net position of -81,736 contracts last week. This is a weekly decline of -2,799 contracts from the total net of -78,937 contracts reported the previous week.

Silver ETF:

Over the same weekly reporting time-frame, from Tuesday to Tuesday, the SLV ishares ETF, which tracks the price of silver, closed at approximately $16.28 which was a change of $0.37 from the previous close of $15.91, according to ETF financial market data.

*COT Report: The weekly commitment of traders report summarizes the total trader positions for open contracts in the futures trading markets. The CFTC categorizes trader positions according to commercial hedgers (traders who use futures contracts for hedging as part of the business), non-commercials (large traders who speculate to realize trading profits) and nonreportable traders (usually small traders/speculators). Find CFTC criteria here: (http://www.cftc.gov/MarketReports/CommitmentsofTraders/ExplanatoryNotes/index.htm).

Article by CountingPips.com


Copper Speculators edged bullish net positions lower last week

By CountingPips.comGet our weekly COT Reports by Email

Copper Non-Commercial Positions:

Large speculators and traders slightly decreased their net positions in the copper futures markets last week, according to the latest Commitment of Traders (COT) data released by the Commodity Futures Trading Commission (CFTC) on Friday.

The non-commercial futures contracts of copper futures, traded by large speculators and hedge funds, totaled a net position of 46,499 contracts in the data reported through January 17th. This was a weekly fall of -1,204 contracts from the previous week which had a total of 47,703 net contracts.

Speculative positions have been down for four out of the last five weeks since December 13th when copper positions completed a run of seven straight weeks of gains.

Copper Commercial Positions:

The commercial traders position, categorized by the CFTC as hedgers or traders engaged in buying and selling for business purposes, totaled a net position of -49,272 contracts last week. This is a weekly rise of 827 contracts from the total net of -50,099 contracts reported the previous week.

Copper ETN:

Over the same weekly reporting time-frame, from Tuesday to Tuesday, the JJC iPath Bloomber Copper ETN, which tracks the price of copper, closed at approximately $30.12 which was a slight bump of $0.02 from the previous close of $30.10, according to financial market data.

*COT Report: The COT data, released weekly to the public each Friday, is updated through the previous Tuesday (data is 3 days old) and shows a quick view of how large speculators or non-commercials (for-profit traders) as well as the commercial traders (hedgers & traders for business purposes) were positioned in the futures markets. The CFTC categorizes trader positions according to commercial hedgers (traders who use futures contracts for hedging as part of the business), non-commercials (large traders who speculate to realize trading profits) and nonreportable traders (usually small traders/speculators). Find CFTC criteria here: (http://www.cftc.gov/MarketReports/CommitmentsofTraders/ExplanatoryNotes/index.htm).

Article by CountingPips.com


The New Gold Rush of 2017!

By Chris Vermeulen – www.TheGoldAndOilGuy.com

Gold to Regain Its Gleam!

One question that gold investors are asking now is, will 2017 be as spectacular for the yellow metal as it was in 2016? The short and sweet answer to this is YES.

The dollar, gold and the major U.S. stock exchanges will all see new highs. Gold is currently in a “complex corrective correction” while experiencing its’ last pullback, beforehand.

Both the short-term outlook and the long-term outlook for gold is BULLISH!  Trumps’ victory win is a positive for gold bulls. Policy uncertainty and slowing growth, following a Trump win, will stoke the yellow metals’ price in 2017.

Gold prices have been under pressure since the Trump victory, but the long-term scenario for gold is that it is parabolic. The global economy is still in contraction. Global Center Bankers continue with monetary easing, leading to currency debasement. Interest rates continue to slide into negative territory in Europe and Asia.  Gold’s investment appeal will encounter a period of time before it generates positive yields. Gold, as an investment, will once again be back in vogue. As prices rally, investment demand will only rise further, taking everyone by surprise.

The demand for gold jewelry has been declining within the large gold-consuming nations. The gold investors will call the shots in this new ‘bull’ market of gold.  Current supply constraint has cushioned gold prices from the rally in the U. S. dollar.

This is the last great buying opportunity for gold before it makes its’ next historic run in 2017 and beyond.


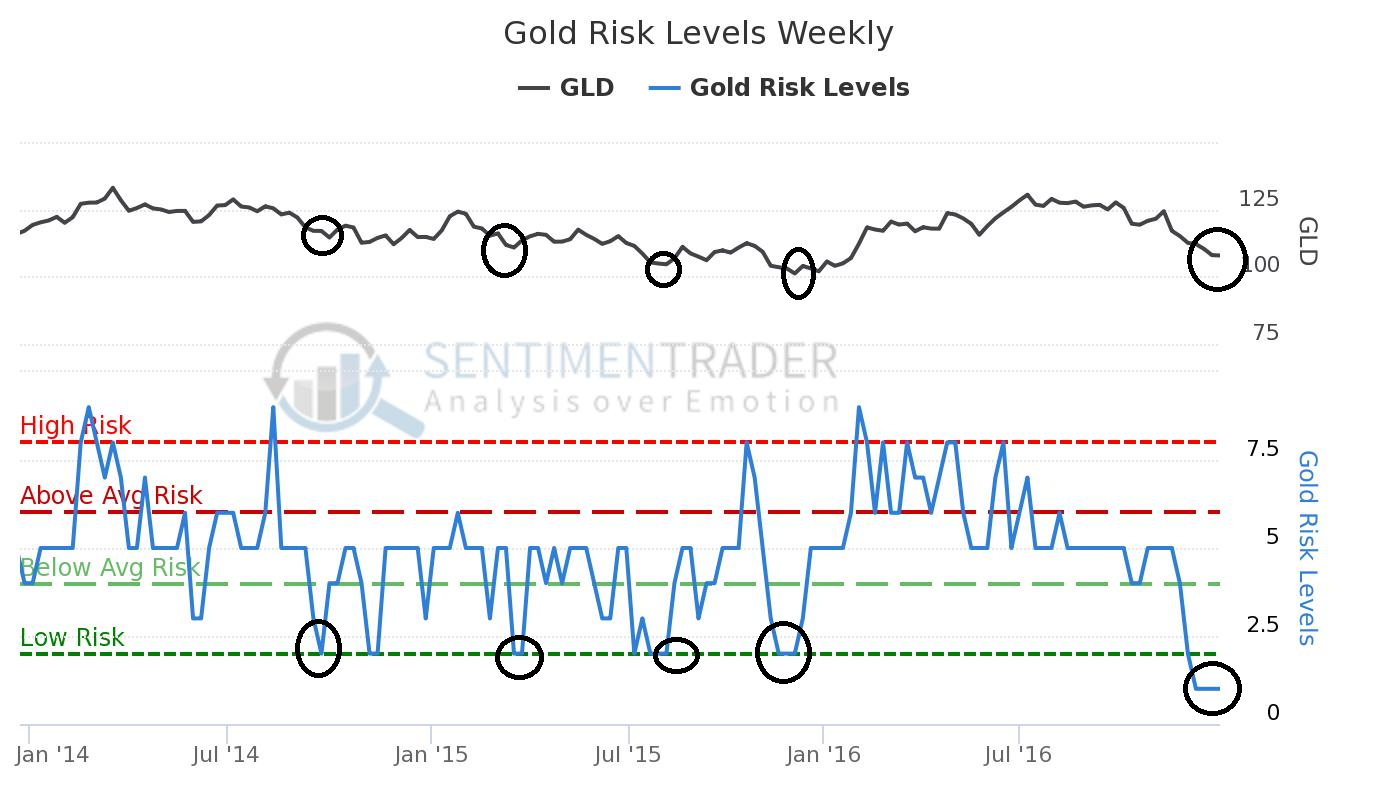
Excessive Pessimism: 2.0
THIS IS WHEN THE BEST OPPORTUNITY TO BUY GOLD IS PRESENTED

Latest Value(s):

– Last Reading: 1.0

– Extreme Values:

– Excessive Optimism: 8.0

gr1


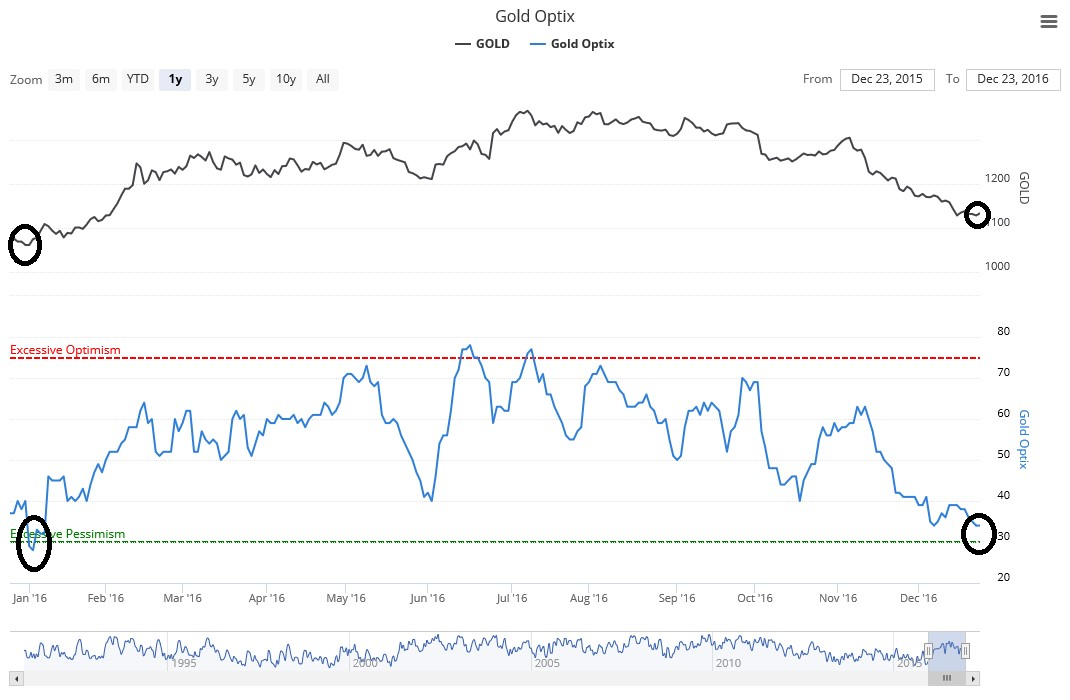
Excessive Pessimism: 30:
THIS IS WHEN THE BEST OPPORTUNITY TO BUY GOLD IS PRESENTED

Latest Value(s):

– Last Reading: 34.0

– Extreme Values:

– Excessive Optimism: 75.0

– Excessive Pessimism: 30.0

gr2


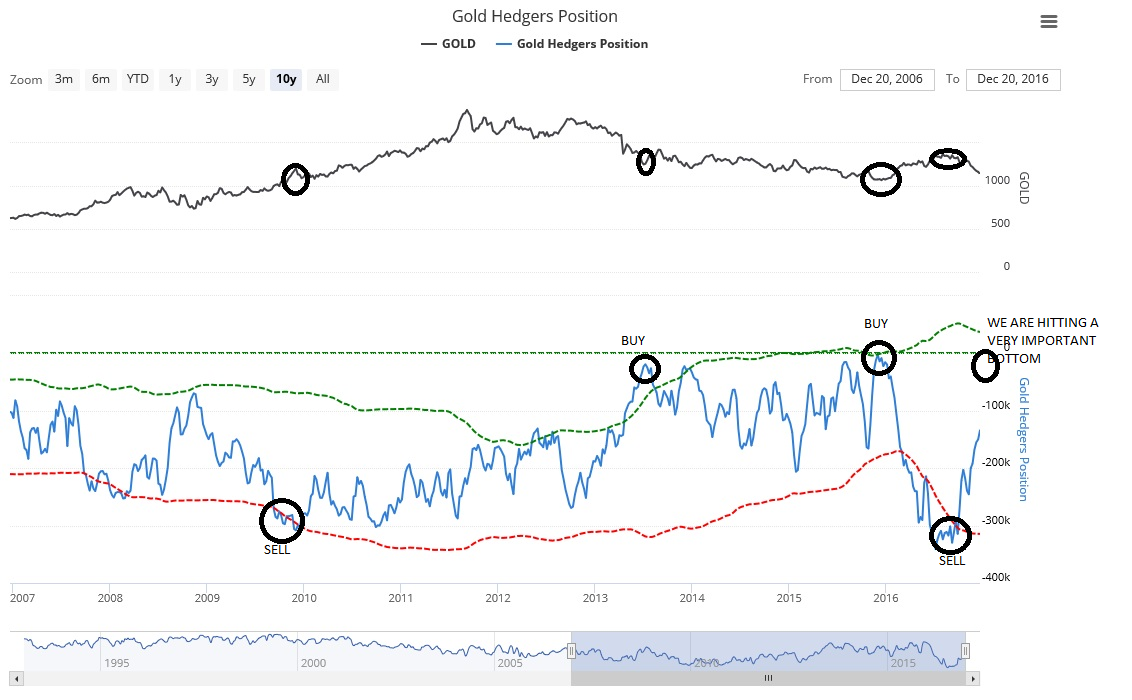
Gold Hedgers Positions

Latest Value(s):

– Last Reading: -134022.0

Extreme Values:

The green dotted line is 1 standard deviation above the 3-year average;
the red dotted line is 1 standard deviation below the 3-year average.

gr3


The Drivers!

A key factor that has driven investments in gold is the negative interest rate in Europe, Japan, Denmark, Sweden, and Switzerland. The sovereign debt of approximately one third of the developed countries traded with a negative yield while an additional 40% of the countries had yields below 1%.

Gold prices will be driven more by its’ value as an ‘investment asset class’. Gold will supersede investments in other ‘asset classes’ such as equity and bonds in due time.

The massive U.S. debt continues to spiral out of control. The Treasury Department’s printing presses are cranking out hundreds of billions of dollars in new money. European countries are imploding financially and the entire European Union is at risk of a collapse.  These ‘geopolitical’ factors will be driving the demand for gold as a ‘safe haven”.

The global ‘retail’ investment market is well positioned for growth what with demand for gold in China, India, Germany and the U.S. for 2017.

Social media is a ‘key driver’ which is critical in both China and India. Financial advisors and financial websites are the key drivers in the U.S. markets. In Germany, banks play the most important influence; ‘Protect wealth against the system’.  It has a competitive advantage compared to other investment options.


Jordan Eliseo, Chief Economist at precious-metals dealer ABC Bullion, says “Gold retreated about 18 percent from its year-to-date high. Afterward, it gained 26 percent in the first half of 2016.  The decline so far, this year has been about 15 percent from its year-to-date high.  Gold, is setting up for another rally in fashion like last year. The recent correction has already drawing in some investors to buy what they see as cheap metal.”


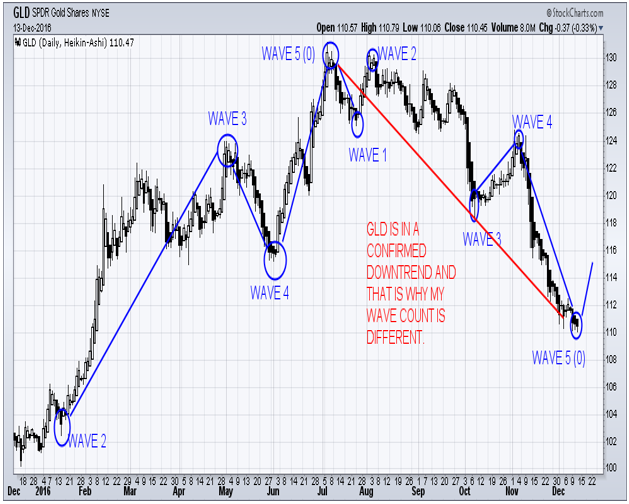
On December 14th my trading partner accurately forecasted the recent bottom in gold which you can see in this gold market forecast.

December 14th Forecast chart:

gr4

He then took things a step further and entered into a NUGT (3x long gold miners ETF) with subscribers and recently locked in 50% profit on the first half and is up over 70% on the balance as of Fridays closing price.


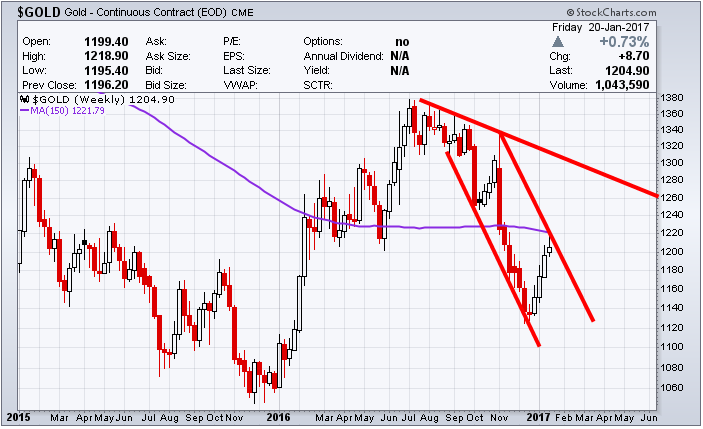
GOLD WEEKLY CHART REMAINS IN DOWNTREND

The constructing on this new infrastructure is going to require a lot of new money. The country is already close to $20 trillion in debt, so if the administration plans to make this one of their priorities, it is going to have to print it.

gr5


‘THE GREAT RESET’

Nixon closed the gold window on August 15th, 1971 and consequently, the world entered a new era.  For the first time in history, all the world’s monies were unbacked fiat currencies, adrift on a sea of floating exchange rates.  This stopped the redemption of currency for gold. Today, gold reserves are nothing more than an asset listed on the FEDS’ balance sheet.  Gold had stopped being an integral part of our financial monetary system

At the top of international commerce, money managers had always known the dangers of ‘currency risk’, but now every currency has become a ‘soft currency’. Recognition of ‘currency risk’ seeped down into the knowledge chain, but on the street of personal financial management, despite it being 45 years later, not many have caught on to the concept.


To Live And/Or Continue Living the American Dream

Golds’ strength is in the role of ‘wealth protection’. It is a ‘safehaven’ and its ‘independence’ from the global financial system makes it a great investment for the future. Gold is still good value for those who do not own any to accumulate ounces.

In a few days, I will be publishing a piece talking about the shift in the economy and what I call “The Great Transfer of Wealth”. Be sure to join my free newsletter below to receive this special report!

Chris Vermeulen
www.TheGoldAndOilGuy.com

Active vs Passive Investing: And the Winner Is …

By Elliott Wave International

The chart below comes from a new report from our friends at Elliott Wave International.

It’s as straightforward as it looks — not much need for animation.

But, perhaps you’re not completely clear about the difference between passive vs. active funds — or about WHY that difference is even worth talking about — then please stick with me as I offer a fast summary.

Active funds include the human element — as in, a fund manager or managers.

Investors who invest in active funds want a manager who can identify trends in a securities market or market index, of stocks or bonds or money market instruments — the fund manager sees opportunities in that market, and decides to allocate the fund accordingly.

The vehicle of choice for passive investing is, the Index Fund. Put simply, these funds track an index — like the Dow or NASDAQ — and wherever the index goes, the fund follows.

Index funds were created in the bear market years of the 1970s. Yet, participation was almost nonexistent until after 1985 — when the great bull market was already underway.

Yet, unlike U.S. stock indexes — which saw two huge declines in the first decade of the 2000s — the growth of index funds has gone in only one direction — up for three decades.

The index funds share of equity mutual funds today exceeds 35% percent, and the trendline is getting steeper.

Total index investing today exceeds 4 Trillion dollars.

So, back to the chart above.

What this chart shows us is how the passive investing trend accelerated in 2016. For the year, 286 billion dollars flowed OUT of active funds — a record amount…

… And it’s no stretch to infer that at least some of this outflow became the inflow into passive funds — some 428.6 billion dollars flowed into active funds in 2016 — also a record.

So the question is — why? Why has the share of index fund investing gone from basically zero in 1985, to more than 35% in 2016?

Why have an ever-greater number of U.S. investors entrusted their money, not to experts, but to the assumption that the stock market itself can just take care of their investment?

These and MANY other questions are answered in Elliott Wave International’s annual State of the Global Markets Report. See below for more details.


Markets all around the world are at a critical juncture — you must see this free report now.

This is the fifth year EWI has created our annual State of the Global Markets Report. And since many markets around the world are at a critical juncture, this may be the most-timely edition of the State of the Global Markets Report yet!

It comes right out of the pages of their paid publications. For a limited time, you can see this report at no cost.

Get your 21-page State of the Global Markets Report — 2017 Edition now.

This article was syndicated by Elliott Wave International and was originally published under the headline Active vs Passive Investing: And the Winner Is …. EWI is the world’s largest market forecasting firm. Its staff of full-time analysts led by Chartered Market Technician Robert Prechter provides 24-hour-a-day market analysis to institutional and private investors around the world.