Author Archive for InvestMacro – Page 599

EUR/USD: Long again after Fed gave no hint of timetable

By GrowthAces.com

Macroeconomic overview

The Federal Reserve kept interest rates unchanged on Wednesday and painted a relatively upbeat picture of the U.S. economy that suggested it was on track to tighten monetary policy this year.

The central bank said job gains remained solid, inflation had increased and economic confidence was rising, although it gave no firm signal on the timing of its next rate move.

The Fed said in its statement it still expects inflation to rise to its 2% target in the medium term, although it noted that market-based measures of inflation compensation are still low and survey-based measures of long-term inflation expectations are little changed.

On Monday, the Commerce Department reported an uptick in inflation to 1.7%.

Money markets had shown a 20% chance of a rise in U.S. rates next month but that slipped to as little as 15% after yesterday’s statement. Yellen may give a clearer signal on the Fed’s thinking when she provides semi-annual testimony to Congress in mid-February.

The ADP National Employment Report showed private employers added 246k jobs in January, up from 151k in December. The report came ahead of the Labor Department’s more comprehensive employment report on Friday, which includes both public and private sector payrolls.

The Institute for Supply Management (ISM) said its index of national factory activity increased 1.5 points to a reading of 56.0 last month, the highest since November 2014. The ISM’s production sub-index increased 2.0 points and a gauge of new orders edged up 0.1 point, reaching its highest level in just over two years. A measure of factory employment jumped 3.3 points to its highest level since August 2014, suggesting factory payrolls likely rose in January for a second straight month. Manufacturers reported paying more for raw materials. That was the 11th consecutive monthly increase, indicating inflation pressures at the factory gate could be building up. The ISM’s prices index jumped 3.5 points in January to its highest level since May 2011.

Technical analysis

The EUR/USD dropped yesterday after strong data from U.S. economy but recovered soon in reaction to Fed statement. As a result a candlestick with long lower shadow was formed. The upward move is continued today and the rate is testing a key resistance level at 1.0815 (50% fibo of November-December fall). A close above that level will open the way to further gains.

EURUSD Daily Forex Signals Chart

Trading strategy

Our long-term view remains bullish. We also opened a long EUR/USD position in the speculative part of our portfolio with the target at 1.0920, slightly below 61.8% fibo of November-December drop.


EUR/GBP: BOE Super Thursday without changes in monetary policy

Today the Bank of England will simultaneously publish the February Inflation Report, the MPC policy decision and the MPC minutes. We expect the Committee to vote unanimously to keep the stance of monetary policy unchanged.

In the minutes of its December meeting, the MPC said, “Monetary policy could respond, in either direction, to changes in the economic outlook as they unfolded to ensure a sustainable return of inflation to the 2% target.” This wait-and-see stance has arisen because of stronger-than-expected economic data since the referendum on the one hand, and a continued expectation for a slowdown ahead on the other amid Brexit-related uncertainty. There has been little news over the last month to change this.

Business surveys of economic activity continue to point to robust growth around the turn of the year. Consequently, BoE staff members are likely to revise up slightly their projections for near-term growth, while leaving the medium-term growth outlook broadly unchanged. The rise in global commodity prices, particularly crude oil, coupled with a surprisingly large 0.4 percentage point jump in inflation to 1.6% yoy in December, will likely lead to a higher path for inflation in the near term than expected in the BoE’s November Report. The almost 3% appreciation of the effective sterling index over the past three months could result in a slightly smaller overshoot of inflation at the two-year horizon.

Governor Mark Carney, in a speech on 16 January, cautioned that developments since the Brexit vote may require a more hawkish monetary policy. We think the central bank will probably try to avoid adding to speculation about a first interest rate hike in nearly a decade, even as it acknowledges the resilience of Britain’s economy since last year’s vote to leave the European Union, which may stop recent GBP rally.

Technical analysis

The technical analysis does not show a clear signal for the EUR/GBP. The rate remains below 7-day exponential moving average, but failed to break below the support level of 0.8489 (January 31 low) and now can see a recovery move. Today’s BOE decision will be probably more important for the EUR/GBP than technical analysis suggestions.

EURGBP Daily Forex Signals Chart

Trading strategy

We opened EUR/GBP long at 0.8580, but the corrective move was even stronger than we had anticipated. We hope that today’s comments from BOE will help the EUR/GBP break above 7-day exponential moving average, which would be an important bullish signal and good news for our strategy.


AUD/USD: Aussie jumped on record trade surplus

Macroeconomic overview

Thursday’s data from the Australian Bureau of Statistics showed a trade surplus of AUD 3.51 billion in December, handily outpacing market forecasts of AUD 2.2 billion. The previous month was also revised up sharply to AUD 2.0 billion.

Exports jumped by 5.3% to a record AUD 32.6 billion, led by double-digit gains in coal and iron ore, while imports edged up only 0.7%.

China was the standout customer as exports surged 28% to top AUD 10 billion for the first time ever.

For the December quarter as a whole, the country notched up a surplus of AUD 4.8 billion in a startling turnaround from the previous quarter’s AUD 3.8 billion shortfall.

The rush of export earnings will ripple through the economy via higher profits, incomes and tax receipts, likely ensuring a rebound in gross domestic product after a shock 0.5% contraction in the third quarter. That should eliminate any fears out there that Australia was at risk of recording a technical recession.

Technical analysis

The AUD/USD broke above 76.4% fibo of November-December fall today. If the rate closes above this level, the way to November high (0.7777) will be widely open. The nearest support level is January 24 high at 0.7608.

AUDUSD Daily Forex Signals Chart

Trading strategy

The AUD/USD is getting closer to our long-term strategy target at 0.7750. Our short-term strategy is to buy the AUD/USD on dips – we have raised our bid to 0.7575.


TRADING STRATEGIES SUMMARY:

(Detailed trading strategies are available only for VIP subscribers)

About the Author:

By GrowthAces.com – Daily Forex Trading Strategies


Fibonacci Retracements Analysis 02.02.2017 (EUR/USD, EUR/GBP)

Article By RoboForex.com

EUR USD, “Euro vs US Dollar”

In case of the EUR/USD pair, the ascending correction continues. The closest target for bulls is the group of fibo-levels at 1.0935 – 1.0920. If later the price rebounds from this area, it may start a new descending correction.

At the H1 chart, the pair rebounded from several local fibo-levels, resumed growing, and, as a result, broke the previous low. On Thursday, the market may continue growing to reach its upside targets.


EUR GBP, “Euro vs Great Britain Pound”

In case of the EUR/GBP pair, the correction may yet continue and break the local high. Possibly, in the nearest future the market may test the retracement of 38.2% again. If the pair rebounds from this level, the market will start a new descending movement.

As we can see at the H1 chart, the pair is trying to rebound from the correctional retracement of 78.6%. If later the price fixes above the retracement of 61.8%, the market may resume growing towards the closest group of fibo-levels near the local high.


RoboForex Analytical Department

Article By RoboForex.com

Attention!
Forecasts presented in this section only reflect the author’s private opinion and should not be considered as guidance for trading. RoboForex LP bears no responsibility for trading results based on trading recommendations described in these analytical reviews.

EUR/USD: euro expected to strengthen in form of flag pattern

By Gabriel Ojimadu, Alpari

Previous:

On Wednesday, trading on the euro closed down. Buyers were unable to hold above 1.0800. First they retreated to the support of 1.0788, and then before the announcement of the Federal Reserve’s decision, slid further to 1.0736.

The weakening dollar held its own after the FOMC meeting. As a result of the meeting, the decision was taken to keep interest rates in the 0.5-0.75% range. The press release showed no indication of when to expect the next hike in rates. After the meeting, the euro recovered from 1.0730 to 1.0789.

Market expectations:

For today (Thursday), the Bank of England’s meeting will be the centre of focus. The main EUR/USD pair will likely be swayed by the EUR/GDP cross. Don’t expect any surprises; interest rates and the QE program will be kept to their current levels. What we can expect is a surge in volatility as Mark Carney gives his speech. Taking into account the data to be released today along with tomorrow’s report on the US labour market; I’m expecting to see a flag pattern with an upward bias in the EUR/USD pair.

Day’s news (GMT+3):

  • 11:15 Switzerland: real retail sales (Dec);
  • 12:00 Eurozone: economic bulletin from ECB;
  • 12:30 UK: PMI construction (Jan);
  • 13:00 Eurozone: Producer Price Index (Dec);
  • 15:00 UK: BoE quarterly inflation report, BoE MPC vote, BoE interest rate decision;
  • 15:15 Eurozone: ECB president Draghi’s speech;
  • 15:30 UK: BoE governor Mark Carney’s speech;
  • 16:30 USA: jobless claims (week ending Jan 27th), nonfarm productivity (Q4), unit labour costs (Q4).

EURUSD rate on the hourly. Source: TradingView

Intraday forecast: low: 1.0762 (current rate in Asia), high: 1.0811, close: 1.0798.

On the back of trading in Europe and the US, the EUR/USD rate fell back to the balance line lb. The price managed to stabilise within the hourly timeframe prior to the Federal Reserve’s announcement of their decision. From a high of 1.0812, there was a pullback of 67 degrees. After the meeting, the rate jumped up by 45 degrees. In Asia, the rate rose to 1.0793.

For Thursday, it looks like a saw pattern is in the works. Given that the euro is strengthening in Asia, it may open down in the European session. There is a risk that before this slide, buyers will test the 1.0800 level. Since the Stochastic is already on top, the rebound from the resistance will be abrupt. For the rally to continue, buyers will need to hold at 1.0775 during the rebound.

Expect a surge in volatility on the currency market during BoE governor Mark Carney’s speech. Keep an eye on the dynamic of the EUR/GDP cross and US bond yields. US bond yields will fall today with the euro correspondingly rising against the US dollar.

I don’t expect the euro will rise above 1.0812 due to Friday’s payrolls. The ADP index turned out to be very positive, an so traders are expecting a strong report on the US labour market.

The Oil War Is Only Just Getting Started

By OilPrice.com

It’s been a month now that investors and analysts have been closely watching two main drivers for oil prices: how OPEC is doing with the supply-cut deal, and how U.S. shale is responding to fifty-plus-dollar oil with rebounding drilling activity. Those two main factors are largely neutralizing each other, and are putting a floor and a cap to a price range of between $50 and $60.

The U.S. rig count has been rising, while OPEC seems unfazed by the resurgence in North American shale activity and is trying to convince the market (and itself) and prove that it would be mostly adhering to the promise to curtail supply in an effort to boost prices and bring markets back to balance. In the next couple of months, official production figures will point to who’s winning this round of the oil wars.

This would be the short-term game between low-cost producers and higher-cost producers.

In the longer run, the latest energy outlook by supermajor BP points to another looming battle for market share, where low-cost producers may try to boost market shares before oil demand peaks.

BP’s Energy Outlook 2017 estimates that there is an abundance of oil resources, and “known resources today dwarf the world’s likely consumption of oil out to 2050 and beyond”.

“In a world where there’s an abundance of potential oil reserves and supply, what we may see is low-cost producers producing ever-increasing amounts of that oil and higher-cost producers getting gradually crowded out,” Spencer Dale, BP group chief economist said.

In BP’s definition of low-cost producers, the majority of the lowest-cost resources sit in large, conventional onshore oilfields, particularly in the Middle East and Russia.

Although this view that low-cost producers would try to seize more market share comes from an oil major with significant interests in Russia and Iraq, for example, BP may not be wrong in predicting that the abundance of oil resources would prompt the lowest-cost producers to pump the most out of low-cost barrels before the world starts to unwind from too much reliance on oil.

Oil demand growth is expected to slow down in the years to come. BP pegs the cumulative oil demand until 2035 at around 700 billion barrels, “significantly less than recoverable oil in the Middle East alone“.

Middle East OPEC production growth would account for all OPEC output growth by 2035, BP reckons, noting that other OPEC production typically has a higher cost base and its market share would drop.

The U.S. liquids production is expected to rise by 4 million bpd to 19 million bpd by 2035, with growth mostly in the first half of the period, driven by tight oil and NGL output.

So, both OPEC’s Middle East members and the U.S. are seen increasing oil and liquids production in the next two decades.

However, OPEC – especially Saudi Arabia – has the recent bitter experience of its pump-at-will policy for market share backfiring on its economy when oil prices crashed.

Another market-share war would involve too many unknowns, including supply-demand basics, leaner and meaner non-OPEC producers, oil price effects on oil-revenue-dependent economies, or rationale for investments in higher-cost areas.

OPEC’s decision to deliberately cut supply and abandon the strategy of pursuing market share at all costs is currently benefiting the cartel’s competitor, U.S. shale.

Commenting on OPEC’s current and future relevance and influence on the oil markets, Wood Mackenzie said in an analysis last week:

The group may still be able to control oil prices to a limited degree, but the benefits of that control will accrue to parties outside the cartel. If OPEC remains a functional entity by the end of 2017, its greatest hits will surely be in the past.

Five or ten years from now, a possible market share ‘oil war’ would take place on a totally different battleground, and some regiments or battalions may lack essential armory to wage such war.

Link to original article: http://oilprice.com/Energy/Crude-Oil/The-Oil-War-Is-Only-Just-Getting-Started.html

By Tsvetana Paraskova for Oilprice.com


Wave Analysis 01.02.2017 (EUR/USD, GBP/USD, USD/JPY, AUD/USD)

Article By RoboForex.com

EUR USD, “Euro vs US Dollar”

Probably, the EUR/USD pair is still forming the ascending impulse [c] of the zigzag in the wave 2. In the nearest future, the market may continue moving upwards. If later the price forms the descending impulse in the wave [i], the pair may resume its decline.

More detailed structure is shown on the H1 chart. It looks like the wave [b] took the form of the flat with the diagonal triangle (c) inside it. At the moment, the pair is finishing the fourth wave of the ascending impulse in the wave [c]. Consequently, in the nearest future the market may form the bullish (v) of [с].


GBP USD, “Great Britain Pound vs US Dollar”

After finishing the wave [iii], the GBP/USD pair started a new correction and formed the ascending zigzag, which may be the wave (a) or (w). Consequently, during the next several days the market may fall in the wave c inside another zigzag, this time in the wave (b) or (x).

As we can see at the M30 chart, after finishing the impulse in the wave a, the pair started a new correction. It looks like the price may start a short-term growth in the wave [C] of the ascending zigzag in the wave b.


USD JPY, “US Dollar vs Japanese Yen”

In case of the USD/JPY pair, the correction continues as well. It looks like the wave [c] of 2 is taking the form of the diagonal triangle and may yet reach a new local low while forming this pattern. To confirm a new ascending movement, the market has to form the bullish impulse in the wave [i].

As we can see at the H1 chart, the pair is forming the fourth wave of the wave [c] of 2. On Wednesday, the local correction may yet continue, but later the price is expected to resume falling in the fifth wave and test the downside border of the pattern from the H4 chart.


AUD USD, “Australian Dollar vs US Dollar”

After finishing the bullish impulse in the wave (a), the AUD/USD pair is still consolidating. in the nearest future the market may complete the local correction and break the high while forming the wave (c) of [ii].

At the H1 chart, the pair is probably forming the wave (b). It’s highly likely that on Wednesday the price may start a short-term decline in the wave c and break the low of the wave a. Later, the market is expected to start a new growth and break the previous high.


RoboForex Analytical Department

Article By RoboForex.com

Attention!
Forecasts presented in this section only reflect the author’s private opinion and should not be considered as guidance for trading. RoboForex LP bears no responsibility for trading results based on trading recommendations described in these analytical reviews.

Furore over Trump administration’s currency exploitation rhetoric is naïve and hypocritical

By George Prior

The furore over the Trump administration’s currency exploitation rhetoric is “naive” and “hypocritical,” affirms the boss of one of the world’s largest independent financial advisory organizations.

Nigel Green, founder and CEO of deVere Group, is speaking out after controversial comments given to the Financial Times by the U.S. President’s top trade adviser.

Mr Green observes: “Germany has become the latest country after Mexico, China and Japan, to be labelled a currency manipulator by the Trump administration, which seems determined to challenge trading partners that run large surpluses with the U.S.

“The Head of the new U.S. National Trade Council, Mr Navarro, insists that the Euro is like an “implicit” Deutsche Mark, whose ‘grossly’ low valuation gives Germany an unfair advantage over its trading partners, such as the U.S. and the EU.

“Whilst, he was criticizing Germany, President Trump was lambasting China and Japan for devaluing their currencies at a meeting with top pharmaceutical executives.”

At that meeting, Mr Trump said: “They play the money market, they play the devaluation market, while we sit here like a bunch of dummies.”

The deVere CEO continues: “The rhetoric from the administration, and possibly the increasing likelihood of currency wars has, perhaps unsurprisingly, caused international furore.

“However, much of the indignation – on both sides – is naive and hypocritical.

“Whilst it may not be fair nor right, it can be sensibly assumed that currency manipulations do indeed take place around the world as central banks, quite rightly, look out for their jurisdictions’ best interest using all their tools that they have at their disposal, such as competitive devaluations. As such, the outcry following Mr Navarro’s statements seems somewhat naïve. It is also perhaps naïve to think that a Trump administration would not take this approach, given the previous rhetoric on this issue.

“It seems it is Mr Navarro’s perception that Germany’s economy has considerably benefitted from having a weak currency, the Euro. Like many, he argues that if it had remained with its stronger Deutsche Mark, its exports – which account for almost half of its economic output – would not have been nearly so robust, especially amongst other Eurozone countries.

“The opposite is true for other EU nations, such as Spain, who have suffered extra competitive burdens by having a currency that is stronger than their former ones, such as the peseta.”

Mr Green goes on to say: “On the other hand, there is a whiff of hypocrisy here too from the U.S. government.

“Indeed, the term ‘currency wars’ originated from the Brazilians after the Fed began their Quantitative Easing operations at the end of 2008 and the dollar weakened. ‎The U.S. has, it can be argued, been as enthusiastic about using monetary policy to devalue as the Europeans and the Asians.”


deVere Group is one of the world’s largest independent advisors of specialist global financial solutions to international, local mass affluent, and high-net-worth clients.  It has a network of more than 70 offices across the world, over 80,000 clients and $12bn under advisement.

www.devere-group.com


EUR/USD: Profit taken at 1.0810, long-term outlook remains bullish

By GrowthAces.com

Macroeconomic overview

A senior trade adviser to the president Donald Trump, Peter Navarro, said the euro was “grossly undervalued”. Navarro’s comments were followed by Trump himself, who complained that “every other country lives on devaluation” while the United States “sit(s) there like a bunch of dummies”. As we expected and highlighted many times in our publications – it looks like investors betting on the USD appreciation under Trump presidency were wrong.

The comments from Trump at the end of a White House meeting with pharmaceutical executives, as well as from trade adviser Peter Navarro in a newspaper interview, were the starkest indication yet that the first-term Republican president is prepared to jettison two decades of “strong dollar” policies advocated by predecessors dating back to the Clinton administration.

The criticism also signals a weakening of the U.S. commitment to an agreement among the financial leaders of the world’s top 20 economies, struck after the 2008 financial crisis, that countries would not pursue policies to target exchange rates for competitive purposes.

On the other hand, macroeconomic data from the Eurozone suggest that ECB will have to revise its projections soon.

The monetary policy implications of the latest macro data can be best assessed by comparing the actual growth and inflation outcomes to the ECB forecasts published on 8 December. GDP growth in the fourth quarter 2016 seems to have been much in line with the ECB’s fan chart, while, at face value, survey-based information available for January suggests some slight upside risks to the central bank’s growth forecast for the first quarter 2017. Some upward revisions to previous GDP data strengthen the carryover entering 2017. Therefore, the growth picture is developing better than the ECB predicted in December. On the inflation front, the latest data have clearly exceeded the central bank’s expectations. The ECB will almost certainly clearly revise up its CPI projection for this year. If it leaves the trajectory for the remaining part of the forecast horizon, it will imply a humped-shaped inflation path with a relatively strong 2017 and slowdown in inflation in 2018. We do not believe in such a scenario, as we do not see any macroeconomic factors hampering inflation, unless there is a significant rise in EUR value.

We do not think that this new scenario deserves a rethinking of the policy set-up announced in December, given its dovish bias. It does, however, increase the ECB confidence that downside risks are slowly dissipating. This may convince the central bank to drop its bias for an extension/expansion of asset purchases.

Today the FOMC will release the statement after its firs meeting of the year. The composition of the voting members in 2017 is certainly more dovish/less hawkish than it was in 2016, when three Committee members (Esther George, Loretta Mester and Eric Rosengren) dissented in favor of higher rates. They (and Jim Bullard) are replaced by four members who have been signaling much more patience in terms of policy normalization. The new voting members are: Charles Evans (Chicago), Patrick Harker (Philadelphia), Robert Kaplan (Dallas) and Neel Kashkari (Minneapolis).

After the Fed raised its target rate by another 25bp at the previous meeting, in mid-December, it will this time leave its policy stance unchanged. And with no post-meeting press conference, the focus will be on the FOMC statement. We think that the tone and overall message will be similar to the one given by Chair Yellen in her speeches last week:

1) As the economy is close to the Fed’s goals of maximum employment and price stability (2% inflation), the Committee will continue to normalize its policy stance.

2) But economic conditions will evolve in a manner that will warrant only gradual increases.

In fact, that is basically the same message that was already provided by the previous statement, which means that we are not looking for a lot of changes. We do not expect a strong hint for the timing of the next rate hike. Investors looking for hawkish signals in today’s statement may be disappointed.

Technical analysis

A rejection of downward move on Monday and a long white candlestick yesterday suggest that the EUR/USD remains in bullish trend. The nearest resistance levels are 50% fibo of November-December fall at 1.0815 and December high at 1.0872.  These levels are likely to be broken in case of less hawkish than expected FOMC statement today.

EURUSD Daily Forex Signals Chart

Trading strategy

We took profit on EUR/USD long at 1.0810 in the short-term part of our portfolio yesterday, but we also opened a long-term strategy with the target at 1.1090. Short-term moves depend on today’s FOMC statement, which in our opinion is likely to be less hawkish than expected. Long-term outlook is bullish because of accelerating economic growth and inflation in the Eurozone. What is more, recent comments from Donald Trump on the USD strength suggest that betting on further USD appreciation would not be a winning strategy.


USD/CAD: Profit taken on short position after better-than-expected Canadian GDP data

Macroeconomic overview

The global financial crisis has left the Canadian economy with persistent excess capacity, Bank of Canada Governor Stephen Poloz said on Tuesday, adding that geopolitical risk and uncertainty make it harder to know if policy is on track.

In a speech focused on the strengths and weaknesses of the bank’s economic modeling over the years, Poloz said policymakers are always mindful of the uncertainties that might cause Canada to undershoot or overshoot the bank’s inflation target.

“While we project that inflation will be sustainably at target around the middle of next year, we are well aware that the lingering aftermath of the crisis has left the Canadian economy with persistent excess capacity, and inflation has been in the lower half of our target range for some time,” Poloz said.

He also said it is “ill-advised” to reduce interest rate decisions to a mechanical action, given the uncertainty in economic models.

In his speech to the University of Alberta business school, Poloz said that while the idea of a zone generated by uncertainty can create some tolerance for small shocks, a large shock or series of smaller ones can tilt the balance of risks, prompting policy action.

Canada’s central bank cut rates twice in 2015 to stimulate the economy in the wake of falling crude oil prices, but has since left rates unchanged amid tepid growth. The bank is not expected to raise rates until 2018, even though the U.S. Federal Reserve has begun to tighten policy.

Poloz made clear the bank sees no need to follow the Fed.

“We’re still quite some ways behind the U.S. economy, so a divergence of policy is exactly what we would expect to see,” he said after the speech.

He reiterated that the firmer Canadian dollar is a headwind for the export sector, where growth has not been as strong as the bank anticipated.

A week after U.S. President Donald Trump signed orders to clear the way for the Keystone XL oil pipeline to be built, Poloz said in an interview with the Edmonton Journal that while the construction of new pipelines would help the economy, it was not a magic bullet.

Yesterday’s data showed that Canadian economy grew 0.4% in November from October, helped by a rebound in manufacturing. That beat the 0.3% increase forecast by the market.

Technical analysis

The USD/CAD broke below the support at 50% fibo of May-December rise (1.3028) yesterday, but it did not close above that level. Nevertheless this is an important bearish signal and we may see another attempt to close below this level soon, even today if FOMC statement is less hawkish than expected.

USDCAD Daily Forex Signals Chart

Trading strategy

We took profit on our USD/CAD short at 1.3030 in the shot-term part of our portfolio yesterday. Our long-term view remains bearish. We are waiting for today’s FOMC statement before placing another order in the speculative part of our trading portfolio.


NZD/USD: Kiwi falls after weaker labor market data

Macroeconomic overview

New Zealand’s jobless rate jumped and wage growth stayed sluggish as more people flooded the workforce in the fourth quarter.

New Zealand’s unemployment rate increased to 5.2% in the fourth quarter of 2016 from 4.9% in the previous period, worse than market expectations of 4.8%. It was the highest unemployment rate since the March quarter of 2016, as the number of unemployed rose by 7.6% while employment went up 0.8%. The labour force participation rate increased to an all-time high of 70.5%.

New Zealand - Labor Market

Wage growth was very muted with 0.4% quarterly growth and an annual rise of 1.6%.

Key to this moderation has been record levels of migration which has expanded the workforce faster than jobs could be created.

Employment grew 0.8% in the December 2016 quarter, with 19k more people being employed. This followed a 1.3% increase in employment in the September 2016 quarter.

Full-time employment rose 1.6% in the December quarter, with an extra 32k people being employed full-time. In contrast, part-time employment fell 2.2%, down 12k people.

The RBNZ’s next policy announcement is on February 9 and it is considered certain to keep rates at 1.75% given economic growth has been among the highest in the developed world. The NZD fell after the data, drifting away from a 10-week high of 0.7350 as investors pared back the chance of a rate hike. The Kiwi has had a strong run against the greenback so far this year, so a corrective move is likely in the short term.

Technical analysis

The overall structure looks bullish now as RSIs are biased up and the rate remains above 14-day exponential moving average. But long upper shadow on yesterday’s candlestick suggests that the rate may stop in the area of 0.7220-0.7350 for a while.

NZDUSD Daily Forex Signals Chart

Trading strategy

We expect the NZD/USD to fluctuate in the area of 0.7220-0.7350 in the coming sessions and we are looking to buy this pair near the lower limit of this range. We think that after a period of horizontal move the rate is likely to go further up towards November high (0.7402).


TRADING STRATEGIES SUMMARY:

(Detailed trading strategies are available only for VIP subscribers)

About the Author:

By GrowthAces.com – Daily Forex Trading Strategies


Forex Technical Analysis & Forecast 01.02.2017 (EUR/USD, GBP/USD, USD/CHF, USD/JPY, AUD/USD, USD/RUB, GOLD, BRENT)

Article By RoboForex.com

EUR USD, “Euro vs US Dollar”

The EUR/USD pair has completed the ascending structure, which was implied by an alternative scenario. Possibly, today the price may fall towards 1.0690 and grow with the target at 1.0750.


GBP USD, “Great Britain Pound vs US Dollar”

The GBP/USD pair has completed the ascending impulse. Possibly, today the price may fall towards 1.2500, thus forming another consolidation range. If later the market breaks this range to the downside, the instrument may fall to reach 1.2164; if to the upside – grow with the target at 1.2814.


USD CHF, “US Dollar vs Swiss Franc”

The USD/CHF pair has reached the target of the descending wave. Possibly, today the price may grow towards 0.9942. Later, in our opinion, the market may fall to reach 0.910 and then continue moving upwards with the target at 1.0024.


USD JPY, “US Dollar vs Japanese Yen”

The USD/JPY pair is moving upwards with the target at. 114.14. Possibly, the price may reach 113.76 and then fall towards 113.11.


AUD USD, “Australian Dollar vs US Dollar”

The AUD/USD pair is consolidating at the top of the ascending wave. Possibly, today the price may fall towards 0.7500 and then grow to return to 0.7555.


USD RUB, “US Dollar vs Russian Ruble”

In case of the USD/RUB pair, today the price may probably grow to reach 60.86. After that, the instrument may start falling with the target at 58.50.


XAU USD, “Gold vs US Dollar”

Gold has completed the ascending correctional structure. Possibly, today the price may continue falling inside the downtrend with the target at 1189 or even 1165.


BRENT

Being under pressure, Brent is moving downwards. Possibly, today the price may fall to reach 55.00 or even 54.70.


RoboForex Analytical Department

Article By RoboForex.com

Attention!
Forecasts presented in this section only reflect the author’s private opinion and should not be considered as guidance for trading. RoboForex LP bears no responsibility for trading results based on trading recommendations described in these analytical reviews.

EUR/USD: correction to 1.0775 likely as we await results of Federal Reserve meeting

By Gabriel Ojimadu, Alpari

Previous:

On Tuesday the euro closed up by 0.99%. The strengthening of the single currency began in the European session, and sped up during American trading hours. Experts agree that this rise is a result of comments made by one of US president Donald Trump’s advisors.

Peter Navarro, director of the National Trade Council, accused Germany of currency manipulation. He claims that Berlin is artificially devaluing the euro to give them the upper hand in trades with the US and other European countries. In a Financial Times interview, he also noted that the euro has turned into an “implicit Deutsche Mark”.

The American statistics released yesterday turned out worse than expected. The Chicago Purchasing Managers’ Index fell to around 50.3 (forecasted: 55.0, previous figure: 54.6). The US Consumer Confidence Index fell to 111.8 (forecasted: 113, previous: 113.3).

Market expectations:

For Wednesday, the Federal Reserve meeting, and an ADP report on employment are the centre of attention. The current rate is expected to remain unchanged. The likelihood of rates being raised is about 4%.

After yesterday’s rally, the euro may step back to around 1.0775 before the federal Reserve meeting. I’d rather not discuss politics, but in recent weeks, currency rates have been quite sensitive to statements made by White House representatives.

Donald Trump’s victory was a blow to America’s elite, and now they are trying to use the mass protests against him to force his hand. If it turns out he can’t be controlled this way, they will likely try to threaten him with impeachment. In the first 100 days of Trump’s presidency, uncertainty persists.

Day’s news:

  • 10:00 UK: Nationwide housing prices (Jan);
  • 11:30 Switzerland: Purchasing Managers’ Index (Jan);
  • 11:55 Germany: Markit Manufacturing PMI (Jan);
  • 12:00 Eurozone: Markit Manufacturing PMI (Jan);
  • 12:30 UK: Markit Manufacturing PMI (Jan);
  • 16:15 USA: ADP employment change (Jan);
  • 17:30 Canada: RBC Manufacturing PMI (Jan);
  • 17:45 USA: Markit Manufacturing PMI (Jan);
  • 18:00 USA: ISM Manufacturing PMI (Jan), construction spending (Dec), ISM prices paid (Jan);
  • 18:30 USA: EIA crude oil stocks change (week ending Jan 27);
  • 22:00 USA: Federal Reserve decision on interest rates.

EURUSD rate on the hourly. Source: TradingView

Intraday forecast: low: n/a, high: n/a, close: n/a

Eward Navotny sent the euro down to 1.0620, and Peter Navarro sent it back up to 1.0820. Who will be next to stage a verbal intervention on the Forex market?

Because of the Federal Reserve meeting today, I’m not going to make any predictions. Given a 13-hour consolidation period, the rate may again approach 1.0827. On the daily timeframe, the euro is heading to a maximum of 1.0873; its highest since the 8th of December 2016. The market, for the most part, is not expecting a rate hike from the Federal Reserve. In this regard, retailers are unlikely to be able to stop consumers.

Judging by the fact that the price has begun to roll away from U3, there is a possibility of buyers retreating to the trend line (around 1.0775) on the back of rising US bond yields.

Wealth Minerals Ltd, Lithium Brines in Chile, White Hot

By Peter Epstein, CFA, MBA   [email protected]  http://EpsteinResearch.com 

It’s January 2017, President Trump has taken up official residence in the White House and the lithium market remains White hot.  Is there a connection?  No.  There’s no natural reason to trot out the insatiable lithium demand narrative yet again, is there?  Well, no, but I will anyway.  2016 was a remarkable year for natural resource investors, almost everyone had a thrilling ride.  Lithium stocks were very strong until July, then cooled off through October.  Even coal stocks flourished!  Gold & silver had huge runs, but ran out of steam in August.  Uranium was a complete dud, until all of a sudden, in November, it wasn’t.

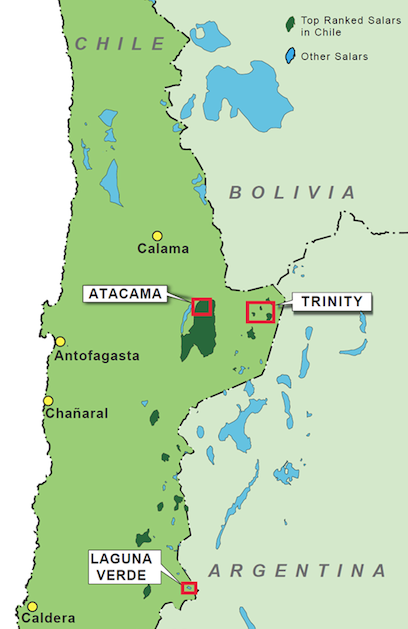
What sectors will be hot in 2017?  I have no idea, but if you think Cannabis / Marijuana is the play, then you’re reading the wrong article.  This piece is on lithium, where there’s rapidly growing interest in brine projects in Chile.  This is a new development in the sector because Chile had been a no-go zone for juniors until about 6-9 months ago.  Now it’s a, must-go-make-a-deal-immediately zone, and the stampede is just beginning.  First movers like Wealth Minerals (TSX-V: WML) / (OTC: WMLLF), Lithium Power Intl., LiCo Energy and Bearing Resources have a notable head start, but the number of players will likely double or triple before long.

Ok, slow down now, let me catch my breath…. There’s a good reason why Chile hasn’t been overrun by lithium company wannabes, yet…. Like Argentina, Chile is still a place where long-standing relationships, boots on the ground, are not just important, they’re a pre-requisite for doing business.  Newcomers to Chile are about a year behind Argentina’s bumper crop, but things are moving even faster this time around.  Will the lithium boom outlast Trump’s Presidency?

To find out more, I tapped CEO Henk van Alphen of Wealth Minerals.  At the end of the interview, I was fortunate to be able to sneak in questions for Executive Director (Chile), Marcelo Awad and President Tim McCutcheon.

Epstein Research [ER]:  Lithium junior management teams with assets across the globe, ALL say they have great, “connections” with the powers that be.  How can readers be confident Wealth Minerals’ team truly has strong relationships in Chile?

CEO Alphen:  That’s a fair question, a clear distinction between us and other juniors is that myself, Directors Marcelo Awad and Leonard Harris, President Tim McCutcheon and COO/Director Juan Tang have very significant mineral resources experience in South America, (Peru/Chile/Argentina).  Management teams retain lawyers, consultants & deal makers, but if key executives have limited or no in-country relationships, that’s a big problem.

I’ve been investing, working and operating in South America for 26 years, South America is my backyard.  Marcelo’s reputation speaks for itself, he’s one of the best known and most respected mining executives on the continent.  He opens doors for us that other teams don’t know exist.  Our COO Juan Tang has an ideal background for Wealth Minerals, he’s a world-class environmental engineer and has tremendous relationships in China, combined with substantial mining experience in Peru, and he’s fluent in Mandarin, Spanish & English.

[ER]:  Is the endgame for Wealth Minerals simply to sell the company to the highest bidder later this year or next?  ​

Alphen:  We have every intention of advancing each of our projects as far and as fast as we can.  Along the way we expect to partner on some or all of our projects.  Interest in Chile, in lithium and in our concessions is increasing by the day.  We are in talks to lock down additional concessions, but we have nothing definitive to report at this time.  While the rush into jurisdictions like Nevada, Quebec/Ontario, even northern Argentina could be about to hit a brick wall, the opposite is true in Chile.  We have a very significant first mover advantage.

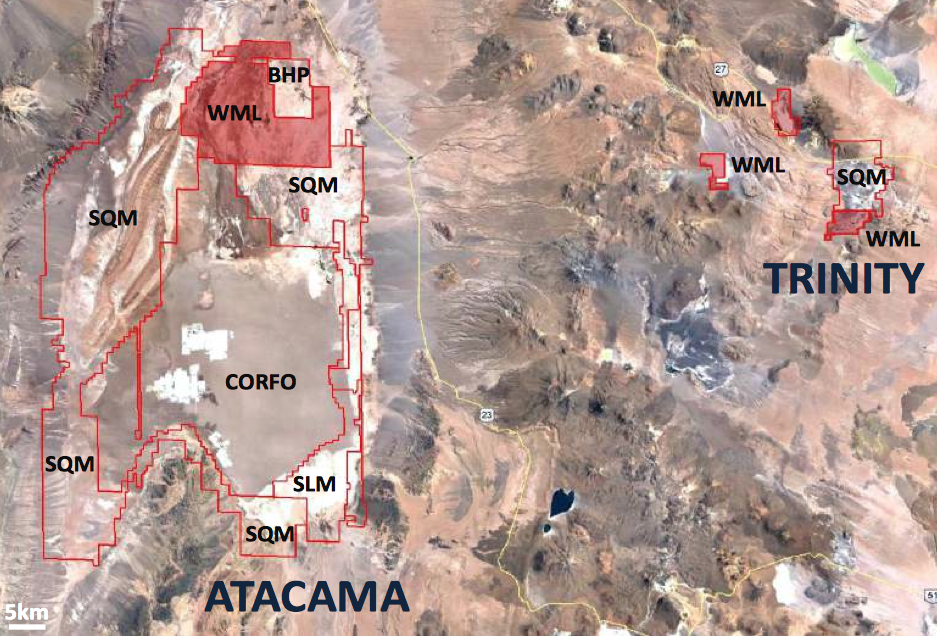
Recent transactions among newcomers and local companies are sending a clear message.  The price of playing poker in Chile has gone way up…..  Recently, a junior signed an agreement to earn a 50% interest in an exploitation concession in the Atacama.  The price of this poker hand?  Cash plus shares in the company worth about US$ 9 M.  To earn another 10%, the ante goes up again– another US$ 10 M.  This project is considerably more advanced then our green field Atacama project, but it’s smaller.  Ultimately, we feel this is good for first movers like us if it means followers get priced out of the market.

[ER]:  I think you are referring to LiCo Energy’s announced LOI to acquire up to a 60% Interest in the Purickutal lithium exploitation concession.  Are there other comparable transactions of note?

Alphen:  Yes, LiCo Energy, an interesting company that also has a cobalt play.  Another transaction involved Lithium Power Intl. acquiring a 50% stake in the Maricunga project in the Salar de Maricunga.  I believe they’re investing US$ 27 M = C$ 36 M in cash, plus 16 M shares in LPI.ax (worth about C$6 M at issuance), for 50% of the project.  That’s ~US$ 14,000/hectare, net to Lithium Power.  We’re paying ~US$ 660/hectare on our 46,200 hectare Atacama project.  Having said that, the Maricunga project is well more advanced.

[ER]:  What are the biggest risks facing the Company?

Alphen:  Like most natural resource juniors, we are a highly speculative company, exposed to many significant risks.  Obviously, a perceived big risk is our choice to build a lithium portfolio in Chile, but we feel we’ve done our homework and have very experienced people who know what they’re doing, so Chile is a risk that we’ve embraced.  If Chile was a no-brainer, we wouldn’t have the opportunity we have today.  Funding is the other key challenge we will be working hard on this year.

That’s why we’re in continuous discussions with multiple interested parties on a number of corporate initiatives.  We expect to fund operations with a combination of cash payments from farm-out partners and equity capital.  So for example, we might sell down our 100% ownership in a project to say, 30% ownership, in exchange for being free-carried for a number of years.  Doing that would de-risk Wealth Minerals’s portfolio and it’s something we will start doing as soon as this quarter.

[ER]:  Are you looking at additional acquisitions?  Or, do you have enough on your plate?

Alphen:  We currently have 5 projects about 55,000 hectares.  As long as we continue to strike great deals, we will go for it.  We don’t see signs of a slowing of interest in lithium brines in Chile.  We’re looking for transactions that complement our existing portfolio and increase our head start.  Each concession we control is one that a competitor cannot, unless they come to us.  This year will also be a lot about exploration and moving our projects forward.  Shareholders can look forward to brine sampling, geophysics and most importantly drilling, initially focussed on the Atacama.

Atacama is host to the best environment for harvesting lithium brines on the planet.  We have both the highest grades and evaporation rates.  That means desired lithium concentrations from solar evaporation can be obtained 25% to 50% faster, and that’s why the Atacama has the lowest cost production in the word at around US$ 2,500 – US$ 3,000/metric tonne.

[ER]:  Marcelo, you are a well known and respected mining executive in South America, with 18 years at Codelco and 16 more at Antofagasta Minerals.  You could be actively involved in any company or sector… Why did you choose lithium, and why Wealth Minerals?

Mr. Marcelo Awad:  That’s true, I have had the chance since I left Antofagasta Minerals to join big Companies, but I decided to build up a portfolio of Boards and Advising Roles.  Fortunately that decision went well.  With Henk we’ve known each other for years and last year he told me about his plan to acquire Lithium assets in Chile and asked me if would I assist him to do so.  I immediately got interested because I knew his ability and reputation as head of Wealth Minerals and also because I was reading about the Lithium market and the big potential Chile had based on the size of its reserves.  I told myself with my mining knowledge, this was a good opportunity to help both Chile and Wealth Minerals in the development of the Lithium business, which will certainly help the Chilean economy.

[ER]:  Tim, can you describe the differences among global lithium brine operations / proposed projects?  How does Wealth Minerals’ Proyecto Atacama project fit in?

Mr. Tim McCutcheon:  There are several factors that determine the success of a lithium brine deposit.  One is size of the overall salar, each has a balance of water coming in and going out.  A challenge for extracting lithium is to ensure extracted brine is replenished.  Water is the mechanism that conveys lithium to surface for processing – no water means no lithium.  Larger salars have more water coming in, allowing more to go out, without harming a salar’s equilibrium.  Smaller salars face physical limits on how much processing capacity can be installed.  As the 3rd largest salar in the world, Atacama has tremendous lithium production capacity.

Grade is another critical factor.  Larger salars are older, so there’s been more time for lithium to be deposited, which translates to higher grade.  SQM’s grade is 2-3 times larger than many other global brine projects.  It’s no surprise that lithium brine extraction was pioneered in the Atacama.

A last factor is aridness.  There are many technologies, most unproven at commercial scale, to produce lithium from brine extracts, but by far the lowest-risk is open air evaporation.  The Atacama salar sits at low altitude compared to most other lithium-bearing salars.  And, it’s possibly the direst place on the planet.  Therefore, it has the highest evaporation rate, leading to the lowest production cost in the industry.

Disclosures: The content of this article is for informational and illustrative purposes only. Readers fully understand and agree that nothing contained herein, written by Peter Epstein of Epstein Research[ER] including but not limited to, commentary, opinions, views, assumptions, reported facts, estimates, calculations, etc. is to be considered, in any way whatsoever, implicit or explicit investment advice. Further, nothing contained herein is a recommendation or solicitation to buy or sell any security. The content contained herein is not directed at any individual or group. Mr. Epstein and [ER] are not responsible, under any circumstances whatsoever, for investment actions taken by the reader. Mr. Epstein and [ER] have never been, and are not currently, a registered or licensed financial advisor or broker/dealer, investment advisor, stockbroker, trader, money manager, compliance or legal officer, and they do not perform market making activities. Mr. Epstein and [ER] are not directly employed by any company, group, organization, party or person. Shares of Wealth Minerals are highly speculative, not suitable for all investors. Readers understand and agree that investments in small cap stocks can result in a 100% loss of invested funds. It is assumed and agreed upon by readers that they consult with their own licensed or registered financial advisors before making investment decisions.

At the time this article was posted, Peter Epstein owned shares in Wealth Minerals and the Company was a sponsor ofEpstein ResearchReaders understand and agree that they must conduct their own research, above and beyond reading this article. While the author believes he’s diligent in screening out companies that are unattractive investment opportunities, he cannot guarantee that his efforts will (or have been) successful. Mr. Epstein & [ER] are not responsible for any perceived, or actual, errors including, but not limited to, commentary, opinions, views, assumptions, reported facts & financial calculations, or for the completeness of this article or future content. Mr. Epstein & [ER] are not expected or required to subsequently follow or cover events & news, or write about any particular company or topic. Mr. Epstein and [ER] are not experts in any company, industry sector or investment topic.