Our recent analysis bases on a previous report of the potential for a further run in the US markets based on a number of technical and fundamental factors leads to the question of “what could happen with Gold and Silver”. A broad US market rally may put some pressure on the metals markets initially, but, in our opinion, the increase in volatility and uncertainty will likely prompt more potential for upward price action in precious metals.
As with most things in the midst of uncertainty and transition, the US Presidential election has caused many traders to rethink positions and potential. As foreign elections continue to play out, wild currency moves are starting to become more of a standard for volatility. Combine this with a new US President and a repositioning of US global and local objectives and we believe we are setting up for one of the most expansive moves in recent years for the US general markets and the metals markets. This week, alone, we have seen a flurry of action in DC and the US markets broke upward on news of the Dakota Pipeline and other Executive actions.
As we wrote week or so ago, we believe the US markets will push higher in 2017 a business investment, US strategy and foreign capital runs back into the US equity market chasing opportunity and gains. Additionally, we believe the strength of the US market, paired with continued strength of the US Dollar, will drive a further increase in global volatility and wild swings in foreign markets. This volatility, uncertainty and equity repositioning will likely drive Gold and Silver to continued highs throughout 2017 – possibly much longer if the new trend generates renewed follow-through.
Our belief that the US markets will continue to melt-up while certain foreign markets deteriorate relates to our belief that currency variances will become more volatile and excessive over the next few months. This, in combination with a renewed interest in developing US economic solutions, will likely drive the US markets higher while the metals markets will continue to become a safe-haven for US and foreign investors to protect against deflation and foreign market corrections.
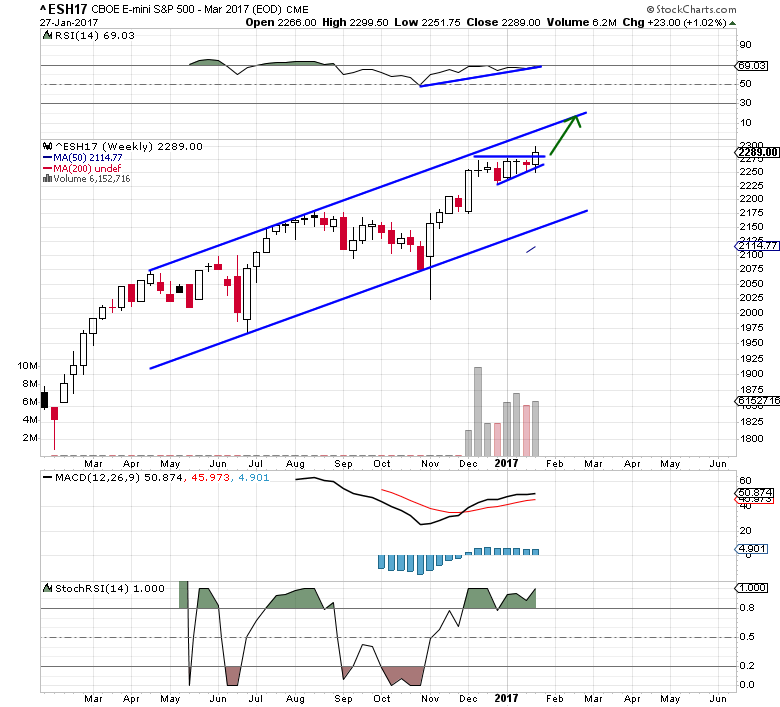
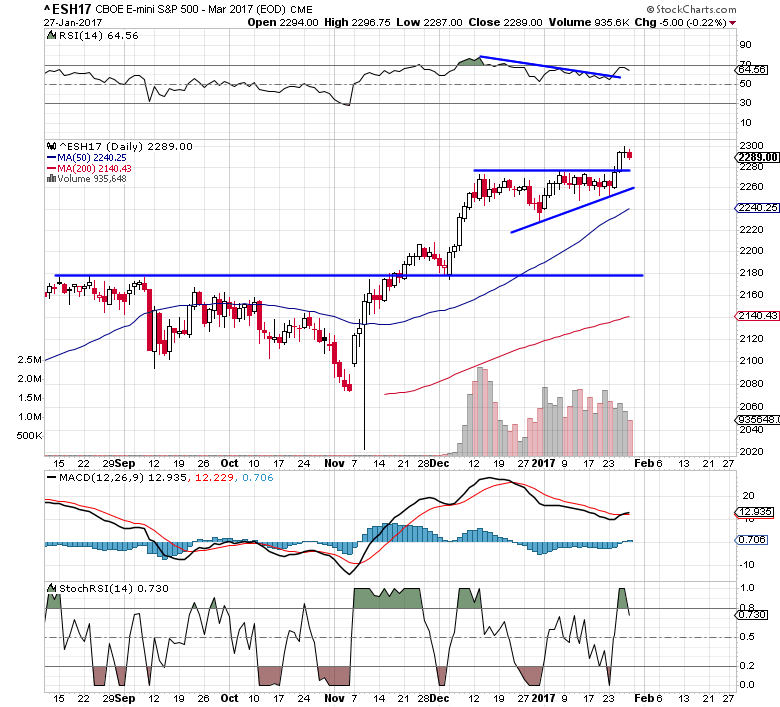
S&P Futures are setting up a clear bullish pennant/flag formation that will likely prompt an explosive price move within 2~3 weeks. This bullish flag formation is likely to drive the ES price higher by roughly 100+ pts. Currently, strong resistance is just above 2275, so we’ll have to wait for this level to be breached before we see any potential for a bigger price move.
SP500 Weekly Chart
SP500 Daily Chart
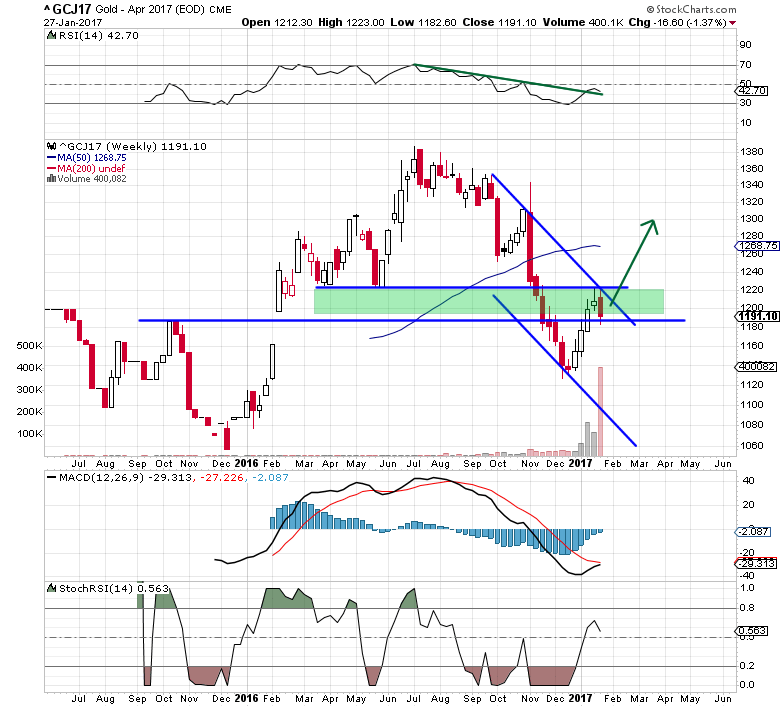
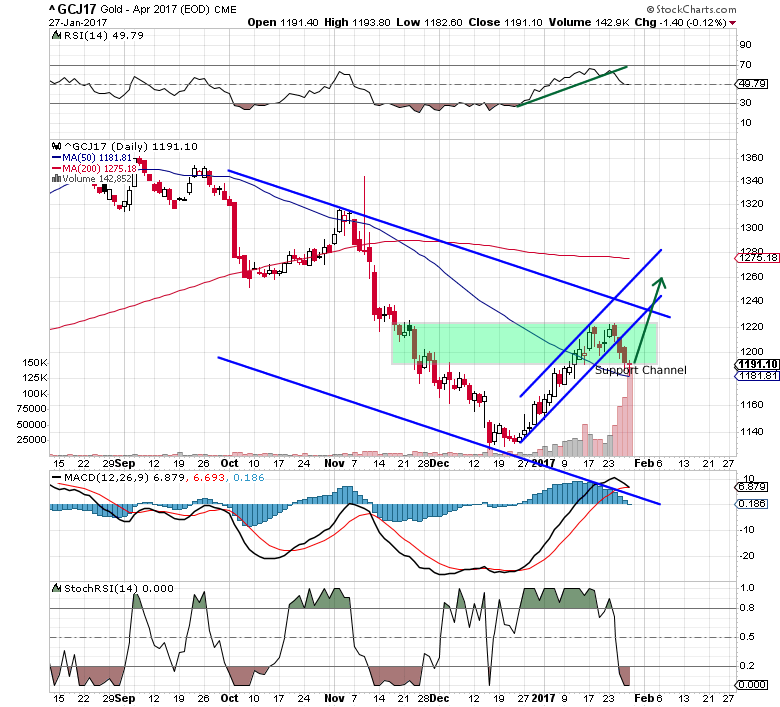
GOLD is channeling in a very clear and narrow upward price channel and trading in the middle of a support zone. The recent reversal, near the end of 2016, was interesting because GOLD trailed lower after the US election, but then reversed course just before the new year. The interesting fact about this move is that this new upward swing in GOLD correlates with the beginning of the Bullish Flag in the S&P Futures as well as a decrease in volatility. We believe as this Bullish Flag will prompt a jump in volatility and price action that will result in is a strong push higher in GOLD.
GOLD Weekly Chart
Gold Daily Chart
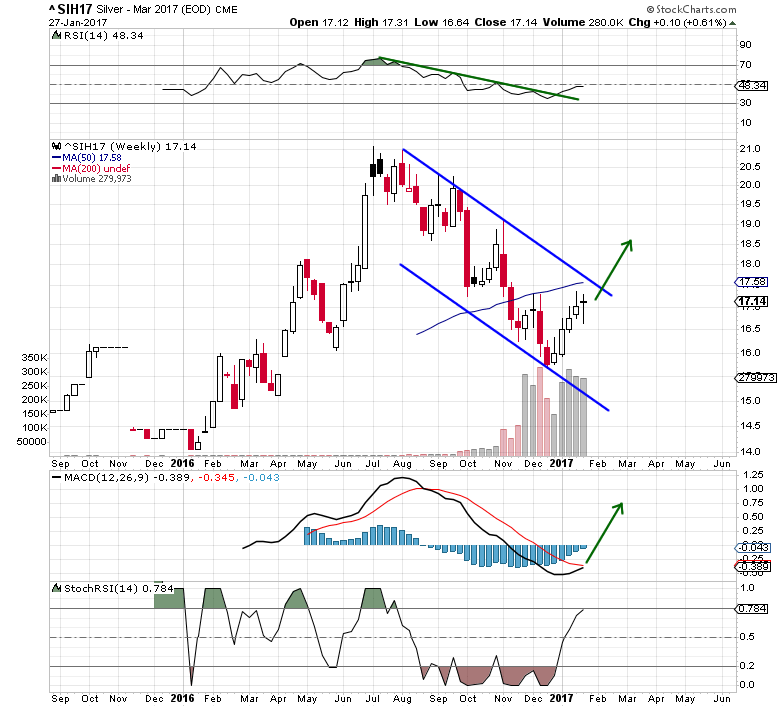
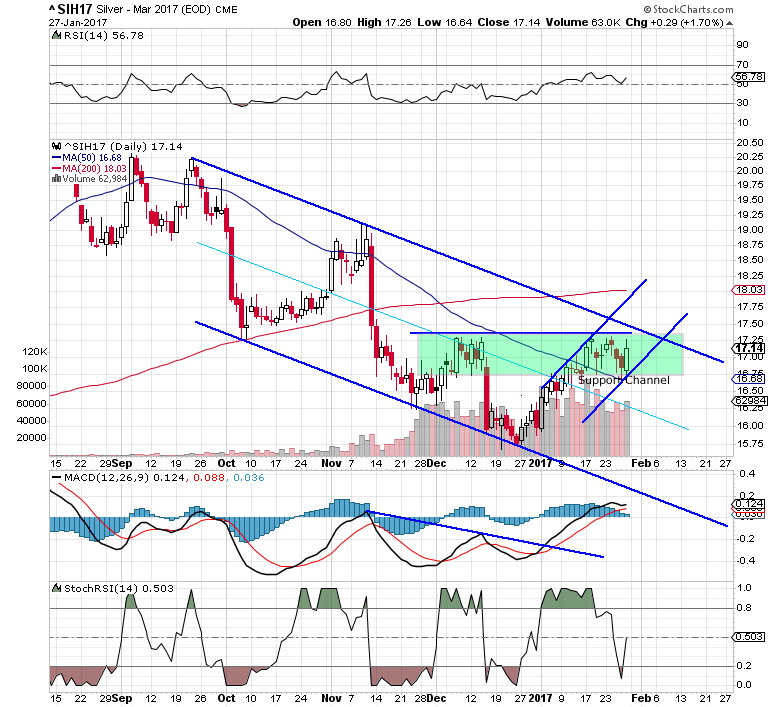
SILVER is setting up in a similar manner as GOLD. Although the SILVER chart provides a clearer picture of the downward price channel that is about to be breached – and likely drive both SILVER and GOLD into a new bullish rally. The support Zone in SILVER, between $16.60 ~ $17.40 is still very much in play. SILVER will likely stay within this zone while the Bullish Flag plays out. Yet, when the breakout begins, a move above $18.00 will be very quick and upside targets are $18.50~18.75 and $19.50~$20.00 (possibly much higher in the long run).
SILVER Weekly Chart
Silver Daily Chart
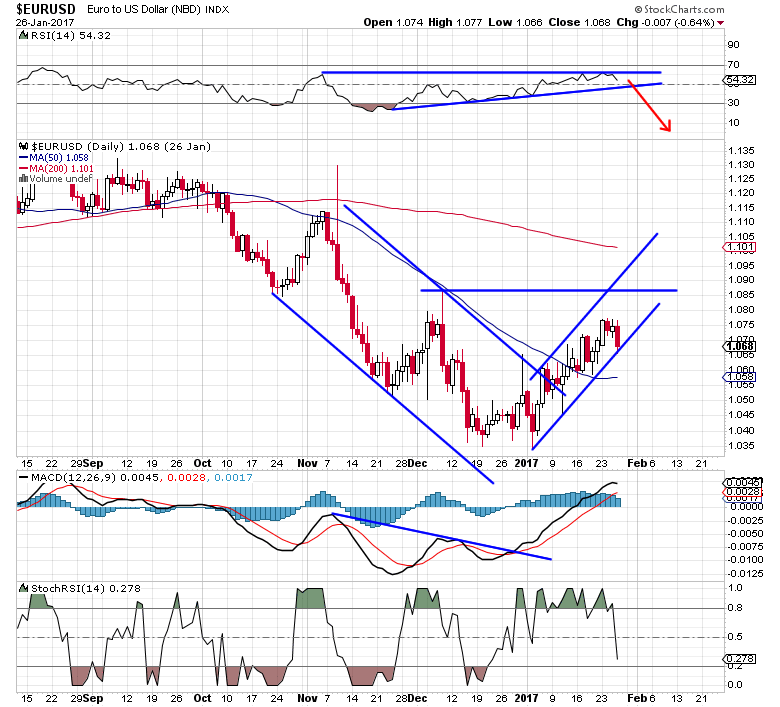
EUR/USD correlation to the US moves should be viewed as measure of strengthening US economy/USD as related to foreign market volatility and potential. As the USD strengthens, this puts pressure on foreign governments and global transactions based in USD. This also puts pressure on the METALS markets because billions of people around the globe consume precious metals as a “safe-haven” related to currency volatility. We expect the EUR/USD levels to fall near “parity” (1.00) again and possibly dip below parity based on future foreign election results. This volatility and uncertainty will translate to increased opportunity for GOLD and SILVER to run much higher over the next few months.
EURUSD Daily Chart
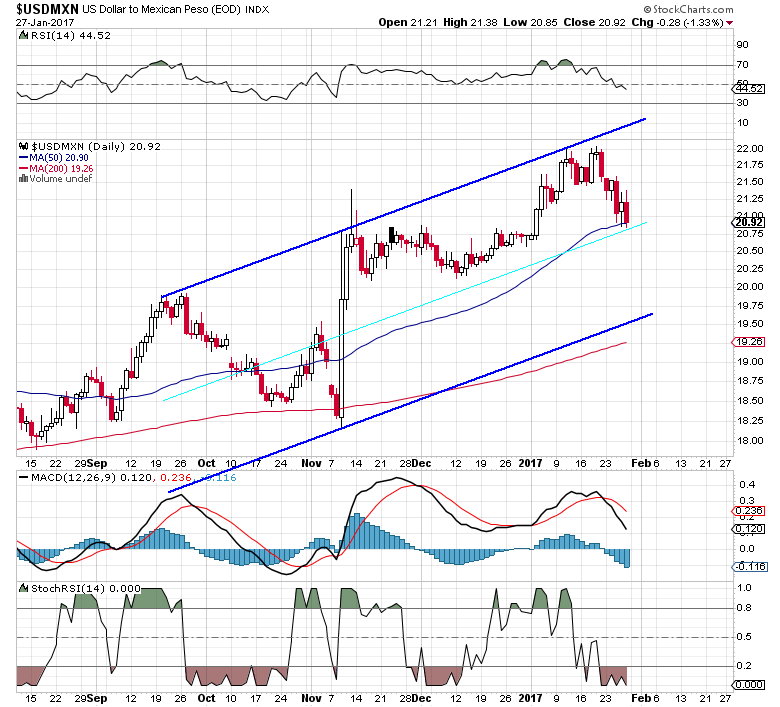
USDMXN Daily Chart
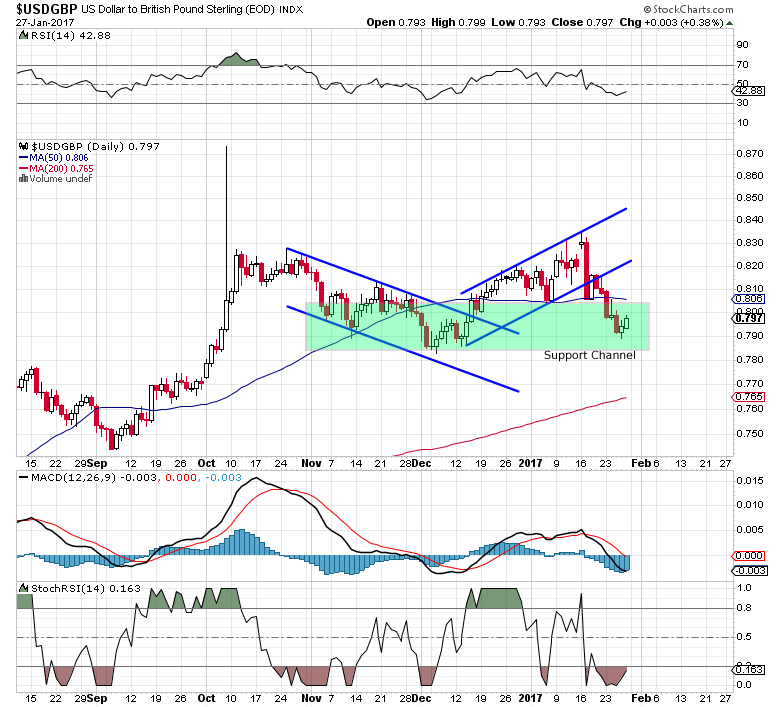
USDGBP Daily Chart
Right now is a fantastic opportunity to take advantage of these lower prices. We may see rotation near to the lower support zone levels as price rotates over the next few weeks. The key to any trade in the metals market is to understand the potential moves and watch for confluence and volatility in other markets. We believe the next few weeks/months will be very telling. If we are correct, we’ll see new highs in the US markets fairly quickly and we’ll see a new potential bullish breakout in GOLD and SILVER.
Inflation in the Eurozone accelerated to 1.8% yoy, up from 1.1% in December, putting it within range of the European Central Bank’s medium-term target of below but close to 2%. It was the highest rate since February 2013.
Core inflation, which excludes volatile prices of energy and unprocessed food and which the ECB focuses on in its policy decisions, was stable at 0.9% yoy, however.
ECB President Mario Draghi said last Thursday he would look past energy price fluctuations until underlying inflation picked up in a “convincing” way.
Energy prices jumped 8.1% year-on-year in January after a 2.6% increase in December and unprocessed food was 3.3% more expensive than a year earlier.
Separately, the statistics agency said Eurozone GDP rose 0.5% qoq in the last three months of 2016, as expected, for a 1.8% yoy rise. In the whole of 2016, euro zone GDP rose 1.7%, down from a five-year high of 2.0% in 2015.
Stronger economic growth also helped bring down the bloc’s unemployment rate to 9.6% in December, the lowest since May 2009 before Greece’s debt crisis broke out.
Technical analysis
The rejection of a bearish move yesterday is an important signal for the coming days. The EUR/USD remains above the 14-day exponential moving average, which highlights that the overall structure is bullish now.
Trading strategy
Today’s Eurozone inflation reading is a strong support for our long position. The market will be focused now on Fed statement. We do not expect a strong hint for the timing of the next rate Fed hike, which should also fuel the EUR/USD rise. Recent macroeconomic data from the Eurozone are pretty in line with our long-term scenario, which encourages us to open a long-term EUR/USD position with the target at 1.1090.
USD/JPY: BOJ raised its growth forecasts, as expected
Macroeconomic overview
As widely expected, the BOJ maintained a pledge to guide short-term interest rates at minus 0.1% and the 10-year government bond yield to around zero.
In a quarterly review of its forecasts, the BOJ raised its growth estimates for the fiscal year beginning in April to 1.5% from 1.3% forecast in November, nodding to brightening prospects for exports.
It also hiked its forecast for fiscal 2018 to 1.1% from 0.9%.
But the central bank left unchanged its already optimistic inflation forecasts for the coming years even as external factors push up prices, such as a rebound in oil prices and rising import bills from a weak yen. The BOJ said it expects inflation to hit its 2% target by around March 2019.
“The momentum for achieving our 2% inflation target is maintained, but lacks strength,” the BOJ said in the quarterly forecast report, warning that global uncertainties could make companies cautious of hiking prices and wages.
Japan’s core consumer prices marked the 10th straight month of annual declines in December despite more than three years of aggressive money printing by the BOJ, underscoring the country’s sticky deflationary mindset.
Japan’s growth remained anaemic in the first half of last year as consumption slumped. But a pick-up in global demand has helped exports recover, giving rise to market bets the BOJ’s next move may be to hike – not cut – rates. The recovery prospects and sharp rise in global yields on hopes of Trump’s reflationist policies have encouraged talk among some investors of a rate hike by the BOJ as early as this year. Speculation that the BOJ could taper its asset purchases earlier than expected heightened also after the BOJ skipped a much anticipated auction to buy short-term debt last week.
Japan’s industrial output rose 0.5% in December from the previous month, preliminary government data showed on Tuesday. The result compared with a median market forecast of a 0.3% increase.
Manufacturers surveyed by the Ministry of Economy, Trade and Industry expect output to rise 3.0% in January and increase 0.8% in February.
Separate data on Tuesday showed household spending fell 0.3% in December year on year, marking the 10th straight month of declines but beating the 0.6% decrease projected by the market. Household spending dropped 1.5% in November.
Japan’s jobless rate was steady at 3.1% in December and the jobs-applicants ratio rose to 1.43 from 1.41 the previous month.
Technical analysis
The USD/JPY has been fluctuating between 112.43 (50% fibo of 2015-2016 fall) and 115.60 (61.8% fibo). However, the momentum remains slightly bearish as 14-day exponential moving average remains negatively aligned. The failure on Friday ahead of the kijun line at 115.56 increased odds for another test of January low at 112.54. Breaking below that level will open the way to 111.96 (38.2% fibo of November-December rise).
Trading strategy
We stay short for 112.00 in the short term. Our bearish view is supported by fundamental factors (raised BOJ forecasts) and technical analysis. Long-term outlook is also bearish.
GBP USD, Time Frame H4. Indicator signals: Tenkan-Sen and Kijun-Sen intersected and formed “Dead Cross” (1), but the lines are still influenced by D “Golden Cross” (3). Ichimoku Cloud is very narrow, but still going up (2); Chinkou Lagging Span is on the chart. Short-term forecast: we can expect support from D Senkou Span B and resistance from Senkou Span A.
GBP USD, Time Frame H1. Indicator signals: Tenkan-Sen and Kijun-Sen are influenced by “Dead Cross” (1). Ichimoku Cloud is heading down (2), Chinkou Lagging Span is below the chart, and the price is below the lines. Short-term forecast: we can expect resistance from Tenkan-Sen, and decline of the price.
XAU USD, “Gold vs US Dollar”
XAU USD, Time Frame H4. Indicator signals: Tenkan-Sen and Kijun-Sen are very close to each other, but still influenced by “Dead Cross” (1) and D “Golden Cross” (3). Ichimoku Cloud is very narrow, but continues moving downwards (2), Chinkou Lagging Span is below the chart, and the price is near Kumo’s downside border. Short‑term forecast: we can expect support from Tenkan-Sen and resistance from Kijun-Sen – D Tenkan-Sen.
Attention! Forecasts presented in this section only reflect the author’s private opinion and should not be considered as guidance for trading. RoboForex LP bears no responsibility for trading results based on trading recommendations described in these analytical reviews.
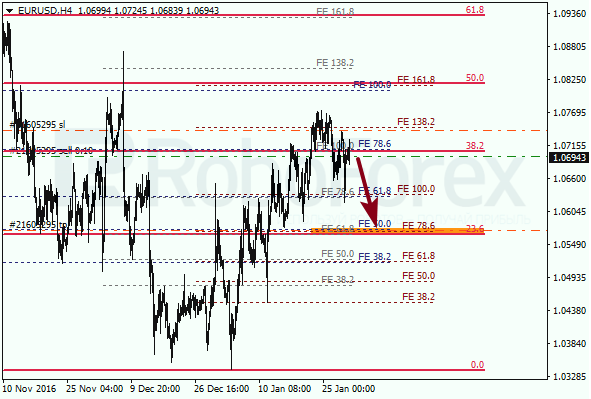
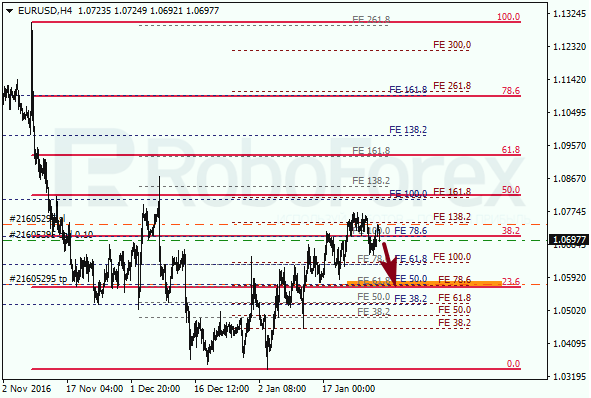
The EUR/USD pair is testing the correctional retracement of 38.2% again. If the price fixes below this level, it may resume moving downwards. in this case, the closest target will be the group of fibo-levels at 1.0580 – 1.0570.
At the H1 chart, the retracement of 61.8% provided resistance to the local correction. As a result, in the nearest future the market may resume its decline and break the local low. The downside target area is confirmed by intraday fibo-levels.
EUR GBP, “Euro vs Great Britain Pound”
The EUR/GBP pair is trying to rebound from the correctional retracement of 50%. If bears succeed, the price will continue moving downwards to reach the target area at 0.8430 – 0.8420.
As we can see at the H1 chart, the pair rebounded from the group of fibo-levels at the correctional retracement of 61.8%. Consequently, in the nearest future the market may resume falling ad break the local low.
Attention! Forecasts presented in this section only reflect the author’s private opinion and should not be considered as guidance for trading. RoboForex LP bears no responsibility for trading results based on trading recommendations described in these analytical reviews.
Do President Trump’s first moves in office signal a weaker dollar and higher gold prices?
The U.S. dollar fell more than 1% against the Japanese yen today, amid fears that President Donald Trump’s executive action on immigration could harm trade.
Reuters reported that “the dollar fell by as much as 1.4 percent against the safe-haven yen to a session low of 113.46 yen, as the immigration curbs put the spotlight back on Trump’s protectionist bent and the risks it poses for the economy.”
Joseph Trevisani, chief market strategist at Worldwide Markets in Woodcliff Lake, New Jersey, was quoted by Reuters as saying, “The dollar is being sold a bit because of the reaction to Trump’s executive order on immigration, just thinking it could create all sorts of problems with trade partners.”
Reuters also noted that “Trump’s protectionist statements and a lack of detail on policy have led some investors to opt for gold, which is often seen as an alternative investment in times of geopolitical and financial uncertainty.
ANZ analyst Daniel Hynes told Reuters, “We’ve seen a rise in the amount of safe-haven [gold] buying in the past few weeks around the critical uncertainty in the U.S. and Europe, and the executive order signed by Trump has raised the uncertainty even higher.”
On Jan. 24, Bloomberg reported that anticipated moves by Trump has UBS Group’s wealth-management unit expecting that “the currency’s impending weakness will help to benefit prices of base and precious metals.”
“The more debt that Donald Trump promises through higher infrastructure and lower tax and tax cuts tends to lead itself to a twin deficit situation in the U.S., which clearly is negative for the currency,” Wayne Gordon, executive director for commodities and forex at UBS’ wealth-management group.
Gold is up about 0.5% today, trading just under $1,200/oz.
Want to read more Gold Report articles like this? Sign up for our free e-newsletter, and you’ll learn when new articles have been published. To see a list of recent articles and interviews with industry analysts and commentators, visit our Streetwise Interviews page.
Disclosure: 1) Patrice Fusillo compiled this article for Streetwise Reports LLC and provides services to Streetwise Reports as an independent contractor. 2) Comments and opinions expressed are those of the specific experts and not of Streetwise Reports or its officers. 3) The article does not constitute investment advice. Each reader is encouraged to consult with his or her individual financial professional and any action a reader takes as a result of information presented here is his or her own responsibility. By opening this page, each reader accepts and agrees to Streetwise Reports’ terms of use and full legal disclaimer. This article is not a solicitation for investment. Streetwise Reports does not render general or specific investment advice and the information on Streetwise Reports should not be considered a recommendation to buy or sell any security. Streetwise Reports does not endorse or recommend the business, products, services or securities of any company mentioned on Streetwise Reports.
On Monday, trading on the euro closed slightly down. Despite this fall to 1.0620, the eurobulls managed to partially recover their losses.
The single currency fell against the dollar after a statement from ECB representative Ewald Novotny. He noted that Brexit may lead to some significant problems, as well as announcing the ECB’s intention to discuss curtailing their QE program until Autumn. In the American session, the rate restored to 1.0709.
Market expectations:
Mario Draghi, head of the ECB, is to speak this afternoon, and the Eurozone is set to publish its preliminary GDP data for Q4. Draghi’s speech is expected to have a strong influence following the ECB’s statement at yesterday’s press conference. His other statements have had little effect on currency markets, however.
Today (Tuesday) a two-day meeting of the FOMC begins in the US. They are expected to maintain current interest rates. This news is important for the market, but is unlikely to significantly affect it.
After yesterday’s rebound from a minimum of 1.0620, a daily hammer formed. The apparent break in the trend line turned out to be false. Taking this into account, for Tuesday I’m forecasting a fall to around 1.0661, followed by growth up to 1.0740.
Mr. Ewald Novotny pushed the euro almost as far as the 112th degree. The rebound by 67 degrees on the daily timeframe led to the formation of a reversal hammer. Given that on Monday I was predicting a two-day weakening of the euro against the American dollar; after the hammer, and the false break of the trend line, I’m expecting the price to restore to 1.0740
This morning I envisaged three main potential scenarios:
1. Euro slide to 1.0634, followed by a rebound to 1.0710;
2. Euro growth to 1.0740, followed by a slide to 1.0690;
3. Correction to the 45th degree, followed by a surge in the rate to 1.0740.
From these choices, I’ve gone with the 3rd. Now, given these possible scenarios, it’s necessary to determine the orders to trade the EURUSD pair.
Transatlantic Mining Corp. {TSX-V: TCO} {“TMC”} is a precious metal exploration & development company that has achieved initial Gold {“Au”} & Silver {“Ag”} concentrate production. TMC controls/owns two crown-jewel assets; a fully-permitted Mine & Mill and an 80% Interest in the Monitor Copper-Gold-Silver project in the famous Coeur D’Alene Mining District in Idaho. A year ago, Transatlantic leased the Alder Mountainproject in southern Montana, which includes the US Grant Gold-Silver Mine & Mill{“US Grant”}. Led by a skilled and experienced team (see below), management’s focus is driving US Grant to positive cash flow. A maiden NI 43-101 mineral resource estimate & Preliminary Economic Assessment (PEA), plus good surface drill results, is attracting lenders and other interested parties to conduct due diligence with an aim to potentially fund robust growth initiatives. Expanding US Grant into a district play is the ultimate goal. [NOTE: NI 43-101 Technical Report filed on Sedar contains both maiden mineral resource estimate & PEA]
Highlighted Intervals Include: {full drill results} NOTE: [Yellow box is a historic drill interval]
SURDH #6: 8.9 ft. {2.8 m} true width at 0.564 ounces per ton[opt]/ {19.3 g/t} gold equivalent [Au Eq.] Includes 2.8 ft. {0.85 m} at 1.07 opt / {36.8 g/t} Au Eq.
SURDH #1: 5.9 ft. {1.8 m} true width at 0.357 opt / {12.2 g/t} Au Eq.
SURDH#5: 6.9 ft. {2.1 m} true width at 0.203 opt / {7.3 g/t} Au Eq. Includes 2.1 ft. {0.65 m} at 0.493 opt / {16.9 g/t} Au Eq.
While thickness varies, historical data on the Alder Mountain project, and greater Alder Gulch district, reference vein widths of 3 to 6 feet (0.9 to 1.8 m). Yet, in the Company’s drill program in 4q 2016, 6 assays shown above {4 pending in February}, and historical drill hole DDH USG-88-2, have an average width of6.6 ft. (2.0 m). This is encouraging and provides crucial information for upcoming drill programs and possible mining scenarios. Management is investigating the potential to mine the US Grant and parallel El Fleeda veins concurrently, which would be highly efficient and cost effective. {See new corporate presentation}
TMC following proven / highly successful Northern Star Resources model
Like Australia’s Northern Star Resources (ASX: NST) has achieved, management’s goal is to build TMC into a robust portfolio of top quality assets. From 2010-2014, Bernie Sostak and Ray Parry {see bios below} were key executives in that successful Australian-listed company. Shares traded for nickels when Bernie joined, up to ~A$1.50 when he departed to join TMC full-time. Bernie sourced targets, evaluated and integrated acquired assets. Both Ray and Bernie played important roles in structuring the transactions. They were part of a team that helped grow production from ~50,000 ounces/yr to ~600,000, during which time the market cap soared from under A$ 100 M to over A$ 1 billion (now A$ 2.4 billion). Bernie and Ray are deploying the same strategy at TMC, acquiring high-grade, high-margin projects, with relatively modest capital requirements and strong expansion potential in safe and proven mining jurisdictions.
The indicative mine plan calls for an annual run-rate of 5,000 ounces, growing to 10,000 ounces {all references to production are gold equivalent ounces}. A 10,000 ounce/yr run-rate assumes TMC’s onsite Mill is running at 150 tons per day (“tpd”). Subject to grade and mining capacity, an upgrade to 300 tpd is being contemplated. Doubling Mill throughput could deliver 20,000 – 30,000 ounces/yr. M&A, farm-ins, lease-to-own options and the like, could enable production to exceed 30,000 ounces/yr. Management is in multiple discussions to that end, with no material news to report at this time.
If the Company reaches 20,000 ounces/yr, it could be generating US$ 24 M {@ today’s spot price} in gross revenue. At a PEA derived AISC estimate of US$ 905/Au Eq. ounce, that would be an operating margin of ~US$ 300/oz, equal to US$ 6 M in operating cash flow. Compare that to TMC’s market cap of C$7.5 M = US$ 5.6 M. Meaningful upside potential from i) lower AISC due to economies of scale ii) mining higher-grade ore than shown in PEA iii) higher Au-Ag prices iv) if higher grade, then more ounces produced and v) if lower AISC, higher grade & higher Au-Ag prices, then higher operating margin.
Restoration of continuous Mill capacity of 150 tpd
Update on US Grant Mine & Mill metrics {drilling / recoveries / grades}
Increasing production to an annual run-rate of 5,000 Au Eq. ounces
Commence underground drilling from 3 Level {to test vertical extent of US Grant vein}
Update on corporate initiatives including possible M&A, leasing, JVs, farm-ins, debt and gold stream funding
Exploration Target ~500k Ounces, Plus District-Scale Growth Opportunities
Growth is a strategic imperative. Management hopes to consolidate the Alder Gulch district by executing transactions involving minimal upfront cash or shares. TMC is actively pursuing non-equity capital sources to boost production to 30,000+ ounces/yr within a few years. {See corporate presentation}
A maiden mineral resource estimate shows 7,000 Measured & Indicated ounces, plus 46,800 Inferred, 53,800 ounces in all. The NPV(10%) was US$ 5.1 M, with an AISC of US$ 905/oz. and IRR of 278%. Importantly, the PEA did not include recent drill results. In fact, the PEA only included a portion of the known US Grant vein. A key takeaway from the maiden resource report; a conceptual exploration target of 517,250 ounces. Notice the top 2 exploration blocks contain a total of 197,650 prospective {non NI 43-101 compliant} target ounces with an average grade of 0.335 opt Au Eq. This table can be found on page 3 of the NI 43-101 Technical Report.
As can be seen, targeted resources will also come from areas other then the US Grant vein. The El Fleeda vein and Golden Boy claim group (among others) have meaningful exploration potential. Historical production supports this thesis. For instance, reported smelter return averages for the period 1946 to 1952 from the Cornucopia claim were 0.34 opt Au & 14.2 opt Ag {~0.527 opt Au Eq.}
US Grant Complex, Strong Growth Potential
TMC’s leased property hosts multiple high-grade veins, the most prominent being US Grant and sub-parallel El Fleeda. The US Grant vein is known for a minimum strike length of 3,940 feet (1,200 m), of which only a portion has been developed or mined. Notably, there has been no deep drilling on the property. The Company is targeting new drill holes by using last year’s sampling on #3 Level, this year’s surface drill results and historical data including the following drill hole intervals.
NOTE: {$1,200/oz Au & $15.80/oz Ag used for gold equivalent calculations}
Hole 1125-13: 5.2 feet (1.6 m) at 22.1 g/t Au & 515 g/t Ag = 28.8 gold equivalent g/t Hole USG 88-6: 2.0 feet (0.6 m) at 3.5g/t Au & 269.1 g/t Ag = 7.2 gold equivalent g/t Hole USG 88-2: 8.5 feet (2.6) m at 10.7 g/t Au & 170g/t Ag = 13.1 gold equivalent g/t
See US Grant mine schematic. It’s important to recognize that the US Grant vein (primary target, one of several known veins) was only partially developed, with extensions planned past the current #3 Level development of ~800 m (2,625 ft.), #2 Level ~500 m (1,640 ft.), and #1 Level 160 m (525 ft.). Surface drill holes described above come from the proposed ore block (in dark grey) H 88-6.
Management believes there’s a significant number of exploitable ounces remaining on past-producing levels
If sufficiently high-grade mineralization extends below 3 Level, there would be a good chance to develop #4, #5 and #6 Levels. Subject to funding and grade, development of these levels could be relatively quick and efficient, and the Mill is less than a mile from these areas.
Key Team Members
CONCLUSION
For junior mining companies, crossing the threshold into production is incredibly hard. Dozens of things, perhaps a combination of minor mishaps, can drive a project to the brink. Ramping up US Grant towards continuous production has been slow and steady, management has not cut corners. Once the mine and Mill are performing as desired, plans to expand US Grant to a district-scale play will be hatched. Several JV, lease-to-own, farm-in and M&A transactions are under careful consideration. With a PEA and NI 43-101 mineral resource estimate in hand, multiple parties are thinking about extending TMC debt funding. Management believes US Grant is the tip of the Iceberg of a platform that will follow the path of Northern Star Resources.
Transatlantic Mining Corp. Ticker {TSX-V: TCO} advanced US Grant from due diligence to exploration to development to initial production, for less than US$ 5 M, in under 12 months. That’s a true testament to the strength of the team and project. How many gold-silver juniors with market caps below US$ 6 M are in production of high-grade gold-silver concentrate, through an onsite Mill, located in one of the best jurisdictions in the world? I see tremendous blue-sky potential here (and commensurate high risk) especially if precious metal prices continue to improve.
Disclosures: The content of this article is for information only. Readers fully understand and agree that nothing contained herein, written by Peter Epstein of Epstein Research, [ER] including but not limited to, commentary, opinions, views, assumptions, reported facts, estimates, calculations, etc. is to be considered, in any way whatsoever, implicit or explicit investment advice. Further, nothing contained herein is a recommendation or solicitation to buy or sell any security. The content contained herein is not directed at any individual or group. Mr. Epstein and [ER] are not responsible, under any circumstances whatsoever, for investment actions taken by the reader. Mr. Epstein and [ER] have never been, and are not currently, a registered or licensed financial advisor or broker/dealer, investment advisor, stockbroker, trader, money manager, compliance or legal officer, and they do not perform market making activities. Mr. Epstein and [ER] are not directly employed by any company, group, organization, party or person. Shares of Transatlantic Mining are highly speculative, not suitable for all investors. Readers understand and agree that investments in small cap stocks can result in a 100% loss of invested funds. It is assumed and agreed upon by readers that they consult with their own licensed or registered financial advisors before making investment decisions.
At the time this article was posted, Peter Epstein owned shares in Transatlantic Mining and the Company was a sponsor ofEpstein Research. Readers understand and agree that they must conduct their own research, above and beyond reading this article. While the author believes he’s diligent in screening out companies that are unattractive investment opportunities, he cannot guarantee that his efforts will (or have been) successful. Mr. Epstein & [ER] are not responsible for any perceived, or actual, errors including, but not limited to, commentary, opinions, views, assumptions, reported facts & financial calculations, or for the completeness of this article or future content. Mr. Epstein & [ER] are not expected or required to subsequently follow or cover events & news, or write about any particular company or topic. Mr. Epstein and [ER] are not experts in any company, industry sector or investment topic.
Technical analyst Jack Chan charts the latest moves in the gold and silver markets.
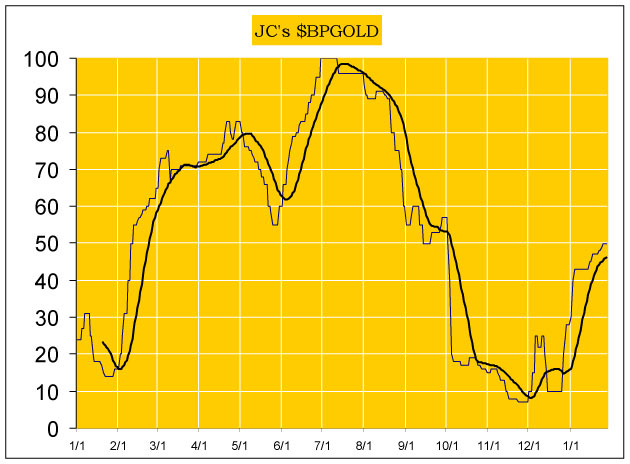
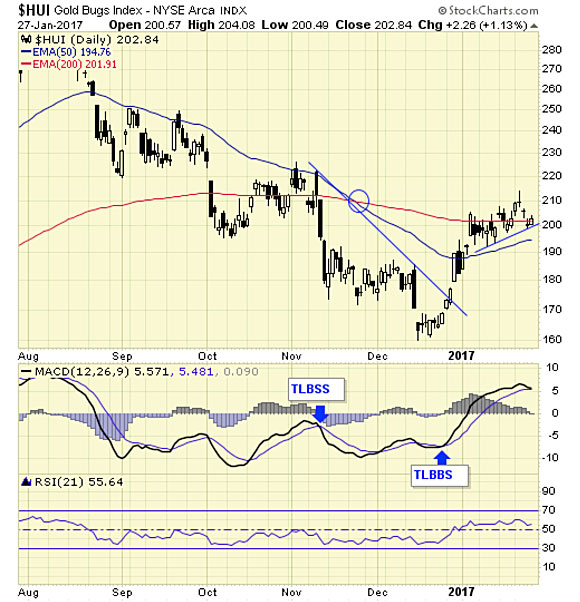
Our proprietary cycle indicator is up.
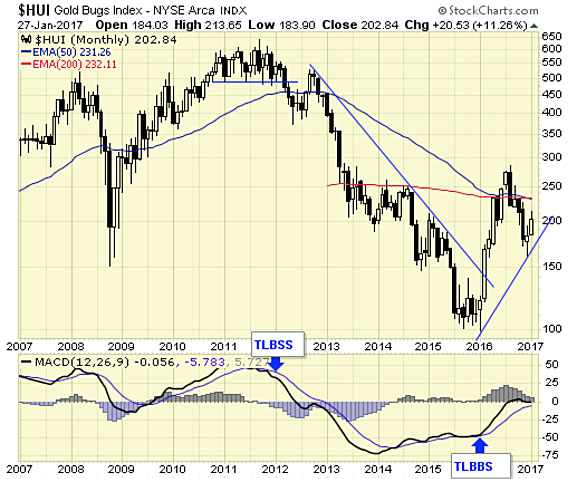
The gold sector is on a long-term buy signal. Long-term signals can last for months and years and are more suitable for investors holding for long term.
The gold sector is on a short-term buy signal. Short-term signals can last for days and weeks, and are more suitable for traders.
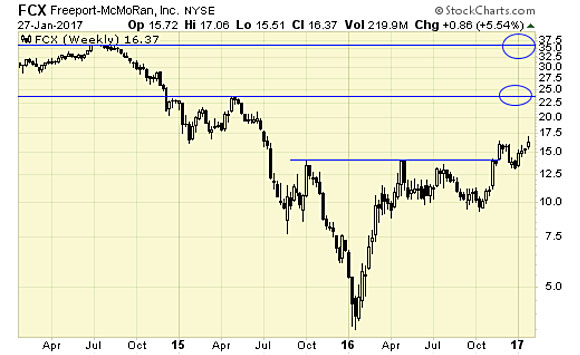
On FCX, we are long from 10.64, holding for long-term gains.
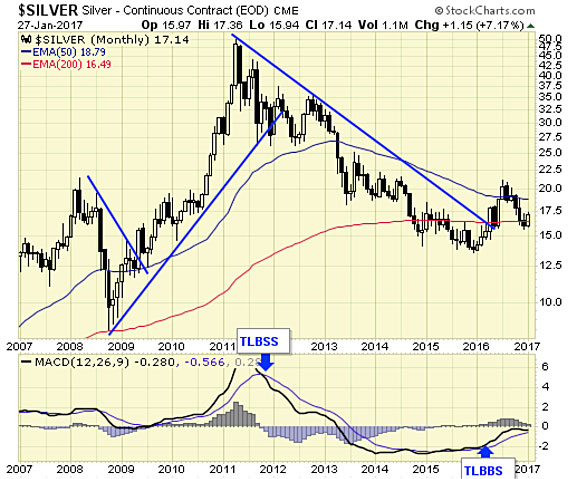
Silver is on a long-term buy signal.
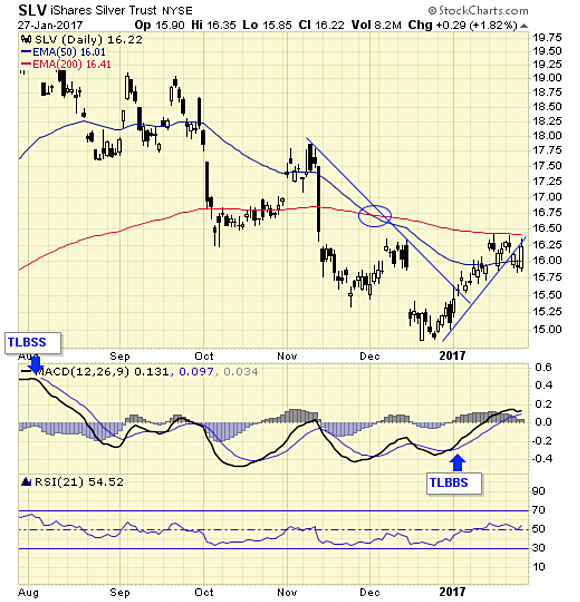
SLV is on a short-term buy signal, and short-term signals can last for days to weeks, more suitable for traders.
Summary The gold sector is on major buy signal. The cycle is up. We are holding FCX for long-term gains.
Jack Chan is the editor of simply profits at www.simplyprofits.org, established in 2006. Chan bought his first mining stock, Hoko Exploration, in 1979, and has been active in the markets for the past 37 years. Technical analysis has helped him filter out the noise and focus on the when, and leave the why to the fundamental analysts. His proprietary trading models have enabled him to identify the NASDAQ top in 2000, the new gold bull market in 2001, the stock market top in 2007, and the U.S. dollar bottom in 2011.
Want to read more Gold Report articles like this? Sign up for our free e-newsletter, and you’ll learn when new articles have been published. To see a list of recent articles and interviews with industry analysts and commentators, visit our Streetwise Interviews page.
Disclosure: 1) Jack Chan: I, or members of my immediate household or family, own puts on the following companies mentioned in this article: Freeport-McMoRan Inc. I personally am, or members of my immediate household or family are, paid by the following companies mentioned in this article: None. My company has a financial relationship with the following companies mentioned in this article: None. I determined which companies would be included in this article based on my research and understanding of the sector. 2) Jack Chan: We do not offer predictions or forecasts for the markets. What you see here is our simple trading model, which provides us the signals and set-ups to be either long, short, or in cash at any given time. Entry points and stops are provided in real time to subscribers, therefore, this update may not reflect our current positions in the markets. Trade at your own discretion. We also provide coverage to the major indexes and oil sector. 3) This article does not constitute investment advice. Each reader is encouraged to consult with his or her individual financial professional and any action a reader takes as a result of information presented here is his or her own responsibility. By opening this page, each reader accepts and agrees to Streetwise Reports’ terms of use and full legal disclaimer. This article is not a solicitation for investment. Streetwise Reports does not render general or specific investment advice and the information on Streetwise Reports should not be considered a recommendation to buy or sell any security. Streetwise Reports does not endorse or recommend the business, products, services or securities of any company mentioned on Streetwise Reports.
The EUR/USD pair failed to fix above the correctional retracement of 38.2%, which means that it may resume moving downwards. The closest target for bears is the group of fibo-levels at 1.0580 – 1.0570. If the price rebounds from this area, the market may start a local ascending correction.
At the H1 chart, the pair failed to stay above the local retracement of 61.8% and resumed its decline. During the day, the price may probably fall towards the area at 1.0580 – 1.0570, which is confirmed by intraday fibo-levels.
EUR GBP, “Euro vs Great Britain Pound”
The EUR/GBP pair is being corrected above the retracement of 61.8%. If the price fixes below this level, it will continue moving downwards. The closest target is the area at 0.8430 – 0.8420.
As we can see at the H1 chart, the local correctional retracement of 38.2% is a resistance level. On Monday, the price may test this level. In case it rebounds, the market may resume falling towards the closest downside targets.
Attention! Forecasts presented in this section only reflect the author’s private opinion and should not be considered as guidance for trading. RoboForex LP bears no responsibility for trading results based on trading recommendations described in these analytical reviews.
Speculators turned bullish on the CAD last week for the first time since September, data from the Commodity Futures Trading Commission and Reuters calculations showed. Canadian dollar positions swung to net long 2,519 contracts as of January 24 from net short 5,456 contracts a week earlier. The loonie rose 1.3% last week as investor fears of a more unfavorable trade outlook for Canada abated and after U.S. President Donald Trump signed orders on Tuesday smoothing the path for the Keystone XL oil pipeline.
The USD/CAD recovered slightly at the end of the week. The CAD weakened as oil fell and investors braced for a speech by Bank of Canada Governor Stephen Poloz scheduled for Tuesday. The market expects him to retain his dovish commentary and try to talk the currency down. No dovish hint from Poloz is likely to support the loonie.
The market is also looking forward to Tuesday’s Canadian GDP data. In the second half of this week the most important event for the USD/CAD will be the Fed statement.
Technical analysis
The USD/CAD recovered to the resistance at 1.3163 (38.2% fibo of May-December rise). The pair is also still below the 7-day exponential moving average, which suggests that recent upward move is not a reason to change the trading strategy. Fundamentals will play key role this week (Poloz speech, Fed statement). If the USD/CAD gets no additional fuel from surprisingly dovish Poloz (Tuesday) or hawkish Fed (Wednesday), it may fall to at least 1.3000 at the end of this week.
Trading strategy
The target of our short-term target remains at 1.3030. Our profit on this position is locked in at 1.3180, slightly above the key resistance levels. Our long-term view is bearish.
EUR/GBP: Fed and BOE will set the direction
Macroeconomic overview
The Bank of England will simultaneously publish the February Inflation Report, the MPC policy decision and the MPC minutes on Thursday. We expect the Committee to vote unanimously to keep the stance of monetary policy unchanged.
The BoE is widely expected to revise up its short-term growth and inflation forecasts following reassuring recent UK data, but the uncertainty surrounding soon-to-start Brexit negotiations is expected to keep it cautious.
Governor Mark Carney, in a speech on January 16, cautioned that developments since the Brexit vote may require a more hawkish monetary policy. He said, “Recently, there have been signs of continued solid consumer momentum domestically and a stronger growth outlook globally. The MPC will monitor developments in the light of its inflation tolerance, and will explain its assessment and policy stance accordingly.”
We do not think the BoE inflation report will be a big shock. It may sound a bit more hawkish but we do not expect a clear hint at the possibility of tighter policy.
Technical analysis
The EUR/GBP has not broken the support at 0.8450, but is still below 7-day exponential moving average, which gives no clear short-term outlook from the technical analysis point of view. A close above 0.8550 would be a stronger signal that recent GBP rally is over.
Trading strategy
We expect the BOE to remain cautious on Thursday despite upwardly revised inflation and growth forecasts. That is why any increases in the GBP may be limited. On the other hand, the Fed is unlikely to signal timing of its next hike on Wednesday, which may strengthen the EUR across the board. We have placed EUR/GBP bid at 0.8480, but this strategy may be relatively risky.