Large speculators resumed adding to bearish net positions in the 10-year treasury note futures markets last week, according to the latest Commitment of Traders (COT) data released by the Commodity Futures Trading Commission (CFTC) on Friday.
The non-commercial futures contracts of 10-year treasury note futures, traded by large speculators and hedge funds, totaled a net position of -353,651 contracts in the data reported through January 31st. This was a weekly change of -56,472 contracts from the previous week which had a total of -297,179 net contracts.
Speculators had pulled back on bearish positions the previous two weeks after reaching an all-time bearish high on January 10th before last week’s increase.
10 Year Treasury Note Commercial Positions:
The commercial traders position, categorized by the CFTC as hedgers or traders engaged in buying and selling for business purposes, totaled a net position of 525,913 contracts last week. This is a weekly increase of 47,551 contracts from the total net of 478,362 contracts reported the previous week.
IEF 7-10 Year Bond ETF:
Over the same weekly reporting time-frame, from Tuesday to Tuesday, the 7-10 Year Treasury Bond ETF (IEF) closed at approximately $105.05 which was a slight gain of $0.08 from the previous close of $104.97, according to ETF market data.
*COT Report: The COT data, released weekly to the public each Friday, is updated through the previous Tuesday (data is 3 days old) and shows a quick view of how large speculators or non-commercials (for-profit traders) as well as the commercial traders (hedgers & traders for business purposes) were positioned in the futures markets. The CFTC categorizes trader positions according to commercial hedgers (traders who use futures contracts for hedging as part of the business), non-commercials (large traders who speculate to realize trading profits) and nonreportable traders (usually small traders/speculators). Find CFTC criteria here: (http://www.cftc.gov/MarketReports/CommitmentsofTraders/ExplanatoryNotes/index.htm).
Large speculators and traders continued to lighten up on their bullish net positions in the S&P500 stock futures markets last week for a seventh consecutive week, according to the latest Commitment of Traders (COT) data released by the Commodity Futures Trading Commission (CFTC) on Friday.
The non-commercial futures contracts of S&P500 futures, traded by large speculators and hedge funds, totaled a net position of 1,000 contracts in the data reported through January 31st. This was a weekly decrease of -696 contracts from the previous week which had a total of 1,696 net contracts.
Speculators have been slowing decreasing their bullish positions each week since the middle of December and now have their lowest bullish net position since September 20th.
Small traders (or non-reportables), meanwhile, have picked up the buying slack with specs and commercials (see below) both net selling. Small traders have been overall long for the past seven weeks with a total long position of 10,885 net contracts and a weekly rise of 4,660 contracts last week.
S&P500 Commercial Positions:
The commercial traders position, categorized by the CFTC as hedgers or traders engaged in buying and selling for business purposes, totaled a net position of -11,885 contracts last week. This is a weekly change of -3,964 contracts from the total net of -7,921 contracts reported the previous week.
S&P500 Stock Market Index:
Over the same weekly reporting time-frame, from Tuesday to Tuesday, the S&P500 index closed at approximately 2,278.87 which was a slide of -1.20 from the previous close of 2,280.07, according to market data.
*COT Report: The COT data, released weekly to the public each Friday, is updated through the previous Tuesday (data is 3 days old) and shows a quick view of how large speculators or non-commercials (for-profit traders) as well as the commercial traders (hedgers & traders for business purposes) were positioned in the futures markets. The CFTC categorizes trader positions according to commercial hedgers (traders who use futures contracts for hedging as part of the business), non-commercials (large traders who speculate to realize trading profits) and nonreportable traders (usually small traders/speculators). Find CFTC criteria here: (http://www.cftc.gov/MarketReports/CommitmentsofTraders/ExplanatoryNotes/index.htm).
Large speculators boosted their net positions in the silver futures markets last week for a fifth week, according to the latest Commitment of Traders (COT) data released by the Commodity Futures Trading Commission (CFTC) on Friday.
The non-commercial futures contracts of Comex silver futures, traded by large speculators and hedge funds, totaled a net position of 75,974 contracts in the data reported through January 31st. This was a weekly rise of 4,953 contracts from the previous week which had a total of 71,021 net contracts.
The rise over the past five weeks has put silver speculative positions at the highest level since September 27th when net positions totaled 84,862 contracts.
Silver Commercial Positions:
The commercial traders position, categorized by the CFTC as hedgers or traders engaged in buying and selling for business purposes, totaled a net position of -89,413 contracts last week. This is a weekly change of -6,329 contracts from the total net of -83,084 contracts reported the previous week.
Silver ETF:
Over the same weekly reporting time-frame, from Tuesday to Tuesday, the SLV ishares ETF, which tracks the price of silver, closed at approximately $16.63 which was a rise of $0.41 from the previous close of $16.22, according to ETF financial market data.
*COT Report: The weekly commitment of traders report summarizes the total trader positions for open contracts in the futures trading markets. The CFTC categorizes trader positions according to commercial hedgers (traders who use futures contracts for hedging as part of the business), non-commercials (large traders who speculate to realize trading profits) and nonreportable traders (usually small traders/speculators). Find CFTC criteria here: (http://www.cftc.gov/MarketReports/CommitmentsofTraders/ExplanatoryNotes/index.htm).
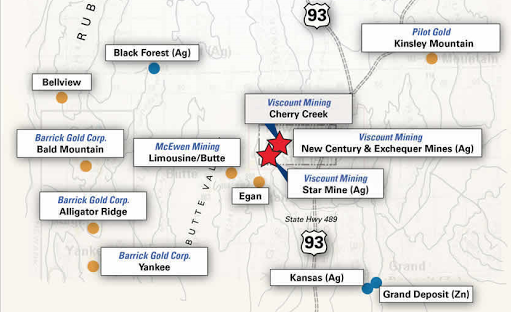
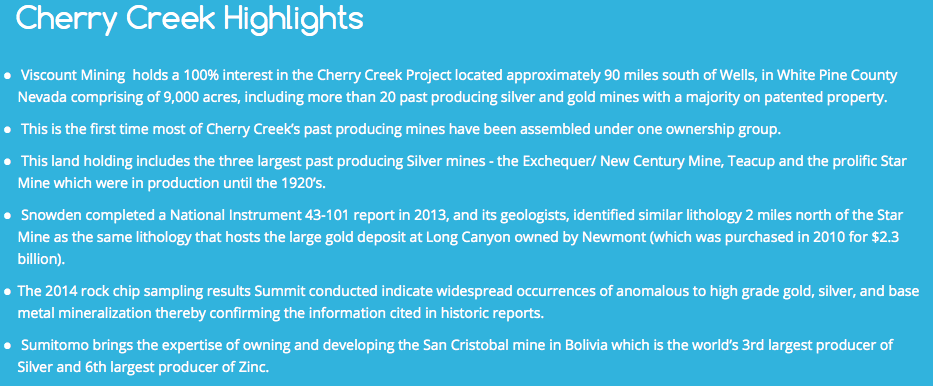
Viscount Mining Corp. [pronounced “V-eye-Count“] (TSX-V: VML) (OTCQB: VLMGF) is a project generator with 2 Silver (“Ag”) / Gold (“Au”) projects in the western U.S., Cherry Creek in Nevada & Silver Cliff in Colorado. The Cherry Creek project covers more than 9,000 acres (3,642 hectares), and was host to > 20 past-producing Ag & Au mines. Management has entered into an exploration earn-in agreement with Summit Mining Exploration Inc., a wholly-owned U.S. subsidiary of Sumitomo Corp., one of the largest trading & investment companies in Japan. It can earn a 75% interest by producing a Bank Feasibility Study (“BFS”) and, in addition, spending a minimum of US$ 10 M on exploration & development.
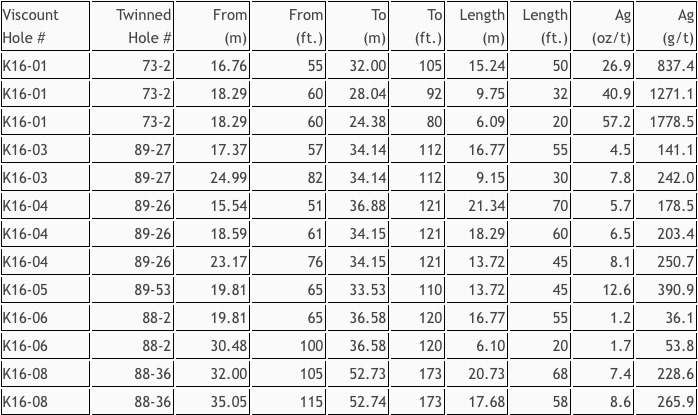
Silver Cliff is comprised of 96 lode claims covering much of the prolific, past-producing mineral districts of Silver Cliff & Rosita Hills in Colorado. Management announced a blockbuster assay on December 21, 2016, confirming extremely high-grade ore. Seven more assays are pending. Drill hole K16-01 included 50 ft. (15.24 m) of mineralized core from 55 to 105 ft. (16.8 to 32.0 m) that averaged 837.4 g/t Ag (26.9 troy ounces per ton (“opt”). It twinned a similar hole at the Company’s Kate Silver Resource deposit. Importantly, a Pre-Feasibility Study (“PFS”) was completed in the mid 1980’s. [Historical data only, not NI 43-101 compliant]
Near-term catalysts are drill results on both projects, possible M&A activity and identification of a farm-out partner on Silver Cliff.
The assay for confirmation hole K16-01 at Sliver Cliff included 50 ft. (15.24 m) of mineralized core, from 55 to 105 ft. (16.8 to 32.0 m) that averaged 837.4 g/t Ag (26.9 opt). A subset of that interval, 20 ft. (6.1 m), from 60 to 80 ft. (18.3 to 24.4 m), averaged 1,778.5 g/t Ag, (57.2 opt). That’s a gold equivalent grade of ~0.80 opt Au. The collar of K16-01 is estimated to be within 4 ft. (1.2 m) of historical drill hole DDH 73-2, that assayed at 1,927.7 g/t Ag (62.0 opt) over 44.3 ft. (13.5 m). Silver Cliff is quite impressive, in addition to grade and intercept width, the deposit is near surface, potentially amenable to open-pit mining. The magnitude of historical data, while not NI 43-101 compliant, is considerable.
“Drilling in the 1980s by Tenneco Minerals resulted in a historical pre-feasibility study which formed the company’s decision to put the property into production. Known historical silver grades range from below detection to a high of 2,125 g/t Ag (68 opt) over 13.4 meters. Plans were halted due to a restructuring of Tenneco after it was sold.”
On January 19th, Viscount followed blockbuster hole K1601 with 5 additional drill holes, including K16-05 that assayed 45 ft. (13.7 m) of mineralized core, from 65 to 110 ft. (19.8 to 33.5 m) averaging 390.9 g/t Ag (12.6 opt). Another hole, K16-08, returned 68 ft. (20.7 m), from 105 to 173 ft. (32.0 t0 52.7 m) averaging 228.6 g/t Ag (7.4 opt). A subset of that interval, 58 ft. (17.7 m), from 115 to 173 ft. (35.1 to 52.7 m), averaged 265.9 g/t Ag, (8.6 opt).
Regarding the newly reported assays, Chairman Kaare Foy stated,
“We are very pleased with the drill program conducted in 2016 as it has demonstrated that there is significant silver mineralization that occurs at a shallow depth between 50 ft. (15.2m) to about 175 ft. (53.3m) that may be amenable to open pit mining.”
Viscount has 40 M shares outstanding vs. an average of ~115 M among like-sized silver juniors. Peer company shares are up, on average, 580% from their respective 52-week lows. By contrast, Viscount’s share price is just 28% above its 52-week low. Viscount has vastly underperformed its peer group for no good reason, possibly offering investors a compelling entry point. Near-term catalysts are drill results on both projects, possible M&A activity and identification of a farm-out partner on Silver Cliff.
There’s a tremendous amount of exploration, development & production of silver coming out of Mexico. It might be prudent for precious metal companies closely tied to Mexico diversify into the U.S. and Canada. It’s difficult to beat Nevada and Colorado in terms of safe, prolific precious mining jurisdictions.
Of course, there are plenty of natural resource companies around the globe who could have interest in partnering on Silver Cliff. Proper funding could make it a world-class project and the timing could not be better. Having curtailed or divested exploration and development projects for years, the time is ripe for producers to take a closer look at high-grade mining projects in attractive jurisdictions.
To that end, management is in discussions with multiple parties on a number of corporate initiatives including M&A and securing a partner at Silver Cliff. My guess is that precious metal companies are watching Viscount’s progress (drill results & upcoming maiden mineral resource report) very closely. This is not an unknown district, Silver Cliff underwent substantial exploration between 1967 and 1984. Major explorers included Freeport, Hecla, Homestake & Tenneco Minerals.
Jim Ebisch, Project Manager for the 2016 drill program, had this to say about Silver Cliff,
“Even given the fact that there is a historical silver resource and PEA [it was a PFS] completed for the Silver Cliff project, we believe the region containing, and immediately surrounding the KSR is materially under-explored, and the historical resource there could be greatly enhanced with just a few strategically placed drill holes.”
From the December 21st 2016 press release, Chairman Foy commented,
“The high silver values in K16-01 represent a solid starting point toward addressing our primary goal for Silver Cliff which is to confirm the historical mineral resource and then look to enlarge that resource by extending the drill program outside the perimeter of the original resource on which the PEA [it was a PFS] was done by Tenneco.”
Silver Cliff is thought to overlie a large caldera and porphyry system, which increases the prospect’s potential to host a number of precious and base metal deposits. This has been demonstrated in the mineralogy and grade historically extracted from numerous underground mining operations in the district. The Company has an exploration target of 50 million ounces of silver. However, that potential quantity is conceptual in nature as there has been insufficient exploration to define a mineral resource.
Nevada’s Cherry Creek Project: Farmed-out to Sumitomo Corp
While Cherry Creek is billed as the, “flagship” project, management owns 2 crown jewel assets. If spun off to shareholders, either would make viable, financeable standalone companies. I’m not suggesting spinoffs are on the table, just that the projects are quite compelling. Especially so, in light of Viscount’s evolving “project generator” business model, in which capital expenditures are minimized (cash burn low) due to prudent farm-outs. For example, spending on advancing Cherry Creek will be virtually zero for years to come (assuming Sumitomo sticks with the project)
Having a partner like Sumitomo, who, by the way, has no other precious metal exploration projects in North America, is as good as it gets. Cherry Creek has been de-risked by this strong vote of confidence, but ample risk remains as, in the end, it’s still an exploration project. I found it encouraging that in November the initial drill program announced in September was increased by two-thirds from 18 holes for a total of 14,336 feet (4,380 m), to 34 holes for a total of 24,000 feet (7,317 m). Initial drill results are expected in the near future. This farm-in, with a multi-billion dollar partner, is one of the best I’ve seen in the project generator space. Viscount’s carried through BFS 25% interest could be worth a fortune in a few years.
Supportive of Cherry Creek’s prospects, Mark Abrams, on Viscount’s Technical Advisory Board, stated,
“Recent soil sampling by Summit Mining at Flint Canyon has yielded gold and pathfinder element anomalies (Hg, As, Sb, Tl) similar in size and tenor to soil geochemical sampling results at other mines and advanced properties in the region, including Kinross Gold’s Bald Mountain, Newmont’s Long Canyon, Agnico-Eagle’s West Pequop and Pilot Gold’s Kinsley Mountain.”
It’s nearly impossible to overstate the significance of being free carried through a BFS. If it were to cost another US$ 20 M for all the steps leading up to and including delivery of a BFS, combined with US$ 10 M in exploration & development, that would total US$ 30 M [equal to ~C$ 40 M]. Compare that potential cumulative outlay to the Enterprise Value (“EV”) of Viscount [(~C$ 26.5 M / US$ 20 M) @ C$0.55/share]. The potential value of Cherry Creek (C$ 40 M from Sumitomo alone) more than covers Viscount’s EV. That suggests investors are effectively getting Silver Cliff for free. [Readers beware, this assumes that Sumitomo completes the 75% earn-in]
Viscount has 40.4 M shares outstanding and 59.1 M fully-diluted. All warrants & stock options are in-the-money, except 2 classes struck at C$0.70/shr. Full exercise of in-the-money warrants and options would generate C$ 3.5 M in cash proceeds.
Investors looking for a team with direct experience in the U.S., Canada, Mexico, Australia, the UK, Chile, Peru, Brazil, Japan, Ecuador, Venezuela, Boliva, the Middle East, Hondouras, Guatemala, Argentina, China, Indonesia, Uzbekistan, Brazil, Thailand, Panama, Africa and the Arctic, have come to the right place. The team’s connections across the world should serve the Company well as existing and new projects are prudently advanced along with credible farm-out partners.
Conclusion
To date, Nevada has grabbed most of the attention, but Silver Cliff in Colorado is under-appreciated, leaving it undervalued. How cheap is it? If one believes like I do that Cherry Creek is worth at least C$ 40 M, as long as Sumitomo is involved, then investors get Silver Cliff for free. Alternatively, if one ascribes zero value to Cherry Creek, (getting it for free) then the Company’s EV implies US$0.40 per ounce of Silver in the ground at Silver Cliff (based on an exploration target of 50 M ounces). US$0.40/oz. is hardly an aggressive valuation for an open-pit amenable, monster-grade, silver deposit.
Both projects have tremendous upside, as soon as this year, and beyond. Near-term catalysts are drill results on both projects, possible M&A activity and identification of a farm-out partner on Silver Cliff. Management is actively pursuing other assets to fill its project generating machine. A modest number of shares outstanding suggests the stock price could shoot higher, without impacting the investment rational for a giant like Sumitomo or a potentially well-healed (partner-to-be-named later) at Silver Cliff. Viscount is one of the best project generators (so far a silver junior) in the sector. Anyone looking to buy a basket of precious metal companies for year 1 of the Trump experiment, should seriously consider Viscount at current levels.
Disclosures:
The author, Peter Epstein, CFA, MBA owns shares in Viscount Mining, purchased in the open market. He has no prior or existing relationship with the Company.
The content of this article is for information only. Readers fully understand and agree that nothing contained herein, written by Peter Epstein of Epstein Research, [ER]including but not limited to, commentary, opinions, views, assumptions, reported facts, estimates, calculations, etc. is to be considered, in any way whatsoever, implicit or explicit investment advice. Further, nothing contained herein is a recommendation or solicitation to buy or sell any security. The content contained herein is not directed at any individual or group. Mr. Epstein and [ER] are not responsible, under any circumstances whatsoever, for investment actions taken by the reader. Mr. Epstein and [ER] have never been, and are not currently, a registered or licensed financial advisor or broker/dealer, investment advisor, stockbroker, trader, money manager, compliance or legal officer, and they do not perform market making activities. Mr. Epstein and [ER] are not directly employed by any company, group, organization, party or person. Shares of Viscount Mining are highly speculative, not suitable for all investors. Readers understand and agree that investments in small cap stocks can result in a 100% loss of invested funds. It is assumed and agreed upon by readers that they consult with their own licensed or registered financial advisors before making investment decisions.
At the time this article was posted, Peter Epstein owned shares in Viscount Mining. Readers understand and agree that they must conduct their own research, above and beyond reading this article. While the author believes he’s diligent in screening out companies that are unattractive investment opportunities, he cannot guarantee that his efforts will (or have been) successful. Mr. Epstein & [ER] are not responsible for any perceived, or actual, errors including, but not limited to, commentary, opinions, views, assumptions, reported facts & financial calculations, or for the completeness of this article or future content. Mr. Epstein & [ER] are not expected or required to subsequently follow or cover events & news, or write about any particular company or topic. Mr. Epstein and [ER] are not experts in any company, industry sector or investment topic.
Why did the stock market rally after the election victory of President Trump? Do not expect to see increased earnings growth in 2017 and 2018. This market is now overvalued by all metrics! There are no sound fundamentals that are supporting these markets going higher so tread lightly.
My number one priority is preservation of capital. My number two priority is making huge profits with swing trades using ATP’s Momentum Reversal Method. I have been making anywhere from 5% to 74% in short term swing trades. The old days of buying and holding are over now due to the new structure of all the financial markets and program trading. For the entire month of January, I have been writing that the excessive optimism was a warning sign that this parabolic run was unsustainable!
On January 24th, 2017, the SPX peaked to a new high of 2300 and closed negatively on Monday, January 30th, 2017. This created the formation of an “island reversal”.
An island reversal is a candlestick chart pattern in which there is a gap on both sides of the candle. Island reversals frequently show up after a trending move is in its’ final stages. An “island reversal” gets its’ name from the fact that the candlestick appears to be all alone as if it was an island to and off itself. A key sign of a valid island reversal is an increase of volume on both the first gap and then the subsequent gap in the opposite direction. An island reversal formation is attributed to news driven events that occurred over this past weekend and in the pre-market hours of SPX trading. (Info courtesy of TradingSim)
Exhaustion Gaps signal the end of a move. These gaps are associated with a rapid, straight-line advance or decline. A reversal day can easily help to differentiate between the measuring gap and the exhaustion gap. When it is formed at the top with heavy volume, there is significant chance that the market is exhausted and the prevailing short term trend has changed.
The Small-Cap Russell 2000 Index experienced the worst of the selling pressure of all U.S. indices on Monday, January 30th, 2017. It closed below its 50-day moving average for the first time since the presidential election. Similar losses of momentum have led to negative returns going forward.
Another Way Of Measuring The Trend
The $SPXA50R measures the percentage of stocks in the SPX that are above the 50-day moving average. When the indicator declines below 75. (chart below), that is a sign of a downtrend. I would interpret this chart as being bearish.
As one can see in the chart below, I circled the extremes and currently they are informing us of a pending correction. The higher the ratio, the more bets that traders will have on the indexes rising, however, they are always on the wrong side of the market.
Is This The Point Of No Return?
The election of Donald J. Trump was perhaps the single most galvanizing moment for both political parties in modern American history! Any single actions made by President Trump has caused protests to ignite throughout the nation, within 24 hours. On Friday, January 27th, 2017, President Trump signed an executive order that banned refugees from Syria indefinitely and placed a 120 day ban on travel to the United States for citizens of Iran, Iraq, Libya, Somalia, Sudan, Syria and Yemen. The markets responded negatively to this breaking news.
Being on the right side of all the financial markets are discussed in my early morning daily videos which updates you where you need to be in these markets to take the opportunities that are presented. Today, there are unique trading setups in which you can make HUGE profits in.
Be prepared and profit from this years uncertainty and volatility.
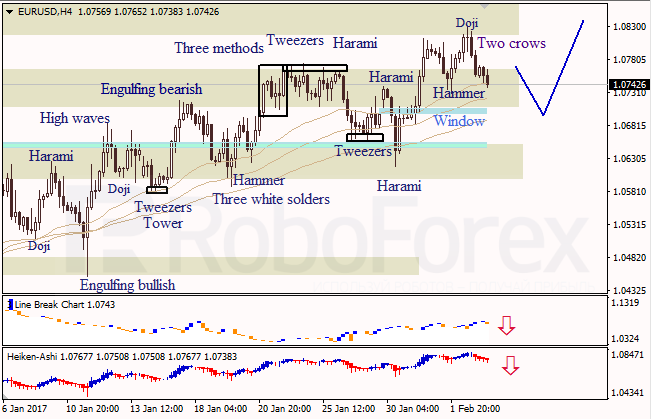
At the H4 chart of EUR USD, bearish Doji and Two Crows patterns indicated a descending correction. The upside Window is a support level. Three Line Break chart and Heiken Ashi candlesticks confirm a bearish direction.
At the H1 chart of EUR USD, bearish Shooting Star pattern indicated a descending movement. The upside Window is a support level. Three Line Break chart and Heiken Ashi candlesticks confirm a bearish direction.
USD JPY, “US Dollar vs. Japanese Yen”
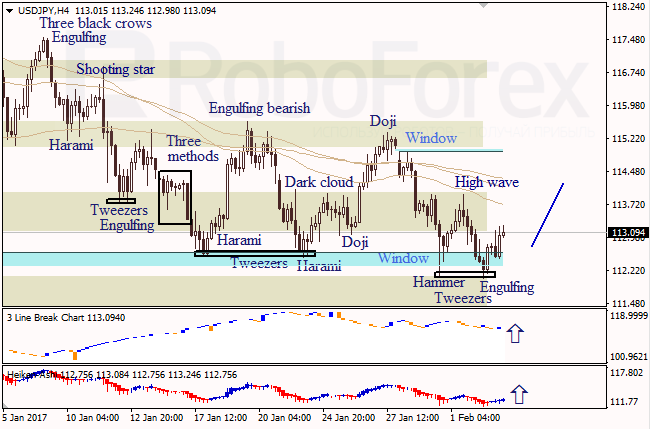
At the H4 chart of USD JPY, the downside Window provided support. Engulfing Bullish, Tweezers, and Hammer patterns indicate an ascending movement. Three Line Break chart6 and Heiken Ashi candlesticks confirm a bullish direction.
RoboForex Analytical Department Article By RoboForex.com
Attention! Forecasts presented in this section only reflect the author’s private opinion and should not be considered as guidance for trading. RoboForex LP bears no responsibility for trading results based on trading recommendations described in these analytical reviews.
The EUR/USD pair is moving downwards. The main scenario still implies that the price may reach 1.0688. At the moment, the market may start the correction with the target at 1.0786. After that, the instrument may start falling inside the downtrend.
GBP USD, “Great Britain Pound vs US Dollar”
Being under pressure, the GBP/USD pair is moving downwards as well. Possibly, today the price may reach 1.2400. Later, in our opinion, the market may form another ascending structure towards 1.2935.
USD CHF, “US Dollar vs Swiss Franc”
The USD/CHF pair is forming another ascending impulse. Possibly, today the price may reach 0.9963. Later, in our opinion, the market may be corrected towards 0.9920 and then resume growing with the target at 1.0000.
USD JPY, “US Dollar vs Japanese Yen”
The USD/JPY pair is moving upwards with the target at 113.93. After that, the instrument may be corrected towards 113.00 and then resume growing to reach 115.30.
AUD USD, “Australian Dollar vs US Dollar”
The AUD/USD pair is moving downwards. Possibly, the price may form another descending wave to reach 0.7555. Later, in our opinion, the market may grow towards 0.7630.
USD RUB, “US Dollar vs Russian Ruble”
Being under pressure, the USD/RUB pair is falling. In fact, the market is expected to continue forming the current wave with the target at 58.50.
XAU USD, “Gold vs US Dollar”
Gold has broken the ascending channel. Possibly, the price may resume the downtrend. The target is at 1201. After that, the instrument may be corrected towards 1213.
BRENT
Brent is trading to rebound from 56.60 upwards. The price is expected to start another wave to reach 58.22. Later, in our opinion, the market may be corrected towards 56.65 and then continue with the target at 59.90.
RoboForex Analytical Department Article By RoboForex.com
Attention! Forecasts presented in this section only reflect the author’s private opinion and should not be considered as guidance for trading. RoboForex LP bears no responsibility for trading results based on trading recommendations described in these analytical reviews.
Trading on the euro ended in the red on Thursday. On the back of the growing EUR/GBP cross, the eurobulls held up above the 1.0800 mark for 8 hours. The cross shot up after the Bank of England’s interest rate decision and inflation report, in which projected inflation was reduced.
After a slide to 2.4330%, US 10-year bond yields corrected to 2.4857%. This growth helped prop up the dollar at the expense of the single currency. By the end of the session, the EUR/USD rate had fallen to 1.0756.
Market expectations:
Today, traders’ focus will be on the US labour market report (nonfarm payrolls). If the ADP index is anything to go by – which in January showed a growth of 246,000 new jobs in the private sector (up from 151,000 the previous month and beating the forecast of 165,000) – then on Friday we could well see an NFP value upwards of 175,000 new jobs (last month’s figure was 151,000). If it turns out higher than 200,000, then the euro will return to around 1.0685. The NFP tends to affect the market for about an hour after publication.
On payrolls day, I don”t usually make forecasts, but I’ve decided that I will today. Based on historical patterns and cycles, I’m forecasting a fall in the euro to 1.0699. Again, this forecast is not taking the NFP release into account, which is expected at 16:30 EET.
Just as the EUR/GBP cross stopped growing and started a correctional phase, the EUR/USD rate fell to 1.0756 on the back of a rise in US bond yields. At the time of writing the euro is worth 1.0757 USD.
From a high of 1.0829, the euro fell against the dollar by 67 degrees. The rate in Asia hit a new low. The price bounced off the lower A-A channel. Before the NFP I’m predicting the rate will return to 1.0778. From there I expect the euro to fall to the 112th degree (to 1.0699). This forecast is not at all based on the payrolls themselves, however, but rather on the historical pattern that I’ve found, which fits in well with the hourly cycles. If the NFP has a strong showing, the euro could fall to around 1.0685.
If the NFP figures turn out lower than 175,000, and the unemployment rate increases, then the euro will strengthen all the way to the upper boundary of the A-A channel (1.0840).
See examples in Pfizer, Inc. (PFE) and Intel Corp. (INTC)
By Elliott Wave International
Just as there are patterns in price, there are also patterns in momentum indicators. These patterns can support your Elliott wave analysis and help you identify tradable moves in price.
In this 10-minute lesson from our popular trader-education service, Trader’s Classroom, editor Jeffrey Kennedy shows you key patterns in moving average convergence divergence (MACD).
You’ll see examples from the charts of Pfizer, Inc. (NYSE: PFE), Intel Corp. (Nasdaq: INTC), NVIDIA Corp. (Nasdaq: NVDA), and more.
Learn How You Can Find High-Confidence Trading Opportunities Using Moving Averages
Moving averages are one of the most widely-used methods of technical analysis because they are simple to use, and they work. Learn how to apply them to your trading and investing with this free 10-page eBook from Trader’s Classroom editor Jeffrey Kennedy.
This article was syndicated by Elliott Wave International and was originally published under the headline MACD: Learn to Recognize Trade Setups. EWI is the world’s largest market forecasting firm. Its staff of full-time analysts led by Chartered Market Technician Robert Prechter provides 24-hour-a-day market analysis to institutional and private investors around the world.
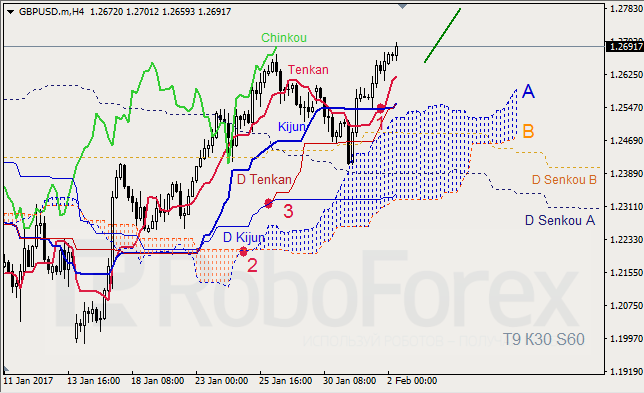
GBP USD, Time Frame H4. Indicator signals: Tenkan-Sen and Kijun-Sen intersected above Kumo Cloud and formed “Golden Cross” (1), the lines are still influenced by D “Golden Cross” (3); all lines are directed upwards. Ichimoku Cloud is going up (2); Chinkou Lagging Span is above the chart. Short-term forecast: we can expect support from Tenkan-Sen, and growth of the price.
GBP USD, Time Frame H1. Indicator signals: Tenkan-Sen and Kijun-Sen are still influenced by “Golden Cross” (1). Ichimoku Cloud is heading up (2), Chinkou Lagging Span is above the chart, and the price is on Tenkan-Sen. Short-term forecast: we can expect support from Kijun-Sen, and growth of the price.
XAU USD, “Gold vs US Dollar”
XAU USD, Time Frame H4. Indicator signals: Tenkan-Sen and Kijun-Sen are influenced by “Golden Cross” and D “Golden Cross” (1). Ichimoku Cloud is moving upwards (2), Chinkou Lagging Span is above the chart, and the price is above the lines. Short‑term forecast: we can expect growth of the price up to D Senkou Span B.
Attention! Forecasts presented in this section only reflect the author’s private opinion and should not be considered as guidance for trading. RoboForex LP bears no responsibility for trading results based on trading recommendations described in these analytical reviews.
 By CountingPips.com – Get our weekly COT Reports by Email