Author Archive for InvestMacro – Page 594

EUR/USD: upwards correction expected after a new low

By Gabriel Ojimadu, Alpari.com

Previous:

Trading on the euro closed down on Friday. Expectations of a rebound before the weekend failed to materialise. The level of 1.0637 (67 degrees) didn’t hold. The rate slid to 1.0608 (90 degrees) on the back of a rise in US bond yields.

The rise in bond yields didn’t last long, however. Having reached a session high of 2.4336%, yields then fell by 1.45% to 2.3884% in the space of 2 hours. The euro consequently ricocheted from  a low of 1.0608 to 1.0652 (up 44 points).

The preliminary figures of the Consumer Sentiment Index from the University of Michigan in the US amounted to 95.7 for February (forecasted: 98.0, previous figure: 98.5).

Market expectations:

On Monday, trading on the euro opened up. The presidential election in Germany this weekend did nothing to support the single currency. Germany has elected their former foreign minister, Frank-Walter Steinmeier, as their 12th president.

Trading closed up after Friday’s American session. On Monday, the pair is down in Asia. After an updating of the maximum, I’m expecting to see some correctional movement to around the 1.0657 mark. As the minimum moves from 1.0608 to 1.0595, the 45th degree will shift to 1.0647. This means that the growth of the euro may stall at around 1.0650. Given that the buyer ratio is currently at 30%, the market will be looking for a balancing point at the lower levels.

Day’s news:

  • 10:00 Germany: Wholesale Price Index (Jan);
  • 14:00 Germany: Bundesbank monthly report;
  • OPEC monthly oil report.

EURUSD rate on the hourly. Source: TradingView

Intraday forecast: low: 1.0595, high: 1.0657, close: 1.0635

On Friday, the 67th degree couldn’t stop the euro from falling. After a 4-hour flat, the euro rate slid to the 90th degree on the back of a rise in US bond yields. Just as yields began to fall, the euro rate bounced back.

In Asia, bond yields are trading in positive territory. They traded within a narrow range for 5 hours. Experts are expecting 10-year bonds to break through the trend line through to 2.4486. In response to this, I’m expecting the euro to fall during the European session. As soon as buyers test the strength of the line, expect a corrective movement in line with the forecast. As bonds fall below 2.4130, the euro’s growth will pick up pace. The intermediate resistance for the euro is 1.0630.

On the daily timeframe, the CCI indicator is below the -100 mark. The AO indicator and stochastic oscillator are pointing downwards. The immediate target is 1.0587.

Source: EUR/USD: upwards correction expected after a new low 


COT Report: USD bets fall for 5th week. SP500 Specs go bearish. Silver bets up for 6th week

By CountingPips.com

Here is a short summary and this week’s links (below) to the latest Commitment of Traders changes.

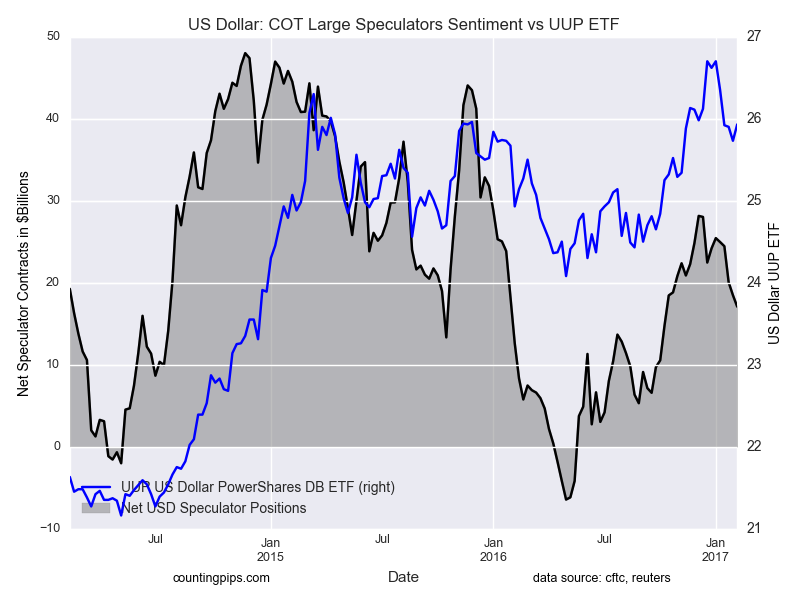
This week’s COT results showed that large speculators once again lowered their positions in the US dollar for a 5th week in a row and put bullish bets under the $20 billion threshold for a 2nd week.

WTI Crude speculators cut back on their bullish bets (from a multi-year high) while 10-year note speculators reduced their net bearish positions for the 3rd out of last 4 weeks.

In metals, gold and copper speculators trimmed bullish bets after two straight weeks of gains while silver speculators continued to raise their bets for a 6th straight week.

Finally, S&P500 speculators turned bearish last week for the first time since September.


Currency Speculators decreased US Dollar bullish positions for 5th week

US Dollar net speculator positions leveled at $17.07 billion last week

The latest data for the weekly Commitment of Traders (COT) report, released by the Commodity Futures Trading Commission (CFTC) on Friday, showed that large traders and currency speculators continued to reduce their bullish exposure in the US dollar last week.

See full article


WTI Crude Oil Speculators reduced net positions for 1st time in 4 weeks

The non-commercial contracts of WTI crude futures totaled a net position of 476,990 contracts, according to data from last week. This was a decline of -15,702 contracts from the previous weekly total.

See full article


Gold Speculators trimmed bullish net positions for 1st time in 3 weeks

The large speculator contracts of gold futures declined to a total net position of 117,149 contracts. This was a weekly fall of -2,006 contracts from the previous week.

See full article


10 Year Treasury Note Speculators cut net bearish positions for 3rd out of 4 weeks

The large speculator contracts of 10-year treasury note futures totaled a net position of -304,577 contracts. This was a weekly change of 49,074 contracts from the previous week.

See full article


S&P500 Speculators turned net bearish for 1st time since September

The large speculator contracts of S&P 500 futures totaled a net position of -1,688 contracts. This was a fall of -2,688 contracts from the reported data of the previous week.

See full article


Silver Speculators raised bullish net positions for 6th straight week

The non-commercial contracts of silver futures totaled a net position of 78,277 contracts, according to data from last week. This was a weekly gain of 2,303 contracts from the previous totals.

See full article


Copper Speculators reduced bullish net positions, remain above +50,000 level

The large speculator contracts of copper futures totaled a net position of 51,559 contracts. This was a weekly reduction of -5,717 contracts from the data of the previous week.

See full article


Article by CountingPips.com

The Commitment of Traders report data is published in raw form every Friday by the Commodity Futures Trading Commission (CFTC) and shows the futures positions of market participants as of the previous Tuesday (data is reported 3 days behind).

To learn more about this data please visit the CFTC website at http://www.cftc.gov/MarketReports/CommitmentsofTraders/index.htm


Currency Speculators decreased US Dollar bullish positions for 5th week

By CountingPips.comGet our weekly COT Reports by Email

US Dollar net speculator positions leveled at $17.07 billion last week

The latest data for the weekly Commitment of Traders (COT) report, released by the Commodity Futures Trading Commission (CFTC) on Friday, showed that large traders and currency speculators continued to reduce their bullish exposure in the US dollar last week.

Non-commercial large futures traders, including hedge funds and large speculators, had an overall US dollar long position totaling $17.07 billion as of Tuesday February 7th, according to the latest data from the CFTC and dollar amount calculations by Reuters. This was a weekly retreat of $-1.4 billion from the $18.47 billion total long position that was registered the previous week, according to the Reuters calculation (totals of the US dollar contracts against the combined contracts of the euro, British pound, Japanese yen, Australian dollar, Canadian dollar and the Swiss franc).

The US dollar speculative positions have now trimmed bullish positions for five consecutive weeks and have brought net bullish levels under the $20 billion threshold for the second week in a row. Speculative positions had previously been above this level for thirteen straight weeks dating back to November 1st.

Weekly Speculator Contract Changes:

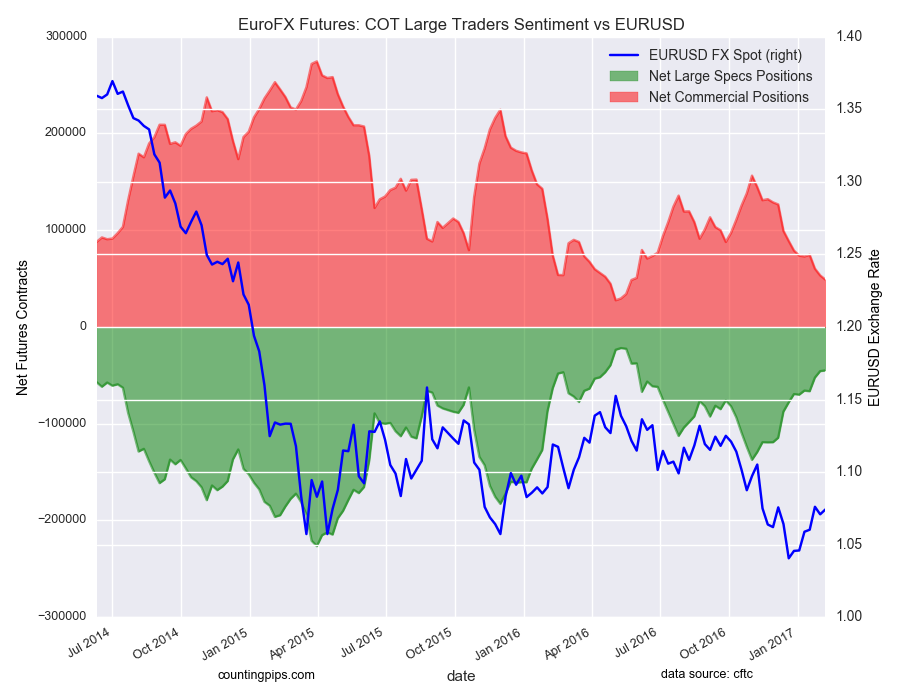
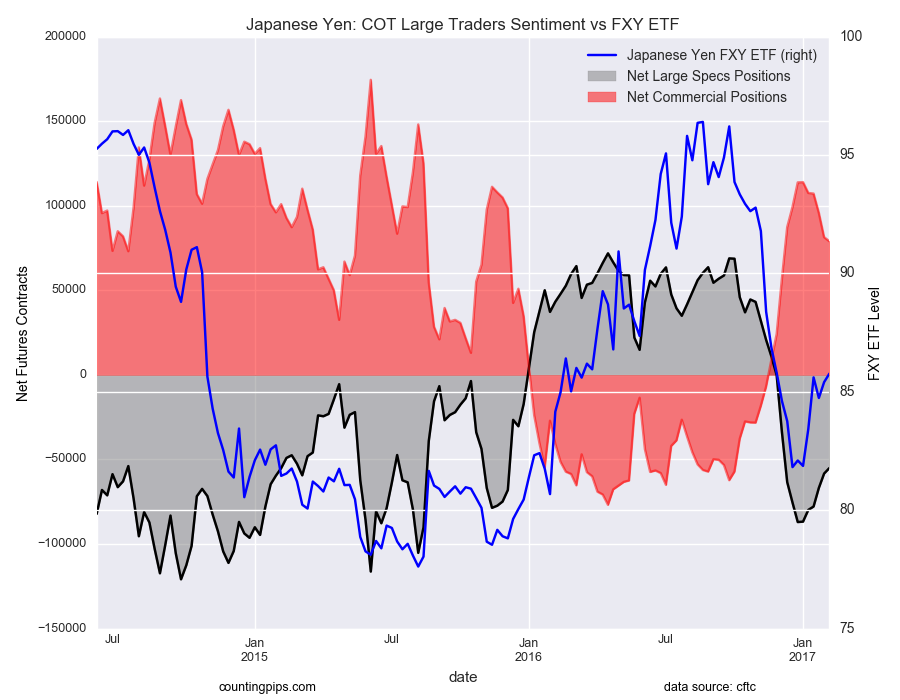
The major currencies that improved against the US dollar last week were the euro (762 weekly change in contracts), Japanese yen (3,271 contracts), Swiss franc (2,519 contracts), Canadian dollar (5,078 contracts), Australian dollar (4,692 contracts), New Zealand dollar (2,867 contracts) and the Mexican peso (4,720 contracts).

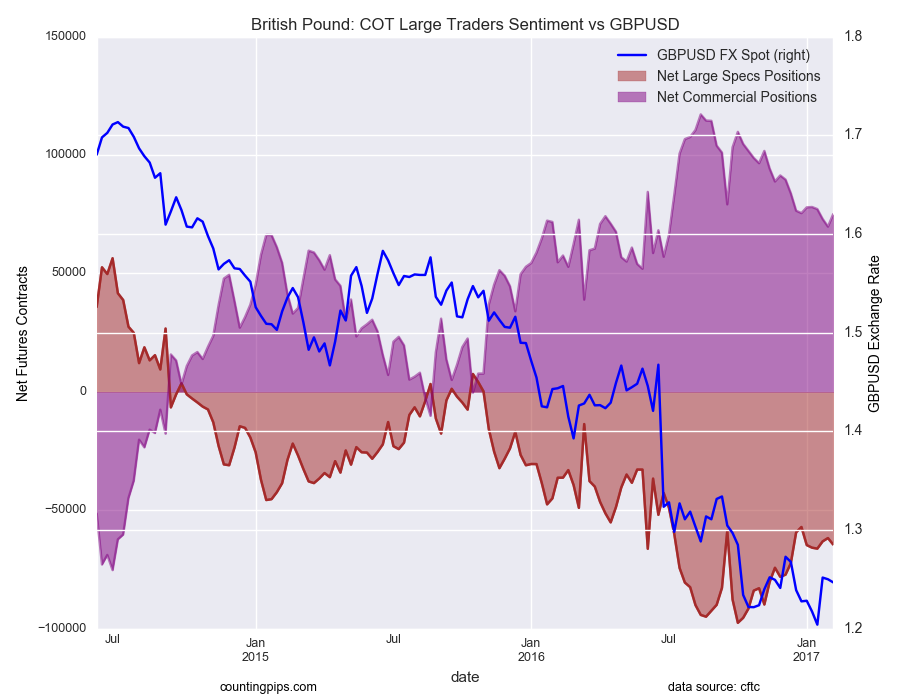
Meanwhile, the currency whose speculative bets fell last week versus the dollar was just the British pound sterling (-2,767 weekly change in contracts).


Table of Weekly Commercial Traders and Speculators Levels & Changes:

CurrencyNet CommercialsComms Weekly ChgNet SpeculatorsSpecs Weekly Chg
EuroFx48855-4423-44951762
GBP750795304-64539-2767
JPY79022-2410-550603271
CHF20263-3442-146212519
CAD-18938-898985505078
AUD-25435-9905167484692
NZD-3661-303018452867
MXN59283-4628-584884720


This latest COT data is through Tuesday and shows a quick view of how large speculators or non-commercials (for-profit traders) as well as the commercial traders (hedgers & traders for business purposes) were positioned in the futures markets. All currency positions are in direct relation to the US dollar where, for example, a bet for the euro is a bet that the euro will rise versus the dollar while a bet against the euro will be a bet that the dollar will gain versus the euro.

Weekly Charts: Large Trader Weekly Positions vs Price

EuroFX:


British Pound Sterling:


Japanese Yen:


Swiss Franc:


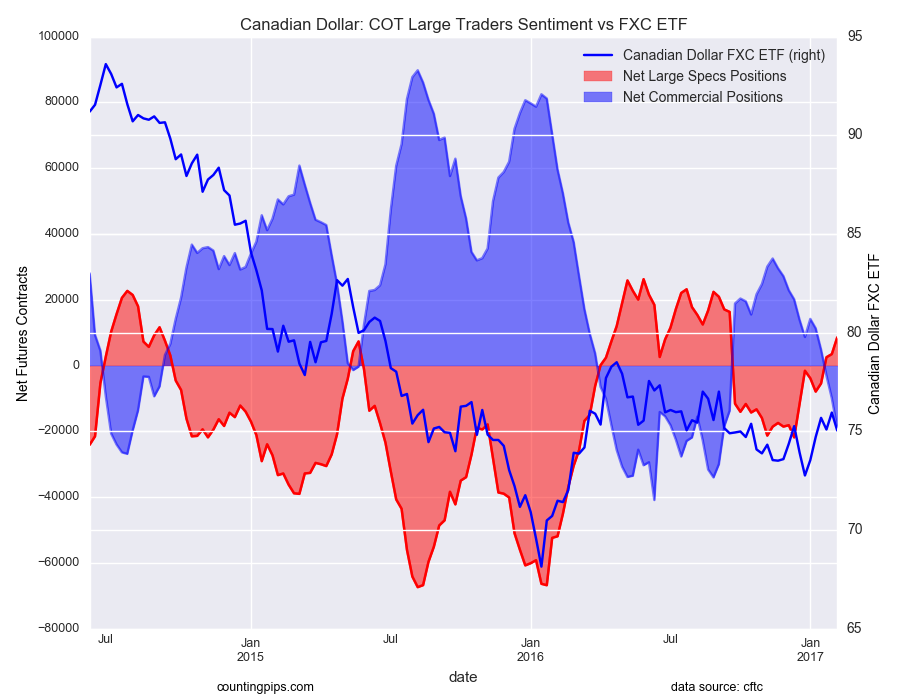
Canadian Dollar:


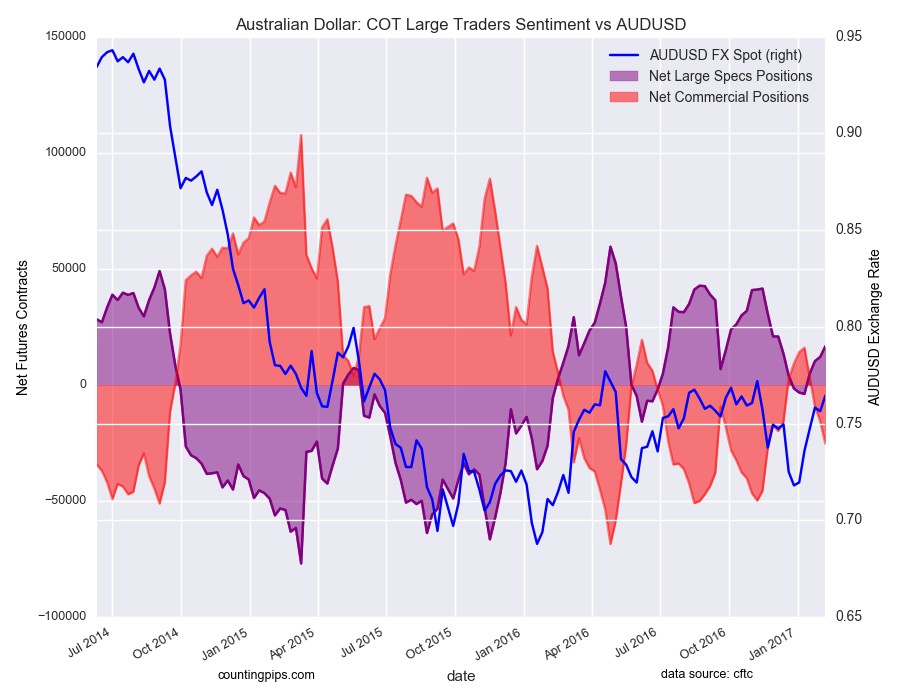
Australian Dollar:


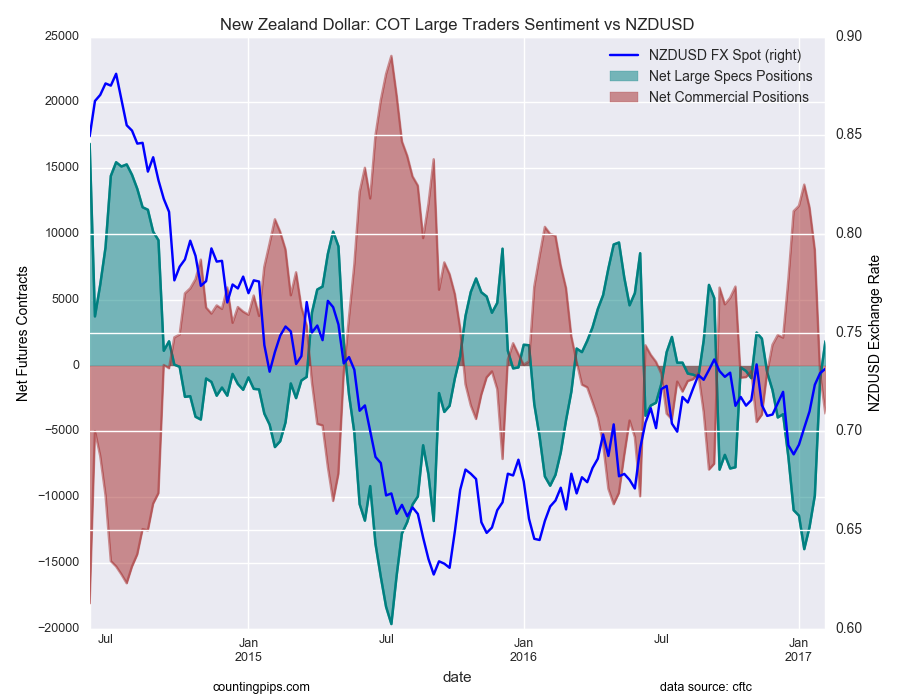
New Zealand Dollar:


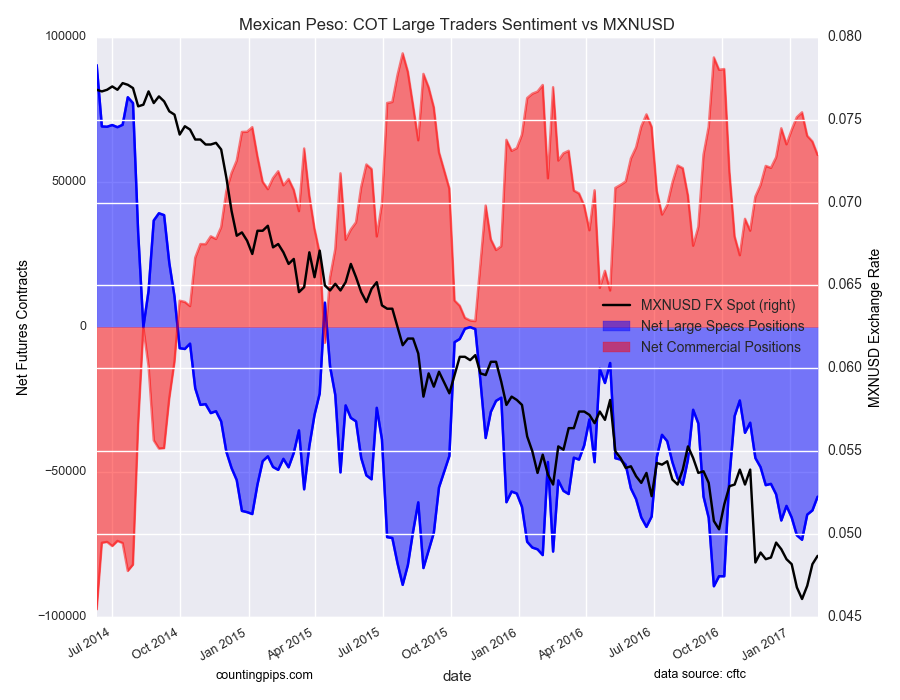
Mexican Peso:

*COT Report: The weekly commitment of traders report summarizes the total trader positions for open contracts in the futures trading markets. The CFTC categorizes trader positions according to commercial hedgers (traders who use futures contracts for hedging as part of the business), non-commercials (large traders who speculate to realize trading profits) and nonreportable traders (usually small traders/speculators). Find CFTC criteria here: (http://www.cftc.gov/MarketReports/CommitmentsofTraders/ExplanatoryNotes/index.htm).

The Commitment of Traders report is published every Friday by the Commodity Futures Trading Commission (CFTC) and shows futures positions data that was reported as of the previous Tuesday (3 days behind).

Each currency contract is a quote for that currency directly against the U.S. dollar, a net short amount of contracts means that more speculators are betting that currency to fall against the dollar and a net long position expect that currency to rise versus the dollar.

(The charts overlay the forex closing price of each Tuesday when COT trader positions are reported for each corresponding spot currency pair.) See more information and explanation on the weekly COT report from the CFTC website.

Article by CountingPips.com


Gold Speculators trimmed bullish net positions for 1st time in 3 weeks

By CountingPips.comGet our weekly COT Reports by Email

Gold Non-Commercial Positions:

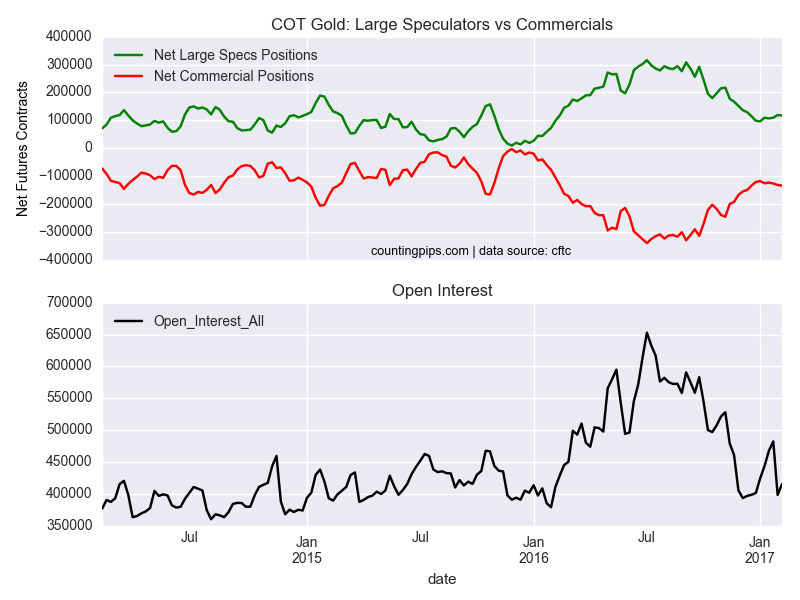
Large speculators and traders decreased their bullish net positions in the gold futures markets last week following two weeks of advances in net bullish bets, according to the latest Commitment of Traders (COT) data released by the Commodity Futures Trading Commission (CFTC) on Friday.

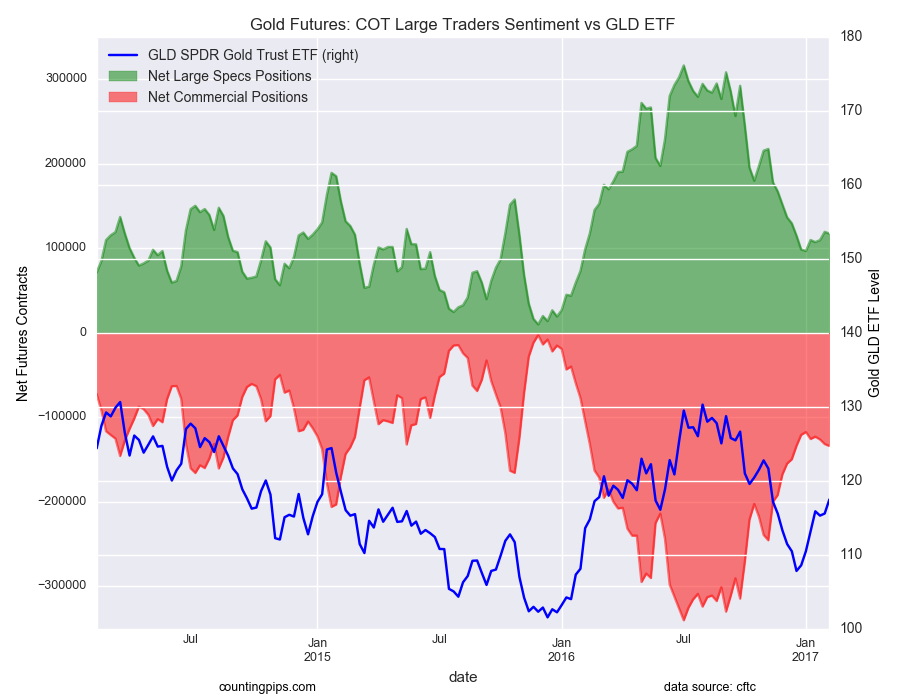
The non-commercial futures contracts of Comex gold futures, traded by large speculators and hedge funds, totaled a net position of 117,149 contracts in the data reported through February 7th. This was a weekly decline of -2,006 contracts from the previous week which had a total of 119,155 net contracts.

Gold net speculative positions, despite the weekly shortfall, have found a level of support above the net +100,000 level after briefly falling below there in late December to early January. Net positions have now been above the net bullish +100,000 level for five straight weeks.

Gold Commercial Positions:

Meanwhile, the commercial traders position, categorized by the CFTC as hedgers or traders engaged in buying and selling for business purposes, totaled a net position of -134,146 contracts last week. This is a weekly change of -2,343 contracts from the total net of -131,803 contracts reported the previous week.

Gold ETF:

Over the same weekly reporting time-frame, from Tuesday to Tuesday, the GLD ETF, which tracks the price of gold, closed at approximately $117.46 which was a rise of $1.91 from the previous close of $115.55, according to ETF financial market data.

*COT Report: The COT data, released weekly to the public each Friday, is updated through the previous Tuesday (data is 3 days old) and shows a quick view of how large speculators or non-commercials (for-profit traders) as well as the commercial traders (hedgers & traders for business purposes) were positioned in the futures markets. The CFTC categorizes trader positions according to commercial hedgers (traders who use futures contracts for hedging as part of the business), non-commercials (large traders who speculate to realize trading profits) and nonreportable traders (usually small traders/speculators). Find CFTC criteria here: (http://www.cftc.gov/MarketReports/CommitmentsofTraders/ExplanatoryNotes/index.htm).

Article by CountingPips.com


10 Year Treasury Note Speculators cut net bearish positions for 3rd out of 4 weeks

By CountingPips.comGet our weekly COT Reports by Email

10 Year Treasury Note Non-Commercial Positions:

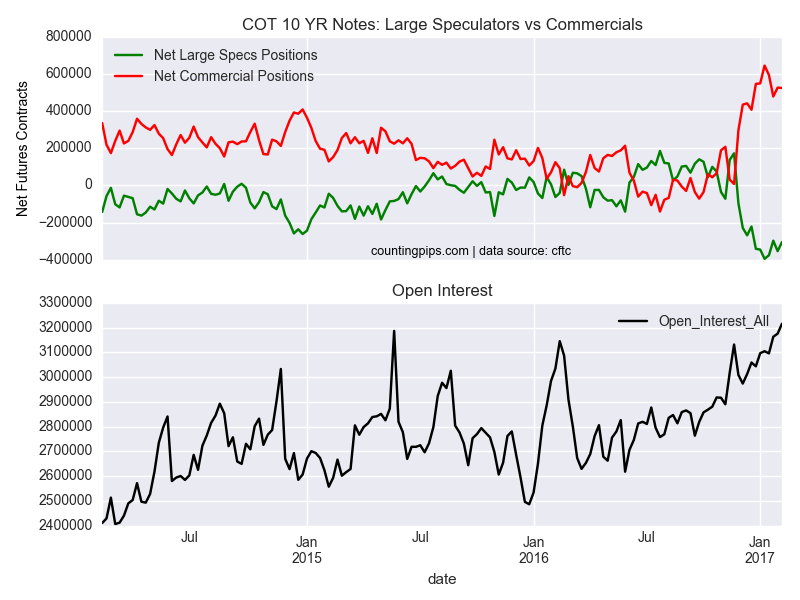
Large speculators and traders reduced their net bearish positions in the 10-year treasury note futures markets last week for the third time out of the last four weeks, according to the latest Commitment of Traders (COT) data released by the Commodity Futures Trading Commission (CFTC) on Friday.

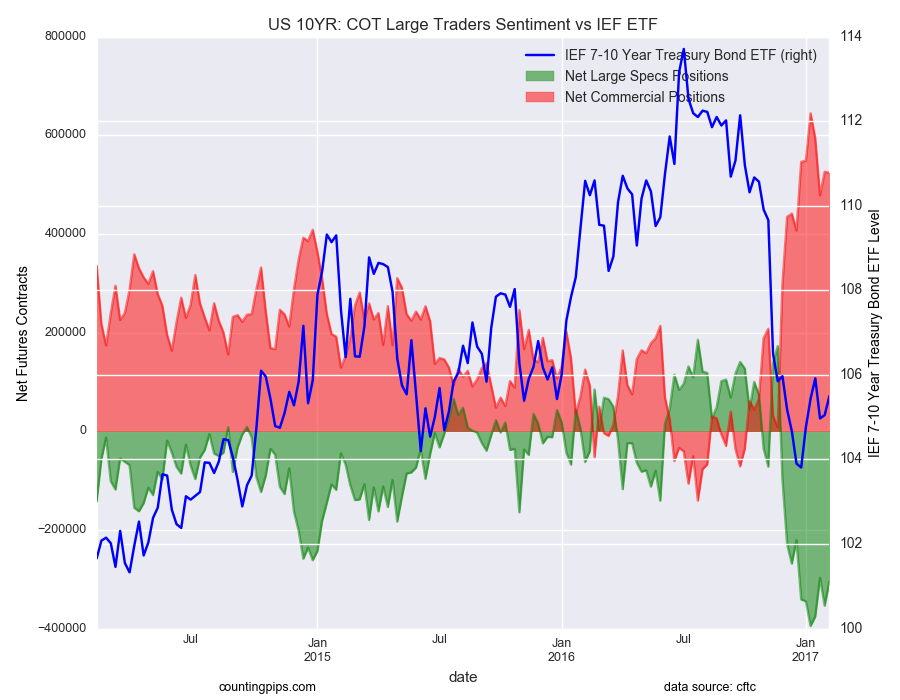
The non-commercial futures contracts of 10-year treasury note futures, traded by large speculators and hedge funds, totaled a net position of -304,577 contracts in the data reported through February 7th. This was a weekly change of 49,074 contracts from the previous week which had a total of -353,651 net contracts.

Speculative net bearish positions have now fallen by roughly 90,000 contracts in the past five weeks after speculators built up a record short net position on January 10th at -394,689 contracts.

10 Year Treasury Note Commercial Positions:

The commercial traders position, categorized by the CFTC as hedgers or traders engaged in buying and selling for business purposes, totaled a net position of 524,122 contracts last week. This is a weekly change of -1,791 contracts from the total net of 525,913 contracts reported the previous week.

IEF 7-10 Year Bond ETF:

Over the same weekly reporting time-frame, from Tuesday to Tuesday, the 7-10 Year Treasury Bond ETF (IEF) closed at approximately $105.5 which was a slight edge up of $0.45 from the previous close of $105.05, according to ETF market data.

*COT Report: The COT data, released weekly to the public each Friday, is updated through the previous Tuesday (data is 3 days old) and shows a quick view of how large speculators or non-commercials (for-profit traders) as well as the commercial traders (hedgers & traders for business purposes) were positioned in the futures markets. The CFTC categorizes trader positions according to commercial hedgers (traders who use futures contracts for hedging as part of the business), non-commercials (large traders who speculate to realize trading profits) and nonreportable traders (usually small traders/speculators). Find CFTC criteria here: (http://www.cftc.gov/MarketReports/CommitmentsofTraders/ExplanatoryNotes/index.htm).

Article by CountingPips.com


WTI Crude Oil Speculators reduced net positions for 1st time in 4 weeks

By CountingPips.comGet our weekly COT Reports by Email

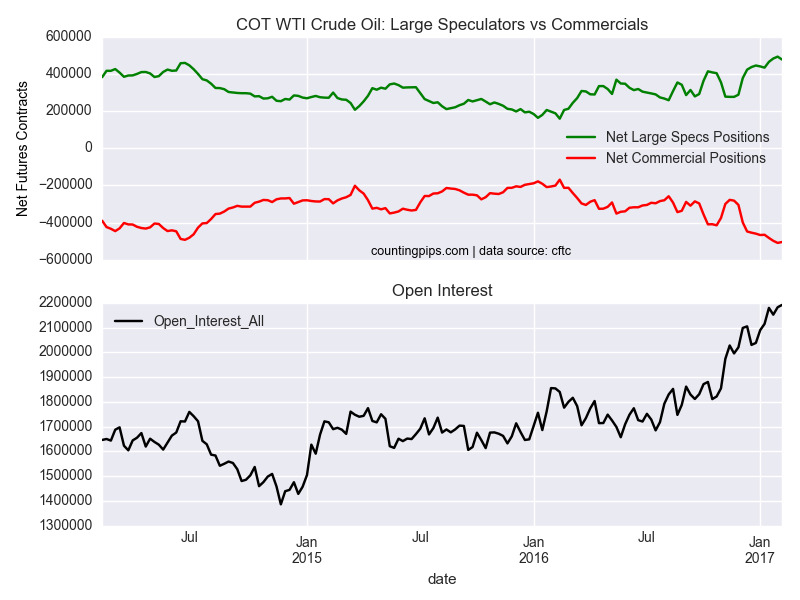
WTI Crude Oil Non-Commercial Positions:

Large speculators and traders cut back on their bullish net positions in the WTI crude oil futures markets last week for the first time in four weeks, according to the latest Commitment of Traders (COT) data released by the Commodity Futures Trading Commission (CFTC) on Friday.

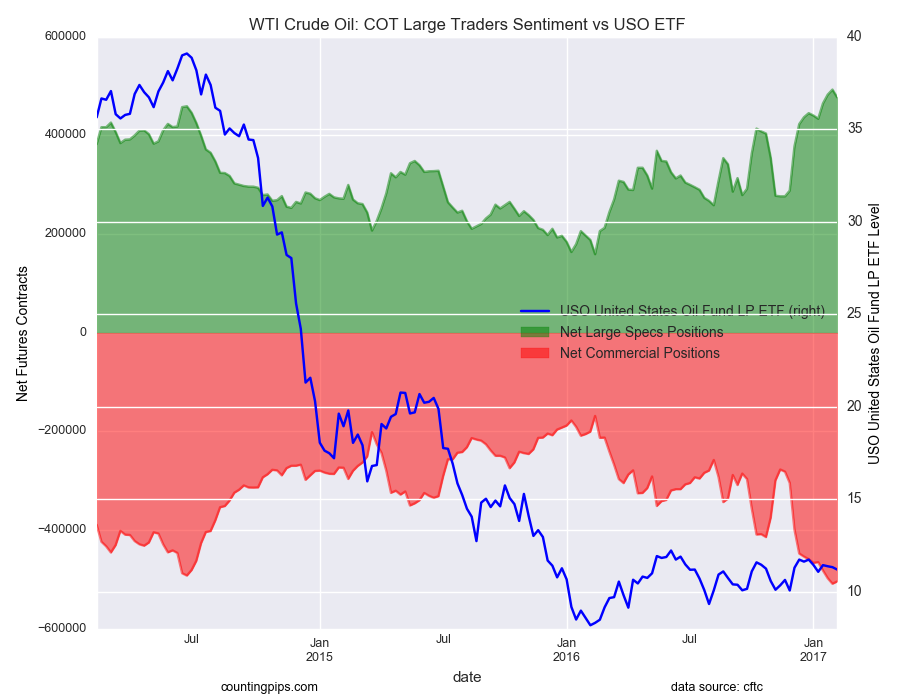
The non-commercial contracts of WTI crude futures, traded by large speculators and hedge funds, totaled a net position of 476,990 contracts in the data reported through February 7th. This was a weekly decline of -15,702 contracts from the previous week which had a total of 492,692 net contracts.

WTI speculative positions, despite the weekly decline, have been on a remarkable run to the upside since the middle of November. Bullish net positions have gone from +276,320 net bullish positions on November 22nd to a recent high point of +492,692 net bullish positions on January 31st.

WTI Crude Oil Commercial Positions:

The commercial traders position, categorized by the CFTC as hedgers or traders engaged in buying and selling for business purposes, totaled a net position of -504,483 contracts last week. This is a weekly change of 4,655 contracts from the total net of -509,138 contracts reported the previous week.

USO Crude Oil ETF:

Over the same weekly reporting time-frame, from Tuesday to Tuesday, the USO Crude Oil ETF, which tracks the price of WTI crude oil, closed at approximately $11.19 which slid by just $-0.13 from the previous close of $11.32, according to ETF market data.

*COT Report: The COT data, released weekly to the public each Friday, is updated through the previous Tuesday (data is 3 days old) and shows a quick view of how large speculators or non-commercials (for-profit traders) as well as the commercial traders (hedgers & traders for business purposes) were positioned in the futures markets. The CFTC categorizes trader positions according to commercial hedgers (traders who use futures contracts for hedging as part of the business), non-commercials (large traders who speculate to realize trading profits) and nonreportable traders (usually small traders/speculators). Find CFTC criteria here: (http://www.cftc.gov/MarketReports/CommitmentsofTraders/ExplanatoryNotes/index.htm).

Article by CountingPips.com


Copper Speculators reduced bullish net positions, remain above +50,000 level

By CountingPips.comGet our weekly COT Reports by Email

Copper Non-Commercial Positions:

Large speculators and traders reduced their net positions in the copper futures markets last week for the first time in three weeks, according to the latest Commitment of Traders (COT) data released by the Commodity Futures Trading Commission (CFTC) on Friday.

The non-commercial futures contracts of copper futures, traded by large speculators and hedge funds, totaled a net position of 51,559 contracts in the data reported through February 7th. This was a weekly shortfall of -5,717 contracts from the previous week which had a total of 57,276 net contracts.

Copper speculative positions remain above the +50,000 level for a third straight week and have continued to be on the net bullish side for fifteen consecutive weeks after turning net bullish or long on November 1st.

Copper Commercial Positions:

The commercial traders position, categorized by the CFTC as hedgers or traders engaged in buying and selling for business purposes, totaled a net position of -54,652 contracts last week. This is a weekly increase of 3,127 contracts from the total net of -57,779 contracts reported the previous week.

Copper ETN:

Over the same weekly reporting time-frame, from Tuesday to Tuesday, the JJC iPath Bloomber Copper ETN, which tracks the price of copper, closed at approximately $30.38 which was a fall of $-1.09 from the previous close of $31.47, according to financial market data.

*COT Report: The COT data, released weekly to the public each Friday, is updated through the previous Tuesday (data is 3 days old) and shows a quick view of how large speculators or non-commercials (for-profit traders) as well as the commercial traders (hedgers & traders for business purposes) were positioned in the futures markets. The CFTC categorizes trader positions according to commercial hedgers (traders who use futures contracts for hedging as part of the business), non-commercials (large traders who speculate to realize trading profits) and nonreportable traders (usually small traders/speculators). Find CFTC criteria here: (http://www.cftc.gov/MarketReports/CommitmentsofTraders/ExplanatoryNotes/index.htm).

Article by CountingPips.com


Silver Speculators raised bullish net positions for 6th straight week

By CountingPips.comGet our weekly COT Reports by Email

Silver Non-Commercial Positions:

Large speculators and traders continued to increase their bullish net positions in the silver futures markets last week for a sixth consecutive week, according to the latest Commitment of Traders (COT) data released by the Commodity Futures Trading Commission (CFTC) on Friday.

The non-commercial futures contracts of Comex silver futures, traded by large speculators and hedge funds, totaled a net position of 78,277 contracts in the data reported through February 7th. This was a weekly increase of 2,303 contracts from the previous week which had a total of 75,974 net contracts.

Silver speculators have now pushed their bullish totals to the highest level since September 27th when net positions equaled +84,862 contracts.

Silver Commercial Positions:

The commercial traders position, categorized by the CFTC as hedgers or traders engaged in buying and selling for business purposes, totaled a net position of -92,712 contracts last week. This is a weekly decline of -3,299 contracts from the total net of -89,413 contracts reported the previous week.

Silver ETF:

Over the same weekly reporting time-frame, from Tuesday to Tuesday, the SLV ishares ETF, which tracks the price of silver, closed at approximately $16.79 which was a gain of $0.16 from the previous close of $16.63, according to ETF financial market data.

*COT Report: The weekly commitment of traders report summarizes the total trader positions for open contracts in the futures trading markets. The CFTC categorizes trader positions according to commercial hedgers (traders who use futures contracts for hedging as part of the business), non-commercials (large traders who speculate to realize trading profits) and nonreportable traders (usually small traders/speculators). Find CFTC criteria here: (http://www.cftc.gov/MarketReports/CommitmentsofTraders/ExplanatoryNotes/index.htm).

Article by CountingPips.com


S&P500 Speculators turned net bearish for 1st time since September

By CountingPips.comGet our weekly COT Reports by Email

S&P500 Non-Commercial Positions:

Large speculators and traders decreased their net positions in the S&P500 stock futures markets last week and registered a net bearish position for the first time since September, according to the latest Commitment of Traders (COT) data released by the Commodity Futures Trading Commission (CFTC) on Friday.

The non-commercial futures contracts of S&P500 futures, traded by large speculators and hedge funds, totaled a net position of -1,688 contracts in the data reported through February 7th. This was a weekly change of -2,688 contracts from the previous week which had a total of 1,000 net contracts.

Speculative net positions have fallen for eight straight weeks and are now at the lowest level since September 13th, 2016 when net positions totaled -145 contracts.

S&P500 Commercial Positions:

The commercial traders position, categorized by the CFTC as hedgers or traders engaged in buying and selling for business purposes, totaled a net position of -4,899 contracts last week. This is a weekly rise of 6,986 contracts from the total net of -11,885 contracts reported the previous week.

S&P500 Stock Market Index:

Over the same weekly reporting time-frame, from Tuesday to Tuesday, the S&P500 index closed at approximately 2293.08 which was a gain of 14.21 from the previous close of 2278.87, according to market data.

*COT Report: The COT data, released weekly to the public each Friday, is updated through the previous Tuesday (data is 3 days old) and shows a quick view of how large speculators or non-commercials (for-profit traders) as well as the commercial traders (hedgers & traders for business purposes) were positioned in the futures markets. The CFTC categorizes trader positions according to commercial hedgers (traders who use futures contracts for hedging as part of the business), non-commercials (large traders who speculate to realize trading profits) and nonreportable traders (usually small traders/speculators). Find CFTC criteria here: (http://www.cftc.gov/MarketReports/CommitmentsofTraders/ExplanatoryNotes/index.htm).

Article by CountingPips.com


How Can The Elliott Wave Principle Improve My Trading?

By Elliott Wave International

Answer: Every trader, every analyst and every technician has favorite techniques to use when trading. But where traditional technical studies fall short, the Wave Principle kicks in to show high-confidence price targets. Just as important, it can distinguish high probability trade setups from the ones that traders should ignore.

Here are five ways the Wave Principle improves trading:

1. Identifies Trend

The Wave Principle identifies the direction of the dominant trend. A five-wave advance identifies the overall trend as up. Conversely, a five-wave decline determines that the larger trend is down. Why is this information important? Because it is easier to trade in the direction of the dominant trend, since it is the path of least resistance and undoubtedly explains the saying, “the trend is your friend.”

2. Identifies Countertrend

The Wave Principle also identifies countertrend moves. The three-wave pattern is a corrective response to the preceding impulse wave. Knowing that a recent move in price is merely a correction within a larger trending market is especially important for traders because corrections are opportunities for traders to position themselves in the direction of the larger trend of a market.

3. Determines Maturity of a Trend

As Elliott observed, wave patterns form larger and smaller versions of themselves. This repetition in form means that price activity is fractal, as illustrated in Figure 2-1. Wave (1) subdivides into five small waves, yet is part of a larger five-wave pattern. How is this information useful? It helps traders recognize the maturity of a trend. If prices are advancing in wave 5 of a five-wave advance for example, and wave 5 has already completed three or four smaller waves, a trader knows this is not the time to add long positions. Instead, it may be time to take profits or at least to raise protective stops.

4. Provides Price Targets

What traditional technical studies simply don’t offer — high-confidence price targets — the Wave Principle again provides. When R.N. Elliott wrote about the Wave Principle in Nature’s Law, he stated that the Fibonacci sequence was the mathematical basis for the Wave Principle. Elliott waves, both impulsive and corrective, adhere to specific Fibonacci proportions, as illustrated in Figure 2-2. For example, common objectives for wave 3 are 1.618 and 2.618 multiples of wave 1. In corrections, wave 2 typically ends near the .618 retracement of wave 1, and wave 4 often tests the .382 retracement of wave 3. These high-confidence price targets allow traders to set profit-taking objectives or identify regions where the next turn in prices will occur.

5. Provides Specific Points of Ruin

At what point does a trade fail? Many traders use money management rules to determine the answer to this question, because technical studies simply don’t offer one. Yet the Wave Principle does — in the form of Elliott wave rules.

Rule 1: Wave 2 can never retrace more than 100% of wave 1.

Rule 2: Wave 4 may never end in the price territory of wave 1.

Rule 3: Out of the three impulse waves — 1, 3 and 5 — wave 3 can never be the shortest.

A violation of one or more of these rules implies that the operative wave count is incorrect. How can traders use this information? If a technical study warns of an upturn in prices, and the wave pattern is a second wave pullback, the trader knows specifically at what point the trade will fail — a move beyond the origin of wave 1. That kind of guidance is difficult to come by without a framework like the Wave Principle.

Technical studies can pick out many trading opportunities, but the Wave Principle helps traders discern which ones have the highest probability of being successful. This is because the Wave Principle is the framework that provides history, current information and a peek at the future. When traders place their technical studies within this strong framework, they have a better basis for understanding current price action.

* * * * * * * *

This answer is from Jeffrey Kennedy, Senior Instructor and Analyst at Elliott Wave International. You can learn how to apply the Elliott Wave Principle to your trading in a newly-released 15-minute video from Jeffrey Kennedy, Introduction to the Wave Principle Applied.


Free 15-minute video
Introduction to the Wave Principle Applied

In this free 15-minute video excerpted from one of Elliott Wave International’s most popular online courses, Senior Analyst Jeffrey Kennedy explains how you can take the Wave Principle and turn it into a trading methodology.

Get free, instant access

This article was syndicated by Elliott Wave International and was originally published under the headline How Can The Elliott Wave Principle Improve My Trading?. EWI is the world’s largest market forecasting firm. Its staff of full-time analysts led by Chartered Market Technician Robert Prechter provides 24-hour-a-day market analysis to institutional and private investors around the world.