At the H4 chart of EUR USD, the bearish tendency continues. The upside Window provided resistance and Harami pattern indicated a descending movement. Three Line Break chart and Heiken Ashi candlesticks confirm a bearish direction.
At the H1 chart of EUR USD, the downtrend continues. High Wave and Three Methods patterns showed a descending movement. The downside Window may provide support. Three Line Break chart and Heiken Ashi candlesticks confirm a bearish direction.
USD JPY, “US Dollar vs. Japanese Yen”
At the H4 chart of USD JPY, bullish Hammer and Inverter Hammer patterns indicated an ascending correction. Three Line Break chart and Heiken Ashi candlesticks confirm a bullish direction; High Wave patterns shows a bearish pullback.
Attention! Forecasts presented in this section only reflect the author’s private opinion and should not be considered as guidance for trading. RoboForex LP bears no responsibility for trading results based on trading recommendations described in these analytical reviews.
My recent analysis of the markets has shown what I believe to be an explosion in market volatility set to starting happening between February 21, 2017 and March 30, 2017. The historical VIX cycles have been running about 18~22 week intervals for expansion and extreme volatility levels. The period August 2015 to January 2016 represented roughly 5 months. The period between January 2016 to June 2016 represented roughly 5 months. The period between June 2016 to Early November 2016 represented roughly 5 months (just a little short of 5 months in reality).
The period between November 2016 to the next volatility expansion phase, if this cycle continues, should be March/April 2107 at a target date range.
How will this relate to the US major markets? I currently believe the recent “melt-up” will stay in place until we have some catalyst that will change the direction of the markets. In other words, the path of least resistance in the US major markets is upward right now – at least till something changes that direction/sentiment. The VIX cycles may be related to some catalyst event or external foreign market event that could change the major market directions – nut only time will tell.
Currently, on the below DIA chart, I can state that my estimates for upside resistance is 210~212 based on historical price action. The reason I believe these levels will become upside target objectives is based on my understanding of price rotation, expansion and contraction as well as Fibonacci ratios. The actual number that I believe will be resistance is 211.63 and I believe this level will be reached in March 2017 or early April 2017.
Once this critical resistance level is reached in the DIA, then all bets are off in terms of the price retracement/rotation that may occur. Given historical price rotation as examples, I would estimate that the DIA could retrace a minimum of 6~8% ($13 to $17). A moderate price rotation would equate to a move of 10%~13.5% ($21 to $28). Beyond these expected levels of support, all bets are off in terms of downside potential. The closest major downside support levels are $178.25, $170.30 and $154.35 – these levels represent a greater than 15% total price retracement and would put us dangerously close to “Bear Market Territory”.
Of course, if the VIX cycles persist as I suspect, a massive increase in volatility will drive other markets into further trending or price rotation as well. The tech heavy NASDAQ (QQQ) has been mirroring the DIA and my projected top level is 128.15. Currently, the QQQ is at $126.54 – only $1.65 (or 1.33%) away from my expected peak level. After these peaks have been reached, I expect the major market to take pause and attempt to resume trending as we move closer to the volatility cycle period I suspect is driving the VIX (March/April 2017). It is because of this that I’m issuing this warning to my members to be cautious of extended risk or exposed positions as we near the end of February 2017. I believe the old term, “Beware the ides of March”, may be a harsh reality this year.
As I continue my extended analysis of the US major markets and commodity markets in relation to these VIX cycles, I will post “Part 2” of this article within a day or so. I wanted to get this out to all my members and associates so they were brought aware of the fact that the markets are beginning a phase of volatility expansion that should not end till near April 1st, 2017.
In short, what does all this mean? Well, it means now is not the time to be adding new long equity position for long term growth. Going forward, its going to be all about active trading and focusing on my Momentum Reversal Method (MRM) and trading just the hot stocks and sectors for quick oversized gains.
On Feb 8th, myself and subscribers closed out our NUGT trade for a 112% profit that we entered December 16th.
This week we got long ERX at $33, and sold half the position 24 hours later for another quick 7.7% profit and there is still a lot of room for bigger gains there.
So, if you are looking for a simple and highly accurate pulse on the market along with timely swing trades I urge you to join my newsletter at www.ActiveTradingPartners.com – STAY TUNED FOR PART II…
Being under pressure, the EUR/USD pair is moving downwards. Possibly, today the price may reach 1.0633 and then return to 1.0673. After that, the instrument may fall towards 1.0614. If the market breaks 1.0610, it may continue its decline with the target at 1.0550.
GBP USD, “Great Britain Pound vs US Dollar”
The GBP/USD pair has expanded its consolidation range to the upside and right now is moving downwards. Possibly, the price may expand the range to the downside as well, to reach 1.2450. If later the instrument breaks the range upwards, the market may continue growing and reach 1.2700; if downwards – fall with the target at 1.2344.
USD CHF, “US Dollar vs Swiss Franc”
The USD/CHF pair continues growing inside the uptrend. Possibly, today the price may reach 1.0040 and then form a correctional structure towards 0.9985. Later, in our opinion, the market may start another growth with the target at 1.0066.
USD JPY, “US Dollar vs Japanese Yen”
The USD/JPY pair has reached the first target of the ascending wave. Possibly, the price may be corrected towards 112.56 and then grow to reach the local target at 114.50. The main target of this wave is at 115.30.
AUD USD, “Australian Dollar vs US Dollar”
The AUD/USD pair is consolidating in the center of the range around 0.7642. Possibly, the price may fall to reach 0.7593 and then test 0.7620 from below. After that, the instrument may continue falling with the target at 0.7550.
USD RUB, “US Dollar vs Russian Ruble”
Being under pressure, the USD/RUB pair is moving downwards. Possibly, today the price may reach 58.54. Later, in our opinion, the market may be corrected with the target at 59.41.
XAU USD, “Gold vs US Dollar”
Gold has broken the channel of the fifth ascending wave. Possibly, today the price may continue falling inside the downtrend to reach 1211.60. After that, the instrument may be corrected towards 1230.00 to test it from below and then continue moving downwards with the target at 1275.00.
BRENT
Being under pressure, Brent is moving upwards. Possibly, the price may reach 56.50. Later, in our opinion, the market may fall towards the downside border of the consolidation range at 54.50.
Attention! Forecasts presented in this section only reflect the author’s private opinion and should not be considered as guidance for trading. RoboForex LP bears no responsibility for trading results based on trading recommendations described in these analytical reviews.
By the end of trading on Thursday, the EUR/USD pair closed down. In the second half of the day, the euro rate came under pressure from a sharp rise in Treasury bond yields. This rise came after comments from US president Donald Trump saying that he intended to announce some changes to the tax system in the next few weeks. He made this announcement during a meeting with airline executives. The dollar rose across the board on this news, and the euro fell from 1.0694 to 1.0651.
Market expectations:
In Asia, the EUR/USD pair is trading at 1.0662 and has been consolidating at this level for 11 hours. 10-year and 30-year US bond yields are trading in positive territory, which is preventing the euro from strengthening against the US dollar.
The Euro Currency Index is growing and currently stands at 99.52 points. This means that the euro is strengthening on most of the crosses. The euro showed some moderate growth yesterday against the Swiss franc and the Japanese yen. Traders in Asia are now trying to induce an upwards movement of the euro against both the Australian dollar and the British pound.
As I’ve already stated above, the growth in US bond yields is holding up growth of the euro against the US dollar. For 10-year bonds, there is an immediate resistance at 2.4277%. I think that from here, yields will start to fall. Correspondingly, I expect the euro to fall to 1.0640, and after a reversal, some upwards movement to around 1.0702. I only doubt that buyers will be able to break through the trend line at 1.0679 on the first attempt.
Day’s news (GMT+3):
12:30 UK: industrial production (Dec), manufacturing production (Dec), trade balance (Dec);
16:30 Canada: net change in employment (Jan), unemployment rate (Jan);
18:00 UK: NIESR GDP estimate (Nov – Jan);
18:00 USA: Michigan Consumer Sentiment Index and preliminary inflation projections (Feb);
Trump’s announcement yesterday stopped the euro from returning above 1.0700. US bond yields rose sharply. By the end of the day, the pair had slid to 1.0651. It’s worth noting that the rate stayed within the range of the daily hammer that formed, between 1.0641 and 1.0714. These are the key support and resistance levels for Friday.
According to my forecast, I’m expecting to see movement in the same pattern that occurred on the 8th of February. The 67th degree extends to 1.0637 from a maximum of 1.0714, which will act as a support for buyers. As bond yields rise, the euro will remain under pressure. As soon as bonds start to fall, the euro will rebound. This forecast relies on an analysis of cycles and patterns.
If you’re wondering whether the euro might fall below 1.0641, the answer is that it might. The trend line was broken on the 7th of February, bond yields are rising and it’s not a foregone conclusion that they will come back down. It is exactly because of this that I’m not sure whether the TR2 trend line will be broken through. Yesterday’s break was a false one, so I’ve had to draw the line through the previous maximum of 1.0710.
See why rubber prices bounced from an 11-year low to a 4-year high
By Elliott Wave International
There are nearly 50 commodity markets traded all over the world at any given time. That’s one for every state in the United States.
So, how is an investor or trader supposed to know which of these markets to follow and which ones to dismiss?
Well, for our long-time Commodity Junctures editor Jeffrey Kennedy, the answer is simple: Don’t wait for an Elliott wave pattern to develop on a market’s price chart. But rather, choose price charts that already present discernible Elliott wave patterns.
Jeffery will be the first to admit — sometimes, they show up in the most unlikely of places.
Back in November of 2016, Jeffrey (at a Commodity Junctures subscriber’s behest) found an opportunity on the price charts of a market he never included before in his 20-plus years as EWI’s senior commodity analyst –rubber.
That opportunity took the shape of one of the most exciting Elliott wave patterns: the ending diagonal. It’s a five-wave pattern labeled 1-5 that can only form in the final position of a wave sequence — i.e., wave 5 of an impulse, or wave C of a correction.
Most importantly, when this pattern ends, it’s followed by a swift and powerful reversal that retraces the entire length of the diagonal. Here’s its idealized diagram, in bull and bear markets:
In his November 2016 Monthly Commodity Junctures video episode on rubber, Jeffrey made the case for a post-diagonal thrust UP for the long-suffering rubber market:
“We’ll be discussing a market that I’ve actually never spoken about before. I was surprised to find very high quality wave patterns on the charts. This is how we can label the weekly price chart of rubber.
“An ending diagonal in the wave c position. Subsequent price action has been quite impulsive to the upside. Now, as you know, whenever an ending diagonal terminates, it tends to resolve quite swiftly and quite sharply back to beyond the origin of the pattern, and that comes into play about 285.5.
“As we move into 2017, I suspect that we will have retraced that entire move to the downside that essentially took two-and-a-half years to form.”
From there, rubber prices made a serious commitment to the upside, soaring to a four-year high on January 26.
Now, according to mainstream analysis, rubber’s shocking rebound off 11-year lows is the result of weeks’ long floods in Thailand, the world’s top rubber producer.
You, however, now know the real story: Rubber’s rally began long before the sky’s opened up in Southern Thailand. It kicked off in late November, as the result of a complete Elliott wave ending diagonal pattern.
When it comes to choosing the right commodity market at the right time, the independent perspective of Elliott wave analysis goes a long way.
Free eBook: Commodity Traders Classroom
Get 32 pages of actionable trading lessons, hand-selected by EWI Chief Commodity Analyst Jeffrey Kennedy, designed to make you a better trader.
This article was syndicated by Elliott Wave International and was originally published under the headline Elliott Wave Analysis: Where the RUBBER Meets the Road. EWI is the world’s largest market forecasting firm. Its staff of full-time analysts led by Chartered Market Technician Robert Prechter provides 24-hour-a-day market analysis to institutional and private investors around the world.
Trading on the euro on Wednesday closed slightly up. After a fall to 1.0641, the rate restored to 1.0714. This strengthening was facilitated by a fall in US bond yields. Yields from 10-year bonds fell from 2.3866 to 2.3267 (-2.5%).
Market expectations:
Europe’s and the US’ economic calendars are bare today. However, there will be several speeches, although the only one likely to have much influence is Bank of England governor Mark Carney’s. So, for Thursday, the direction of major currencies will hinge on the US debt market.
In Asia, yields for 10-year US bonds are down slightly, and so the EUR/USD rate is consolidating at around 1.0689 having fallen from a high of 1.0714.
Eurobulls yesterday left a long shadow on the daily candlestick, which is indicative of continued growth for the EUR/USD pair. My forecast is showing a breakthrough of the TR2 trend line with subsequent growth up to 1.0726. If activity from buyers is high, then I’m not ruling out a testing of the TR1 trend line at 1.0743. Following the formation of a hammer on Wednesday, the target is around the 1.0780 mark. For this bullish signal to be neutralised by buyers, they must close trading at around 1.0641.
Day’s news (GMT+3):
9:45 Switzerland: unemployment rate (Jan);
10:00 Germany: trade balance (Dec);
12:00 Australia: RBA governor Philip Lowe’s speech;
16:30 Canada: New Housing Price Index (Dec); USA: initial jobless claims (Feb 3);
17:10 USA: Fed’s Bullard speech;
19:35 Canada: Bank of Canada deputy governor Shembri’s speech;
21:10 USA: Fed’s Evans speech;
21:30 UK: Bank of England governor Mark Carney’s speech.
Yesterday’s predictions for the euro came off in full. On the back of a fall in US bond yields, the euro restored from 1.0641 to 1.0714.
Now, on the 7th of February, the euro broke through the trend line. With this breakthrough, the bears have paved the way to a range of 1.0583 – 1.0600. Demand for US bonds halted the euro’s slide at 1.0641. By the end of the day, a hammer had formed with a target of around 1.0780. So, what will happen to the euro now?
On the one hand, traders are exposed to political risks in the run-up to the French presidential elections. On the other, Donald Trump is trying to weaken the dollar with his verbal assaults. In this situation, the only trends worth discussion are sideways ones. The euro remains within a range of 1.0340 – 1.0873, where it will stay at least until the end of March this year.
There is an intermediate support level at 1.0678. Before markets open in Europe, the rate should ideally stay at around this level. In such a case, there is a high probability of the TR2 trend line being broken at the first attempt and the rate should reach 1.0726 (projected from a line drawn between the tops 1.0706 and 1.0714). If there is high buyer activity in Europe, I’m not ruling out the TR1 trend line (at 1.0743) being tested. From here, buyers will have to try to restore the rate to around 1.0695 in order to form an inverted hammer by the end of the day, thereby securing a range on the shadow of 1.0641 – 1.0743.
Probably, after finishing the wave 2 in the form of the zigzag, the EUR/USD pair formed the descending impulse in the wave [i]. Consequently, after finishing the local correction, the market may resume falling in the wave [iii].
More detailed structure is shown on the H1 chart. It looks like the pair is forming the ascending zigzag in the wave [ii]. On Thursday, the market may continue its short-term growth in the wave (c) of [ii].
GBP USD, “Great Britain Pound vs US Dollar”
Possibly, after finishing the ascending zigzag, which may be the wave (a) or (w), the GBP/USD pair started forming the wave (b) or (x) in the form of the double zigzag. In the nearest future, the market may complete the wave x and start falling in the wave y.
As we can see at the H1 chart, the pair is forming the ascending zigzag in the wave x. in the nearest future the market may complete the wave [C] and start forming the descending zigzag in the wave y of (b) or (x).
USD JPY, “US Dollar vs Japanese Yen”
It’s highly likely that the USD/JPY pair completed the diagonal triangle in the wave [c] of 2, rebounded from the downside border of the pattern, and started forming the wave [i]. To confirm a new growth, the market has to finish the above-mentioned wave.
After rebounding from the downside border of the diagonal triangle, the pair formed the ascending impulse in the wave (i) along with the correctional wave (ii). As a result, in the nearest future the market may form another bullish impulse, this time in the wave (iii) of [i].
AUD USD, “Australian Dollar vs US Dollar”
It’s highly likely that after finishing the wave [i] in the form of the zigzag, the AUD/USD pair completed the zigzag[ii] of the diagonal triangle in the wave 5. Consequently, in the nearest future the market may resume moving downwards in the wave [iii].
At the M30 chart, the pair is about to complete the flat in the wave (ii). As a result, after finishing the ascending impulse in the wave c, the market may resume falling in the third wave.
Attention! Forecasts presented in this section only reflect the author’s private opinion and should not be considered as guidance for trading. RoboForex LP bears no responsibility for trading results based on trading recommendations described in these analytical reviews.
The Reserve Bank of New Zealand held the official cash rate steady at 1.75%.
RBNZ Governor Graeme Wheeler warned the “protectionist risk” posed by the Trump administration is a major hazard.
“The biggest risk I think is the protectionist risk,” Wheeler told reporters at a press conference. “It’s unfortunate that a lot of this rhetoric is taking place at a time when we’ve seen the slowest growth in merchandise trade volumes in the past five years seen since the early 1980s.” New Zealand, which is heavily reliant on international trade, was a key backer of the Trans-Pacific Partnership abandoned by Trump. “Let’s say for example the U.S. really did get serious about imposing 45 percent tariffs on China for example or large tariffs on Mexico,” Wheeler said. “That would have serious implications, I believe, for the global economy.”
Wheeler said the bank had adopted a neutral policy stance, having previously been in an easing mode after cutting the official cash rate three times last year. The bank’s official forecasts did not show a rise in rates to 2 percent until March 2020. Markets had been pricing in a rise around late 2017 or early 2018 and quickly moved to push that out by a few months.
Assistant Governor John McDermott said that the market’s reaction to the rate decision was “exactly what we wanted” and the bank was “not trying to fake the market on the kiwi” with its policy outlook.
McDermott said the bank’s focus had shifted to external risks, including U.S. protectionism, and away from domestic issues as the local economy grows faster than almost any other developed nation. Record migration, strong consumer spending and a boom in home building has all combined to support activity. The dairy industry, New Zealand’s major goods exporter, also enjoyed a recovery in prices recently.
Inflation, however, has been uncomfortably low. After reaching only 0.4% for most of last year, it achieved 1.4% in December, just inside the RBNZ’s target band of 1 to 3%. Wheeler said inflation was expected to return to the midpoint of the target band only “gradually.” Indeed, the bank’s official forecasts did not see inflation reaching 2% until June 2019.
We think that inflation will reach 2% much earlier and dovish RBNZ statement was aimed to weaken the kiwi.
Technical analysis
Long upper shadow on Tuesday’s candlestick, followed by two daily drops suggest that the short-term outlook turned to bearish. However, we know that this situation was caused by expectations for the RBNZ statement that turned out to be even more dovish than anticipated. We expect a much faster rise in New Zealand’s inflation than the RBNZ and suppose that the dovish statement was a kind of currency intervention by the RBNZ. That is why market expectations may quickly come back to pre-statement levels. We think that technical analysis signals may wrong-foot us this time, so we focus mainly on fundamental analysis.
Trading strategy
We think that an overnight fall was only a short-term reaction to dovish RBNZ statement and we used this drop as an opportunity to buy the NZD/USD. Our lowered NZD/USD bid at 0.7200 was filled today. We are long for 0.7400.
After rebounding from the group of upside fibo-levels, the EUR/USD pair resumed its decline. On Thursday, the local correction may take place, which may later be followed by a further decline of the price towards the area at 1.0575 – 1.0565.
At the H1 chart, the target of the current ascending correction is the retracement of 50%. If the price rebounds from this level, the pair may start a new descending movement towards the closest group of fibo-levels.
EUR GBP, “Euro vs Great Britain Pound”
After rebounding from the retracement of 38.2%, the EUR/GBP pair resumed moving downwards. The closest target for bears is again the group of fibo-levels near the correctional retracement of 78.6%.
At the H1 chart, the local correction may take place during the day. Later, the price resume falling towards its downside targets, which are confirmed by intraday fibo-levels.
Attention! Forecasts presented in this section only reflect the author’s private opinion and should not be considered as guidance for trading. RoboForex LP bears no responsibility for trading results based on trading recommendations described in these analytical reviews.
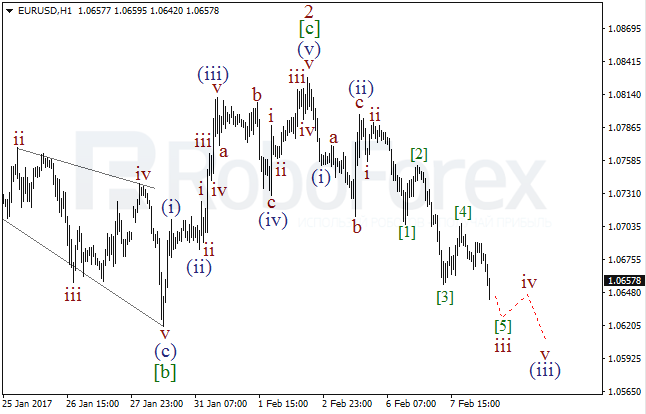
Probably, after finishing the descending wedge in the wave 1, the EUR/USD pair completed the wave 2 in the form of the zigzag. As a result, in the nearest future the market may fall in the wave [i].
More detailed structure is shown on the H1 chart. It looks like the pair is finishing the wave iii of the descending extension in the wave (iii). In the nearest future, the market may start a new local correction.
GBP USD, “Great Britain Pound vs US Dollar”
After finishing the wave [iii], the GBP/USD pair formed the ascending zigzag, which may be the wave (a) or (w). Possibly, the wave (b) or (x) may take the form of the double zigzag. In this case, the market is expected to complete the wave x and start forming the descending zigzag in the wave y.
As we can see at the H1 chart, yesterday the pair completed the descending zigzag in the wave w. Consequently, on Wednesday the price may complete the wave x, which may later be followed by the bearish wave y of (b) or (x).
USD JPY, “US Dollar vs Japanese Yen”
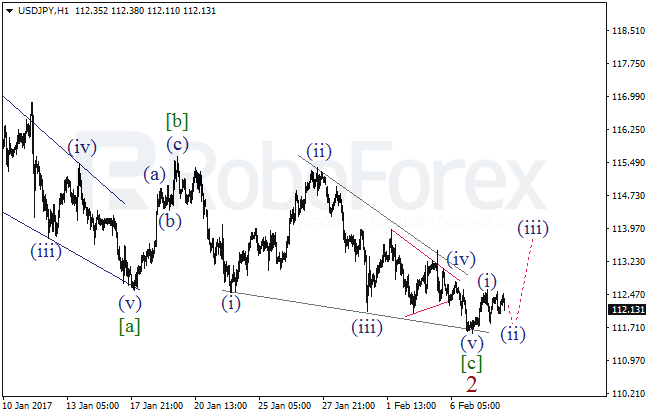
It’s highly likely that the USD/JPY pair completed the diagonal triangle in the wave [c] of 2, rebounded from the downside border of the pattern, and started forming the wave [i]. To confirm a new growth, the market has to finish the above-mentioned wave.
As we can see at the H1 chart, the pair completed the fifth wave in the wave [c] and then formed the bullish impulse in the wave (i). After finishing the local correction, the market may resume growing in the waver (iii) of [i].
AUD USD, “Australian Dollar vs US Dollar”
Probably, the AUD/USD pair completed the zigzag[ii], which is a part of the diagonal triangle in the wave 5. Consequently, in the nearest future the market may resume moving downwards.
At the H1 chart, after finishing the bullish impulse in the wave (c) of [ii], the pair started forming the wedge in the wave (i). As a result, on Wednesday the price may form the descending impulse in the wave v of (i) and then start another correction.
Attention! Forecasts presented in this section only reflect the author’s private opinion and should not be considered as guidance for trading. RoboForex LP bears no responsibility for trading results based on trading recommendations described in these analytical reviews.