Author Archive for InvestMacro – Page 593

How to Easily ID Support and Resistance on Your Charts

See an example in the chart of Bank of America (BAC)

By Elliott Wave International

You’ve probably heard the terms “support” and “resistance.” Common technical analysis terms, they are price points on a chart that can help determine when a move will pause, or even stop and reverse.

There are many different ways to identify support and resistance on your charts. In this 6-minute lesson, the editor of our Trader’s Classroom education service, Jeffrey Kennedy, shows you one of the easiest and most effective methods (example: Bank of America, NYSE: BAC).


6 Lessons to Help You Find Trading Opportunities in Any Market

Get 6 free lessons that will teach you how to spot trading opportunities in the charts you’re using every day Elliott Wave International’s Jeffrey Kennedy shows you how to use Elliott waves, Fibonacci analysis, candlestick analysis, and more, to help you become a more successful technical trader.

Get instant access

This article was syndicated by Elliott Wave International and was originally published under the headline How to Easily ID Support and Resistance on Your Charts. EWI is the world’s largest market forecasting firm. Its staff of full-time analysts led by Chartered Market Technician Robert Prechter provides 24-hour-a-day market analysis to institutional and private investors around the world.

Admiral Markets Offers European Single Share CFDs

Admiral Markets has recently expanded the range of instruments in Admiral.

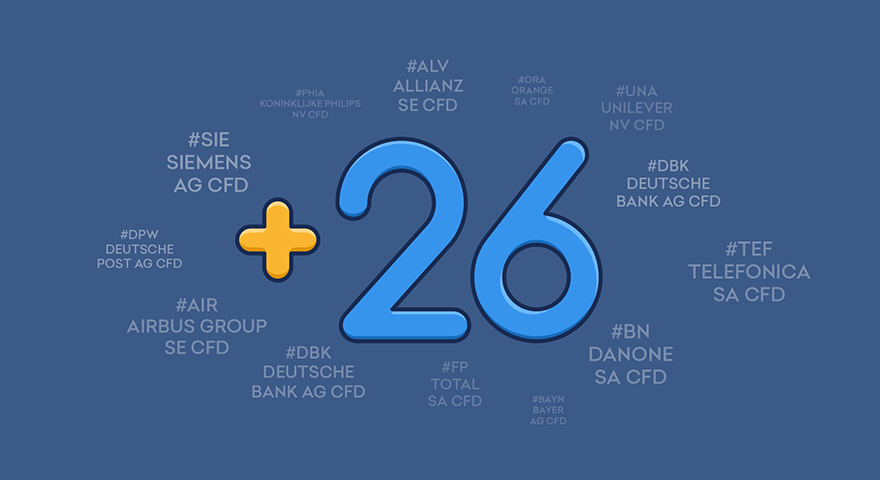
Markets account (1), by adding 26 new CFDs on the most actively traded European shares which constitute the Euro STOXX 50 index.

The offer includes:

  • New trading and investment opportunities with some of the most popular bluechips of the developed European countries.
  • The possibility to buy or sell share CFDs without any short sale restrictions.
  • The possibility to accurately manage portfolios with flexible contract sizes starting from 1 share CFD.
  • Dividend adjustments if a long CFD position is held, when the underlying share goes ex-dividend (2).
  • The opportunity to save more, with some of the lowest commissions on the market.

Key features:

  • Commission – 0.05% of the transaction’s notional value (3).
  • Minimum commission – 3 EUR per transaction.
  • Lot size, minimum contract size and increment – 1 share.
  • Maximum contract size – 10,000 lots.
  • Leverage – 1:10 (i.e. margin rate of 10%).
  • Tick size and minimum spread – 0.001 EUR.

List of new trading instruments (4):


MT4
Symbol
Description
#ABIAnheuser-Busch InBev SA/NV CFD
#ADKoninklijke Ahold Delhaize NV CFD
#AIRAirbus Group SE CFD
#ALVAllianz SE CFD
#BASBASF SE CFD
#BAYNBayer AG CFD
#BBVABanco Bilbao Vizcaya Argentaria SA CFD
#BMWBayerische Motoren Werke AG CFD
#BNDanone SA CFD
#BNPBNP Paribas SA CFD
#DAIDaimler AG CFD
#DBKDeutsche Bank AG CFD
#DPWDeutsche Post AG CFD
#DTEDeutsche Telekom AG CFD
#EOANE.ON SE CFD
#FPTOTAL SA CFD
#GLESociete Generale SA CFD
#INGAING Groep NV CFD
#ITXInditex SA CFD
#ORAOrange SA CFD
#PHIAKoninklijke Philips NV CFD
#SANSanofi SA CFD
#SAPSAP SE CFD
#SIESiemens AG CFD
#TEFTelefonica SA CFD
#UNAUnilever NV CFD


Please note that:

  1. New instruments are only available to  Admiral.Markets accounts on AM-Live2 trading server. Traders with Admiral.Markets (ex-Pro) accounts on the AM-Live1 and AM-Live3 servers can get access to new instruments by opening a new Admiral.Markets account and transferring funds internally via their Trader’s Room.
  2. Dividend adjustments are credited to accounts with long share CFD positions (Buy) and debited from accounts with short share CFD positions (Sell).
  3. Commission and minimum commission values are indicated per transaction (i.e. per side). Commission is charged in the full amount (i.e. per side value x 2) upon opening a share CFD position. Minimum commission is charged whenever the mathematical value of the commission is below the minimum level of 3 EUR.
  4. You may need to right-click on ‘Market Watch’ and select the ‘Show All’ option to display the new instruments in your MetaTrader 4 terminal.

For more information please visit Admiral Markets website.

Risk disclosure: Forex and CFDs carry a high level of risk and losses may exceed your initial deposit. Admiral Markets UK Ltd. recommends you seek advice from an independent financial advisor to ensure that you understand the risks involved with Forex, CFDs, Margin and Leveraged trading.


VIX Cycles set to explode in March/April 2017 – Part 2

By www.ActiveTradingPartners.com

VIX Cycles set to explode in March/April 2017 – Part 2

Previously, I authored a “Part 1” of this article regarding my analysis of the VIX cycles.  I sincerely hope my readers enjoyed the analysis and I hope it opened up a few questions regarding the potential moves in the US and global markets.  Today, we will delve deeper into the concept of the VIX cycle patterns that I’ve identified and use common technical analysis concepts to attempt to identify price target levels as well as support and resistance that may become important in the immediate future.

For those of you that missed “VIX Cycles set to explode in March/April 2017 – Part 1”, please click on this link to review my earlier analysis.  When you are ready, the rest of this article continues my analysis.

As we had been discussing in “Part 1”, my hypothesis that a 5 month VIX cycle pattern exists and has been driving market volatility since 2015 appears to be substantiated by historical chart evidence.  The other interesting facet of this 5 month pattern is that it appears to be quickening in relation to recent activity.  I stated earlier that I believe this pattern to be a 18~22 week cycle event, but more recent VIX chart activity shows the current range may be more like 16~20 weeks.  My understanding of cycles and patterns is that within extreme, potentially violently, volatile periods, price cycles may become more frequent and velocity may become more volatile.  An example of this can be found in my long-term US major market cycle analysis below.

This image maps a major market cycle rotation process that has been in place for over 60 years.  This image starts in the late 1970s and maps TOP and BOTTOM cycling events and well as potential early and late stage cycle ranges.  When the GREEN and YELLOW levels, near the top, move above the 80% range, this starts the “Topping cycle event”.  When both of these levels fall below the 80% range, this ends the “Topping cycle event”.  The opposite is true for the BLUE and RED levels.  When both of them fall below the 20% level, this starts a “Bottoming cycle event”.  When they both leave the 20% level, this ends the “Bottoming cycle event”.  Actual price tops and bottoms can, and often do, occur within these event ranges.

US Cycle Chart

TopBottom2

Price and event cycles have been in place for centuries and correlate with other traditional forms of technical analysis easily.  For example, Elliot Wave, Fibonacci, Price Channeling and Price Patterns all relate to cycles very well.  Within this article, I’m using Price Patterns as well as Fibonacci to attempt to project and identify key target, support and resistance levels based on my understanding of the proposed VIX cycles.

Recent price expansion from the lows at $868.47, January 2016, prompted a rally to $1194.60, on April 25, 2016.  This range, $326.13, represents an expansion cycle and a Fibonacci range that we can use to determine Fibonacci cycle frequency – which may help us determine future price objectives.  After this peak, price dropped 25% of this range (a common Fibonacci level that is correlated to a real Fib value of 0.272) equaling $81.53.  Because of this narrow retracement, we should expect a potential future price move equaling 1.272%, 1.618% or 1.768% of the existing range.  XOI rallied to $1259.56 on December 12, 2016 – equating the expected 1.272% price expansion we projected and setting up for a 0.768% total range retracement.

Let’s take a look at one example – OIL (XOI)

XOI_Weekly


Last week followers, subscribers and I got long 3x long energy fund – ERX.

call


In 24 hours we locked in a 7.7% partial profit, and are now sitting with 10+% gain on the balance. This special setup I call the Momentum Reversal Method (MRM) continues to be in play and we could experience another 20-35% gain from here.

What does all this technical stuff mean? After this bounce we should expect XOI to fall back to near $976.00 before attempting any further price moves.  All of this type of Fibonacci work is conducted by understanding how Fibonacci price relationships correlate to time/price/cycle frequency functions.  Many of the best analysts of the past had detailed understandings of how these correlations work and how price would react based on larger and longer term time/price/cycle events.

Stay Tuned For Gold & Silver Forecast Next – Part 3

And Join My Newsletter for Real-Time Trade Alerts!

www.ActiveTradingPartners.com


Psychology of smart and successful brokers

By Adinah Brown

About a decade ago, the Forex market was booming in such a way that opening up a brokerage required no more than a few thousand dollars and a little bit of skill. Fast forward a decade and the market has become over-saturated, incredibly competitive and with stricter regulatory guidelines, that make any forex business increasingly difficult to manage. This means that opening and managing a forex brokerage today requires skill. As it is true for any business, not everyone is cut out to be an entrepreneur. Some people prefer the stability of a job, while others, who are hungry and willing to start their own business, lack the ability and stamina required to do so.

According to the latest data released by the Small Business Administration, about a third of business fail during the first two years. In many cases it is due to lack of experience, but according to psychological studies, it is the skills and character of entrepreneurs that often determine the success or failure of a business.

What then, do successful entrepreneurs have in common, that the majority of people who never start a business don’t?

They are persuasive. Entrepreneurs are natural salespeople, whether they are selling a product, a service or an idea. They are charismatic and posses outstanding social and interpersonal skills, all required to convince others that their business, that their product, is the best and destined to success. They appreciate the value of forming relationships and will invest the necessary time and energy. They prioritize networking and when they speak to others, they inspire trust.

They don’t think of reasons why they might fail. They appreciate risk differently and have the self-confidence needed to be convinced that they will succeed. You’ll never come across an entrepreneur who thinks their business might not work. Ask 100 successful entrepreneurs if they think their business will succeed and you’ll get 100 yeses, all backed by what seem to be irrefutable reasons.

They don’t care about what other people think of them. They often do things that others think are crazy or disagree with, but they simply don’t care and move forward, like racehorses.

Successful entrepreneurs are jack-of-all-trades, they have to be.  While it is true that they often have a network of professionals they can call up for help or advice, they themselves are not specialists, but rather generalists who do whatever is required to get the business going. During the start-up phase in particular, they may find themselves going to meetings, buying office supplies, picking up the phone and managing every little detail of the business, because at the early stages of development, they have to be.

Successful entrepreneurs, those who are capable of taking a business past the initial stages and into stable territory (the eight-year mark as it is often referred to), are planners. They have good organizational skills and take risk responsibly. They may jump out of a plane, but they’ll check their parachute before taking the leap.

Do you have what it takes to start a forex brokerage in today’s market? Because not many do, this may be your best chance at hitting gold in a market that is changing and weeding out the weak to leave only the best ones standing.

About the Author:

Adinah Brown is a professional writer who has worked in a wide range of industry settings, including corporate industry, government and non-government organizations. Within many of these positions, Adinah has provided skilled marketing and advertising services and is currently the Content Manager at Leverate.


USD/JPY: Sell at 114.50

By GrowthAces.com

Macroeconomic overview

Japan’s economy grew at an annualised rate of 1.0% in October-December, posting a fourth straight quarter of expansion, led by solid exports and firmer capital expenditure. The preliminary reading for fourth-quarter GDP compared with the median estimate of 1.1% growth. It followed a revised 1.4% expansion in the prior quarter, the Cabinet Office data showed. On a quarter-on-quarter basis, GDP rose 0.2%, versus 0.3% growth expected by the market.

U.S. President Donald Trump did not discuss the currency or its strength at weekend talks with Japanese premier Shinzo Abe did likewise.

All eyes are fixed on testimony by Federal Reserve chief Janet Yellen this week after signs that other policymakers at the U.S. central bank are leaning towards more hikes in interest rates than the two currently priced in by markets. She is likely to reiterate the outlook for a few gradual hikes this year as the economy is close to the Fed’s goals. But the timing still depends on the data out in the next few months. We do not think that Yellen’s comments will support the USD.

Technical analysis

The USD/JPY corrective move extended through the cloud overnight to 114.16. We think that the USD/JPY move will be stopped in the area between two key resistance levels: 114.24 (38.2% fibo of December-February fall) and 114.52 (23.6% fibo of November-December rise).

USDJPY Daily Forex Signals Chart

Trading strategy

We have placed a sell order at 114.50, below an important resistance at 114.52. If our order is filled the target will be at 112.00, above February lows. Long-term outlook remains unchanged.


USD/CAD dropped on strong Canadian jobs report

Macroeconomic overview

Canada added 48.3k jobs last month, exceeding market expectations for employment growth to be unchanged.

Canadian Labor Market

Full-time positions increased by 15.8k. Although that was outpaced by a 32.4k increase in part-time work, investors were encouraged by the decline in the unemployment rate to 6.8%, even as the participation rate edged up.

The service sector added 42.6k jobs in January, with a 20.5k increase in the finance, insurance and real estate industry. Hiring in the transportation and warehousing, and business and support services sectors also rose.

The goods sector created just 5.6k jobs last month, with a 5.2k increase in construction. The natural resources sector added 2.5k positions.

Average hourly wages rose 1% from last January, but average weekly hours for permanent employees declined 0.6% as part-time workers saw fewer hours.

The CAD strengthened against the USD on Friday on rising oil prices and better-than-expected jobs data. Gains for the Canadian dollar came even as the greenback strengthened against a basket of major currencies.

Technical analysis

The overall structure remains bearish. The USD/CAD is still below the descending trendline. The rate is also back below 14-day exponential moving average after a short-lived corrective move in recent days.

USDCADDaily Forex Signals Chart

Trading strategy

We stay near-term and long-term bearish. The target of our positions is 1.2820.


TRADING STRATEGIES SUMMARY:

(Detailed trading strategies are available only for VIP subscribers)

About the Author:

By GrowthAces.com – Daily Forex Trading Strategies


Trumpin’ and Thumpin’ back to the 1930s

By Dan Steinbock

With the Trump White House, America and a global economy will enter a highly divisive period – as evidenced by the debate about his economic, trade and infrastructure plans.

As long as Republicans sustain some unity in and between the White House, the Senate and the House of the Representatives, Trump will benefit from an unprecedented execution power.

To get the economy back on track, Trump’s economic objective is to create 25 million new jobs in the next decade, return to 4% annual economic growth, lower and reform US tax codes. But truth to be told, the growth objective will be undermined by his own trade, tax and immigration policies.

To former President George W. Bush, American security meant that “either you are with us or against us.” US economy has the same significance to Trump – his trade policy is an extension of his domestic economic policy.

Trumping trade – and the Fed

The Trump administration’s “America First” mantra is predicated on a withdrawal from the Trans-Pacific Partnership (TPP) and a renegotiated North American Free Trade Agreement (NAFTA). If Canada and Mexico cannot see Trump eye to eye in the coming talks, the President will simply give notice of the US intent to withdraw from NAFTA.

The new White House intends to crack down all nations that violate trade agreements, as the Trump team sees it. Working together with his top trade executives – who are vehemently against free trade and tend to hold strong anti-China views– Trump has already targeted the biggest US deficit contributors, particularly China, Japan, Canada and Mexico.

The new White House’s trade initiatives have major consequences not just internationally, but for US domestic economy.

According to US Treasury data, major foreign holders of US treasury securities – China, Saudi Arabia and Russia – have reduced their holdings by almost $250 billion since last March. The effect of foreign selling of US treasuries looks like the kind of foreign liquidation that Washington has feared for years. It is also adding to the Fed’s challenges.

Here’s the dilemma: If Trump will trigger a $1 trillion debt tornado, which is required by his infrastructure program, when the Fed hopes to accelerate tightening with three new 25 basis points rate increases in 2017, he can no longer rely on the Fed to ease and thus to monetize the debt issuance.

Trump needs trade wars to keep US dollar lower than the Fed would like.

Impending circles of vicious nationalism

Nevertheless, as world trade and investment have plateaued, globalization has ground to a halt. As a result, the proposed Trump tariffs increase the potential of elevated global risks.

There is a historical precedent. In 1930, the US Congress passed the notorious Smoot-Hawley Tariff Act, which sharply raised the cost of foreign imports. While it seemed to work initially, it soon caused other nations to retaliate, which paved the way for the Great Depression and, eventually, for another world war. Such precedents should make us all cautious.

In the coming months, most Trump initiatives – including the administration’s proposed tax cuts, trade policy, manufacturing plans, infrastructure investment, stricter immigration, climate change reversals, balancing power games, military spending and so on – are likely to contribute directly or indirectly to elevated global risks.

The early signs suggest that the Trump administration will, at least initially, shun sober realism and walk the talk. And that, unfortunately, translates to a series of potential shocks to a world economy that can only bear so much.

About the Author:

Dan Steinbock is the founder of the Difference Group and has served as the research director at the India, China, and America Institute (USA) and a visiting fellow at the Shanghai Institutes for International Studies (China) and the EU Center (Singapore). For more, see http://www.differencegroup.net

The original, slightly shorter commentary was released by Shanghai Daily on February 7, 2017


Half of distributed ledger technology professionals forecast global post-trade blockchain adoption in between three to five years

Press Release:

Blockchain will become adopted in the financial post-trade area in three to five years, according to almost half (48%) of the membership base of the Post-Trade Distributed Ledger (PTDL) Group1. In addition, just over a quarter (29%) of members believe blockchain will become adopted in as little as the next one to two years, though 21% forecast it will take in excess of five years.

The survey of PTDL’s global membership found that the top three benefits of distributed ledger technology will be operational cost savings (cited by 81%), increased efficiency/ reduced settlement cycles (67%), and transparency (43%). In a reflection of the significance of the new technology, a fifth (20%) of respondents said that the strategic importance of blockchain within their own organisation was ‘very high’, with an additional 34% saying it was ‘high’; only 7% said it was a ‘low’ priority.

PTDL Group members are from all continents and include global banks, custodians, Central Securities Depositories, clearing houses, exchanges, regulators, government agencies and central banks.  The organisation brings together major post-trade industry participants to share information and ideas about how distributed ledger technologies can transform the post-trade landscape. Its organising committee is made up of representatives from CME Group, Euroclear, HSBC, London Stock Exchange Group and State Street.

Despite the compelling arguments for the adoption of blockchain, PTDL’s members warned that industry adoption remains the most significant barrier to implementing blockchain in a wider post trade industry context – this was cited by 78% of respondents. Regulation (56%), a clear business need (55%), concerns around confidentiality (51%), and lack of standardisation (49%) complete the top five in terms of impediments. Lack of available talent is seen as the least significant concern (23%).

Jörn Tobias, Managing Director at State Street and PTDL Group representative, said: “The survey shows that blockchain could become mainstream in just a couple of years, with benefits such as better transparency, shorter settlement cycles and cost savings clearly identified by our members. The big barrier to growth, however, is seen as caution: fears over adoption and hesitation about embracing what remains cutting-edge technology. This is a core focus for the PTDL Group – engaging with financial services firms, technology companies and other stakeholders and helping catalyse adoption across the world for the benefit of all parties the financial post-trade area.”


Ichimoku Cloud Analysis 13.02.2017 (GBP/USD, GOLD)

Article By RoboForex.com

GBP USD, “Great Britain Pound vs US Dollar”

GBP USD, Time Frame H4. Indicator signals: Tenkan-Sen and Kijun-Sen are still influenced by “Golden Cross” (1) and D “Golden Cross” (3). Ichimoku Cloud is going down (2), Chinkou Lagging Span is above the chart. Short-term forecast: we can expect resistance from D Tenkan-Sen and support from Kijun-Sen.

GBP USD, Time Frame H1. Indicator signals: Tenkan-Sen and Kijun-Sen intersected below Kumo Cloud and formed “Golden Cross” (1). Ichimoku Cloud is very narrow, but continues heading down (2), Chinkou Lagging Span is on the chart, and the price is on Tenkan-Sen inside Kumo. Short-term forecast: we can expect support from Tenkan-Sen, and attempts of the price to fix below the cloud.


XAU USD, “Gold vs US Dollar”

XAU USD, Time Frame H4. Indicator signals: Tenkan-Sen and Kijun-Sen intersected and formed “Dead Cross” (1); the lines are still influenced by D “Golden Cross”. Ichimoku Cloud is moving upwards (2), Chinkou Lagging Span is very close to the chart, and the price is on Tenkan-Sen. Short‑term forecast: we can expect resistance from Kijun-Sen and support from D Tenkan-Sen – Senkou Span A.


RoboForex Analytical Department

Article By RoboForex.com

Attention!
Forecasts presented in this section only reflect the author’s private opinion and should not be considered as guidance for trading. RoboForex LP bears no responsibility for trading results based on trading recommendations described in these analytical reviews.

Short-term trading idea FX GBP/CAD – a lowering game: breaking through trend line of correctional movement

By Gabriel Ojimadu, Alpari.com

Trading opportunities for currency pair: After the IEA report was published on Friday, Brent oil grew by 1.63%. As the quote per barrel surpasses 57.50 USD, Brent will open will a target of 61.25 USD. As oil recovers further still, the GBP/CAD cross will resume its downward movement.

Last week, the trend line of upwards movement from a minimum of 1.5736 was broken through. After a short correction breaking 1.62, the rate will continue to fall. The first target will be around 1.5944. If Brent prices surpass 60 USD, the GBP/CAD rate will head towards around 1.5944. The third target will be reachable as negative news concerning Brexit hits the airwaves.

Background:

The last idea concerning this pair was published on the 12th of December. At the time of publication, the British pound was worth 1.5617 Canadian dollars. An upwards correction from a low of 1.5887 resulted in a W-model. On the 7th of December, this correction broke the trend line. On the 9th of December, the basis for the W-model was complete. As per the downwards trend of the GBP/CAD pair, a fall to 1.6025 was expected. The second target stood at 1.5379.

The rate, in fact, fell to 1.5736. The rate when past the projected 1.6025 and stopped on the lower line of the A-A1 channel, which is located at 100% of the range of the A-A channel.

Current situation:

In every review, I write that the Canadian dollar is strongly tied to oil. Its sale adds a substantial portion of revenue to the state budget. On Friday, the IEA’s report caused Brent oil prices to rise by 2.25%, up to 56.84 USD a barrel.

According to the IEA, the output from OPEC countries fell by a million barrels to 32.06m barrels a day. Countries outside the cartel reduced their output by half a million barrels a day. In this regard, the agreement to reduce output has been 90% fulfilled.

The agency is expecting output in the USA, Canada and Brazil to increase by 750,000 barrels a day, and for the cumulative daily production of non-OPEC countries to increase by 400,000 barrels. The report indicated that the IEA has upgraded its forecast for global oil demand by 100,000 to 1.4m barrels a day.

Remember that on the 30th of November, in Vienna, OPEC members agreed to reduce their oil production by 1.2m barrels a day, to 32.5m. On the 10th of December, a meeting was held between OPEC members and other oil-producing countries. This resulted in an agreement between OPEC and 11 other countries to reduce output. The decision was taken to reduce output by 558,000 barrels a day, starting from the 1st of January 2017. The Russian government agreed to facilitate half of this reduction.

On the back of a rise in oil quotes, the GBP/CAD rate fell to 1.6365. Since mid-December last year, oil has been trading sideways above 53.50 USD. After the publication of Friday’s report, Brent prices could reach a new maximum for the year. When quotes rise further, the GBP/CAD rate will renew its downward movement.

Last week, the trend line of upwards movement from a low of 1.5736 was broken through. The Canadian dollar strengthened against the pound three times as the trend line was broken. This week, traders must close at around the 1.62 mark. After a short correction and a breakthrough of 1.62, the pair will continue its fall. The first target will be around 1.5944. If Brent rises above 60 USD, then the GBP/CAD rate will move towards 1.5664. The third target will become achievable as negative news about Brexit comes in.


Source: Short-term trading idea FX GBP/CAD – a lowering game: breaking through trend line of correctional movement


Forex Technical Analysis & Forecast 13.02.2017 (EUR/USD, GBP/USD, USD/CHF, USD/JPY, AUD/USD, USD/RUB, GOLD, BRENT)

Article By RoboForex.com

EUR USD, “Euro vs US Dollar”

The EUR/USD pair is growing towards 1.0660. Later, in our opinion, the market may fall to reach 1.0604 and then move upwards with the target at 1.0660. In fact, the price is forming a wide consolidation range. The next downside target is at 1.0554.


GBP USD, “Great Britain Pound vs US Dollar”

The GBP/USD pair is forming another consolidation range. If later the instrument breaks the range upwards, the market may continue growing and reach 1.2700; if downwards – fall with the target at 1.2345.


USD CHF, “US Dollar vs Swiss Franc”

The USD/CHF pair continues growing inside the uptrend. Possibly, today the price may be corrected to reach 0.9998 and then grow towards 1.0067. Later, in our opinion, the market may start another decline with the target at 0.9998.


USD JPY, “US Dollar vs Japanese Yen”

The USD/JPY pair is falling towards 112.81. After reaching it, the instrument may move upwards with the target at 114.16 and form another consolidation range. If later the market breaks the range upwards, the market may continue growing and reach 115.30; if downwards – fall with the target at 112.00.


AUD USD, “Australian Dollar vs US Dollar”

Being under pressure, the AUD/USD pair is moving upwards. Possibly, the price may reach 0.7700. After that, the instrument may fall with the target at 0.7600 or even deeper, at 0.7500.


USD RUB, “US Dollar vs Russian Ruble”

The USD/RUB pair has completed another descending structure. Possibly, today the price may form another consolidation range. Later, in our opinion, the market may break this range to the upside and start another correction with the target at 59.50.


XAU USD, “Gold vs US Dollar”

Gold is forming the first descending impulse. Possibly, today the price may reach 1220. Later, in our opinion, the market may grow towards 1233 and then, after breaking the low, continue falling with the target at 1185.


BRENT

Brent has completed another ascending structure. Possibly, today the price may fall to reach 55.66. If later the instrument breaks the range upwards, the market may continue growing and reach 59.90; if downwards – fall with the target at 54.40.


RoboForex Analytical Department
Article By RoboForex.com

Attention!
Forecasts presented in this section only reflect the author’s private opinion and should not be considered as guidance for trading. RoboForex LP bears no responsibility for trading results based on trading recommendations described in these analytical reviews.