On Wednesday, trading on the euro closed up. After the release of statistics in the US, the euro fell to 1.0521. The first set of released figures was excellent news for the dollar. Inflation and retail sales exceeded expectations and US 10-year bond yields reached 2.5238%.
The index for industrial production was released later in the day, which had a negative value, to everyone’s surprise. In addition, the figure for the previous month was downgraded, 10-year bond yields reversed downwards and the EUR/USD rate restored to 1.0609.
US statistics:
The NY Empire State Manufacturing Index for February came out at 18.7 (forecasted: 7.5, previous figure: 6.5).
The index for retail sales for January came out at 0.4% (forecasted: 0.2%, previous figure: 1.0%).
The index for non-auto retail sales for January was 0.8% (forecasted: 0.4%, previous figure: 0.4%).
The Consumer Price Index for January was 0.6% (forecasted: 0.3%, previous figure: 0.3%). The Consumer Price Index for January excluding food and energy came to 0.3% (forecasted: 0.2%, previous figure: 0.2%).
The index for industrial production fell to -0.3% (forecasted: 0.1%, the previous figure was downgraded from 0.8% to 0.6%).
Market expectations:
The euro is continuing to strengthen in Asia. On the hourly timeframe, buyers have broken through the trend line. The EUR/USD rate rose to 1.0623. Then, the dollar started to undergo a correctional phase. The immediate target is 1.0650. For Thursday, there’s nothing important expected in the news. Traders will be basing their decisions on the dynamics of US bond yields, which are down by 0.66% at the moment.
Day’s news (GMT+3):
16:30 USA: building permits (Jan), Philadelphia Fed manufacturing survey (Feb), jobless claims (3-10 Feb), housing starts (Jan);
17:00 Eurozone: ECB board member Benoît Cœuré’s speech;
18:30 USA: EIA natural gas storage change (Feb 10).
For the most part, my predictions for yesterday came off. The strong US statistics knocked the projected minimum from 1.0555 down to 1.0521, but after the release of the disappointing manufacturing statistics, the dollar began a downwards correction.
As US bond yields slid, the EUR/USD rate restored to the trend line. It also came out of the Asian market in good shape. At the time of writing, the euro is trading at 1.0621. Growth slowed around the 90th degree at 1.0624. The 90th degree isn’t so important for the euro, but the rate often rebounds from it. According to my forecast, I’m expecting some correctional movement to 1.0607 followed by growth up to the 112thdegree at 1.0650. The Fibonacci ratio is located at 1.0640, calculated from a drop from 1.0714 to 1.0521.
As we can see, the 1.0640-1.0650 range is acting as a strong support, from which euro sales can restore. Keep an eye on US 10-year bonds, which are trading above the trend line. Eurobulls will be hoping for yields to fall below 2.4770%. If 10-year bonds rebound from the line, we can expect to see the euro correct to 1.0600.
U.S. retail sales rose more than expected in January and consumer prices recorded their biggest gain in nearly four years, boosting prospects of an interest rate increase from the Federal Reserve next month.
The Commerce Department said retail sales increased 0.4% last month, buoyed by purchases of electronics and appliances. Households also spent more on dining out, sporting goods and hobbies. December’s sales were revised up to show a 1.0% rise instead of the previously reported 0.6% advance.
Excluding automobiles, gasoline, building materials and food services, retail sales increased 0.4% after a similar gain in December. The market had forecast a rise in so-called core retail sales by 0.1%.
In a separate report, the Labor Department said its CPI jumped 0.6% last month as households paid more for gasoline, new motor vehicles, airline fares and clothing. It was the largest increase since February 2013 and followed a 0.3% gain in December.
In the 12 months through January, the CPI increased 2.5%, the biggest year-on-year gain since March 2012. The CPI rose 2.1% in the year to December. Inflation is trending higher as prices for energy goods and other commodities rebound in response to a pick-up in global demand.
The so-called core CPI, which strips out food and energy costs, rose 0.3% last month after increasing 0.2% in December. That lifted the year-on-year core CPI increase to 2.3% in January from December’s 2.2% rise.
A third report from the Fed showed manufacturing production increased 0.2% in January after a similar rise in December. Output at mines shot up 2.8%, with oil and gas well drilling increasing further.
While the reports on Wednesday suggested the economy regained momentum early in the first quarter, rising inflation means households have less spending power. Average hourly earnings adjusted for inflation fell 0.5% in January and were unchanged from a year ago. Retail sales seemed to have been boosted by higher prices rather than an increase in the real consumption.
Testifying before lawmakers on Wednesday, Yellen reiterated that it would be “unwise” for the U.S. central bank to wait too long to raise interest rates.
Technical analysis
The dollar pulled back on Thursday after rising to one-month highs. Yesterday’s rejection of further downward move is an important short-term bullish signal. The EUR/USD is now at 7-day exponential moving average. A close above this average will be another sign of EUR/USD recovery.
Trading strategy
We opened a long EUR/USD position at 1.0600 in our yesterday’s Trading Strategies Summary as technical analysis showed a clear buy signal. We set the target slightly below February’s highs. The stop-loss on this position is below yesterday’s low.
AUD/USD: 0.7700 eventually broken
Macroeconomic overview
Australia’s seasonally adjusted unemployment rate fell to 5.7% in January of 2017 from 5.8% in December while markets expected 5.8%. The labor force participation rate dropped slightly while the number of unemployed decreased by 19.3k.
In January, the seasonally adjusted labour force participation rate came in at 64.6%, compared to 64.7% in the prior month and slightly less than estimates of 64.7%.
Employment increased by 13.5k, higher than markets consensus of 10k. Full-time employment decreased 44.8k and part-time employment increased by 58.3k.
Technical analysis
The AUD/USD eventually broke above the key resistance at 0.7700. It briefly popped to a three-month high of 0.7732 after data showed a surprise dip in Australia’s unemployment rate. The next resistance is November’s peak at 0.7777. The AUD/USD remains above 14-day exponential moving average, which is positively aligned. RSIs are biased up with a room to run. That is why we think the upward move will be continued.
Trading strategy
Our long positions are very close to their target, after the pair broke above the resistance at 0.7700. Our short-term trade is risk free now and we have locked profit on long-term position to 0.7590.
TRADING STRATEGIES SUMMARY:
FOREX – MAJOR PAIRS:
FOREX – MAJOR CROSSES:
PRECIOUS METALS:
It is usually reasonable to divide your portfolio into two parts: the core investment part and the satellite speculative part. The core part is the one you would want to make profit with in the long term thanks to the long-term trend in price changes. Such an approach is a clear investment as you are bound to keep your position opened for a considerable amount of time in order to realize the profit. The speculative part is quite the contrary. You would open a speculative position with short-term gains in your mind and with the awareness that even though potentially more profitable than investments, speculation is also way more risky. In typical circumstances investments should account for 60-90% of your portfolio, the rest being speculative positions. This way, you may enjoy a possibly higher rate of return than in the case of putting all of your money into investment positions and at the same time you may not have to be afraid of severe losses in the short-term.
How to read these tables?
1.Support/Resistance – three closest important support/resistance levels 2. Position/Trading Idea: BUY/SELL – It means we are looking to open LONG/SHORT position at the Entry Price. If the order is filled we will set the suggested Target and Stop-loss level. LONG/SHORT – It means we have already taken this position at the Entry Price and expect the rate to go up/down to the Target level. 3. Stop-Loss/Profit Locked In – Sometimes we move the stop-loss level above (in case of LONG) or below (in case of SHORT) the Entry price. This means that we have locked in profit on this position. 4. Risk Factor – green “*” means high level of confidence (low level of uncertainty), grey “**” means medium level of confidence, red “***” means low level of confidence (high level of uncertainty) 5. Position Size (forex)– position size suggested for a USD 10,000 trading account in mini lots. You can calculate your position size as follows: (your account size in USD / USD 10,000) * (our position size). You should always round the result down. For example, if the result was 2.671, your position size should be 2 mini lots. This would be a great tool for your risk management! Position size (precious metals) – position size suggested for a USD 10,000 trading account in units. You can calculate your position size as follows: (your account size in USD / USD 10,000) * (our position size). 6. Profit/Loss on recently closed position(forex) – is the amount of pips we have earned/lost on recently closed position. The amount in USD is calculated on the assumption of suggested position size for USD 10,000 trading account. Profit/Loss on recently closed position (precious metals) – is profit/loss we have earned/lost per unit on recently closed position. The amount in USD is calculated on the assumption of suggested position size for USD 10,000 trading account.
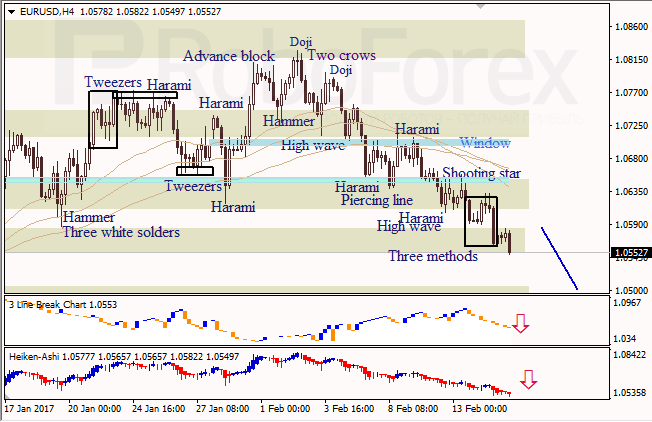
At the H4 chart of EUR USD, bearish Three Methods continuation pattern indicates a descending movement. Three Line Break chart and Heiken Ashi candlesticks confirm a bearish direction.
At the H1 chart of EUR USD, the bearish tendency continues. The downside Window may provide support. Three Line Break chart and Heiken Ashi candlesticks confirm that the descending movement continues.
USD JPY, “US Dollar vs. Japanese Yen”
The H4 chart of USD JPY shows a bullish tendency. The upside Window is a resistance level. There are no reversal patterns. Three Line Break chart and Heiken Ashi candlesticks confirm a bullish direction.
Attention! Forecasts presented in this section only reflect the author’s private opinion and should not be considered as guidance for trading. RoboForex LP bears no responsibility for trading results based on trading recommendations described in these analytical reviews.
The EUR/USD pair continues forming its descending wave; in fact, it’s the third wave inside the downtrend with the local target at 1.0550. Possibly, today the price may be corrected towards 1.0595. Later, in our opinion, the market may continue falling to reach 1.0550.
GBP USD, “Great Britain Pound vs US Dollar”
Being under pressure, the GBP/USD pair is moving downwards. Possibly, the price may fall towards 1.2433 and then grow to reach 1.2500. This structure may be considered as a consolidation range. If later the instrument breaks the range upwards, the market may continue growing and reach 1.2800; if downwards – fall with the target at 1.2344.
USD CHF, “US Dollar vs Swiss Franc”
Being under pressure, the USD/CHF pair is moving upwards. The instrument is expected to form the third wave inside the uptrend with the local target at 1.0132. Possibly, today the price may test 1.0043 from above and then continue growing towards the above-mentioned target.
USD JPY, “US Dollar vs Japanese Yen”
The USD/JPY pair has broken its consolidation range upwards. Possibly, today the price may continue growing towards 115.30. Later, in our opinion, the market may fall with target at 113.40.
AUD USD, “Australian Dollar vs US Dollar”
The AUD/USD pair has completed the descending impulse and right now is being corrected with the target at 0.7680. is moving upwards. After that, the instrument may continue falling inside the downtrend with the target at 0.7500.
USD RUB, “US Dollar vs Russian Ruble”
The USD/RUB pair is moving downwards. Possibly, the price may extend this wave up to 56.16. Later, in our opinion, the market may be corrected towards 58.00 to test it from below and then continue falling with the target at 55.85.
XAU USD, “Gold vs US Dollar”
Gold has completed the correction and right now is trading to the downside. Possibly, today the price may reach 1211. After that, the instrument may start consolidating, break the range downwards, and fall to reach the local target at 1192.
BRENT
Brent is forming another descending structure to reach 55.37. Later, in our opinion, the market may grow towards 56.24 and then start another decline to reach the local target at 54.00.
Attention! Forecasts presented in this section only reflect the author’s private opinion and should not be considered as guidance for trading. RoboForex LP bears no responsibility for trading results based on trading recommendations described in these analytical reviews.
On Tuesday, the euro once again closed down against the dollar. The single currency depreciated against the US dollar after Fed Chair Janet Yellen addressed Congress. She announced that the central bank may decide to raise interest rates in one of the forthcoming meetings. She gave no indication, however, of when exactly this might happen.
US 10-year bond yields surged by 2.5% to 2.5031%. For bonds, this is a huge amount to grow in the space of an hour. Following this surge, the EUR/USD rate fell to 1.0561.
Market expectations:
On the daily timeframe, buyers broke through the 1.0580 support. In doing this, they’ve paved the way to a further drop to 1.0457 as the current political climate in Europe will push the rate further in this direction. If you look at the intraday price dynamics over the past few days, cyclical analysis shows the euro always rises after depreciating during the US session.
The situation is basically as follows: as European markets open, the rate will fall to 1.0555, then in the US, we’ll see growth to 1.0602 (lb). If we see immediate growth as European markets open, we can expect to see price movements in the same pattern as the last couple of days.
16:30 USA: Consumer Price Index (Jan), Consumer Price Index Core (Jan), retail sales (Jan), retail sales control group (Jan), NY Empire State Manufacturing Index (Feb);
17:15 USA: capacity utilisation (Jan), industrial production (Jan);
17:30 UK: CB Leading Economic Index (Jan);
18:00 USA: Fed’s Yellen speech, NAHB Housing Market Index (Feb);
On Tuesday, for the second time in a row, the euro rate strayed from the trend line as Yellen gave her speech. I didn’t account for her speech in yesterday’s forecast because I’m not particularly familiar with her discourse. She promised that the Fed would raise interest rates in one of the forthcoming meetings. So, this will be either in March or June.
Her speech today shouldn’t have much influence on the currency market. According to my forecast, I’m expecting the pair to correct towards the trend line and the Lb line, reaching a new minimum in the process. A new minimum is needed so that between the AO and the price change over a few hours, a bullish divergence will form. In this case, from 90 degrees, one can risk betting against the trend with a target of 1.0600. The euro has closed down four days in a row, so there’s a chance of a strong rebound. The only thing I would add is that you shouldn’t increase your risk in going against the trend. You should only do so according to the reliable signals, should they appear.
If the euro begins to strengthen as markets open in Europe, then once it reaches 1.0595, the rate’s decline will recommence. Don’t forget that the buyers’ share of the market is 74%, and this number is showing no signs of dropping. Keep an eye on US bond yields, this should take priority over technical signals. I put the likelihood of my forecast coming off at 65%. Happy trading!
Valentine’s Day Special > Joe Lowry + Lithium = True Love Forever?
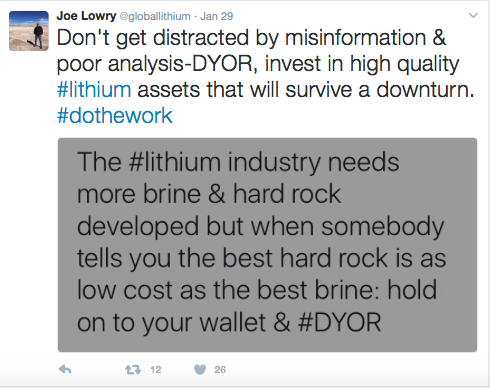
This is my 4th interview of Joe Lowry, aka “Mr. Lithium,” the first was in June 2015, the 2nd, January 2016, the 3rd March 2016. In the past several years, Mr. Lithium’s prominence has grown tremendously through his contributions on Linked-In and Twitter. That’s on top of his world renowned role as one of the most sought after consultants in the lithium industry. While his clients get 110% of Joe’s best insights, ideas, commentary and analysis– (in real time), readers of this interview are about to receive something thought to be impossible– a free lunch. One of the key takeaways from following Joe’s work is his frequent warnings that retail investors need to,”do the work.” Much of what one reads about lithium juniors can be filed under the category, “Fake News.” –DYOR. Caveat Emptor, etc.
When one needs to know the state of the world, one can turn to Trump’s twitter feed. For the latest and greatest assessment of the lithium sector/market/industry/players– it’s here and here….
Joe will be the first to tell you he’s not the only expert. We agree that Simon Moores of Benchmark Mineral Intelligence and Chris Berry, Editor of the Disruptive Discoveries journal are very valuable resources as well. In addition to lithium, they cover other green-high tech/energy metals including cobalt, graphite, vanadium & rare earths. This interview is entirely about lithium.
Joe, you continue to be one of the top Li market experts, can you comment on what you’ve gotten right (and wrong) over the past few years?
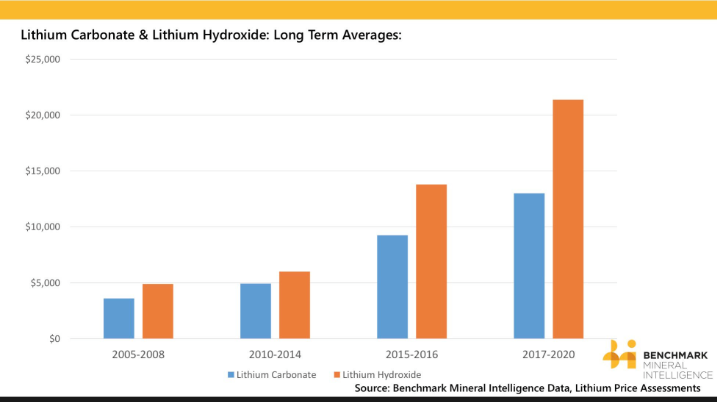
You don’t have to go beyond the price question to see what I’ve gotten right and wrong. In the summer of 2014 I did the keynote talk at the Qinghai Green Energy Festival in Qinghai Province China and said, quite correctly, that hydroxide prices would spike, “in the next couple years” driven by the growth of nickel based cathode. Unfortunately, I also said, incorrectly, that there was, “no reason for carbonate prices to increase more than the rate of GDP for the next few years.”
Why did I get hydroxide right and carbonate wrong? Hydroxide was simple supply/demand analysis. But with carbonate, while I didn’t think Rockwood (now part of Albemarle Corp. (NYSE: ALB) [“ALB”]), Orocobre Ltd. (“ORE”) and RB Energy, Inc. would be on time with new capacity, I didn’t expect the extreme under-performance that resulted in a market shortage that continues to this day. NOTE: {RB Energy failed in 4th qtr 2014 due to lack of funding}.
On February 2nd, Simon Moores of Benchmark Mineral Intelligence tweeted this pricing data. What are your thoughts on this topic?
Large lithium consumers have complained for years about the opaque nature of the lithium industry. Pricing has been hard to understand and plan for. In the past, Roskill and Industrial Minerals tried to provide price information, but they simply didn’t do a very good job. Simon and his team are taking on the challenge of putting together a pricing benchmark that can be used for contracts. I like what they’re doing, and I’m fully supportive. NOTE: {Joe Lowry has no financial interest in BMI}. Since I’m still active in the market trading product, I have a unique window into actual pricing, especially on the high end which is where I participate.
Given considerable lead times, isn’t the list of new projects and operating expansions coming online in 2017 – 2021 fairly well known? Could projects be added to the pipeline?
No, I don’t think so. Look at what people expected in 2014 to come online in 2015 – ALB’s La Negra 2, ORE and RB Energy. What happened? Of approximately 60k metric tonnes (“mt”) of expected production, less than 15k mt has materialized so far. Execution is everything. Knowing the “plan” and knowing the “result” are two different things. Nothing will be added to the current pipeline that will produce before 2021.
The number of undeveloped world class brine projects is less than the fingers on one hand. Regarding developed projects, La Negra 2 will ultimately operate, ORE probably won’t hit capacity, but will increase marginally in 2017 over 2016.
The next world-class project is the Sociedad Química y Minera de Chile S.A [NYSE: SQM)(“SQM”)/Lithium Americas’ (“LAC”) Cauchari project. [Minera Exar SA – Cauchari-Olaroz]
SQM is the world’s best brine operator, certainly better than ALB, and there’s no comparison with ORE. I’m confident SQM/LAC will bring phase 1 of Cauchari online by 2020 (they will say 2019 and I hope they are correct).
Ramp up to the full 25k mt and start of phase 2 will likely follow within 18 months. Galaxy at Sal de Vida is a bit more of a challenge to call. Cash flow from Mt Cattlin and a recent capital raise should enable them to start advancing the project in 2017. So, in the next five years brine projects and expansions will get developed, but probably not at a sufficient rate to meet market growth. As far as I’m concerned, the rest of the lot in Argentina is still too speculative to consider in a 5-6 year time horizon. Enirgi, Eramet, Lithium Xet al.
At times you question the research, analysis / commentary from peers. What might they be missing in their assessments of key metrics like supply, demand & pricing?
I’m not a research analyst. I have a narrowly defined area of expertise that my clients, as well as Twitter and Linked-In followers, seem to appreciate. The banks who publish, “research” on lithium aren’t my peers in the traditional sense of the word.
I sometimes criticize poor quality research by banks and others without holding back too much. I don’t have the resources of a Macquarie, but in the lithium area I may have forgotten more than they seem to collectively know. What many of the big banks don’t do is, “the work.” Taking a company’s press release or presentation at face value, perhaps calling one or two contacts at a lithium producer or battery company, writing down what they say and calling it research is nonsense. Over time, as lithium becomes more prominent, I believe research will improve. That said, I think Deutsche Bank has done some good work, so there are points of light out there. I do have clients ask me about who they should pay attention to.
There’s been a lot of buzz around a keynote presentation by Lithium Americas’ David Deak on January 25th. Do you have view on what Deak is saying about Li demand?
Yes, I know David’s thesis, in fact I was at that same conference in Toronto and conducted an (unrelated) Q&A session at the lunch break. He believes we will need 20x the current annual supply of lithium to electrify the world’s transportation fleet. A key quote from his talk…. “Almost 100 Giga-factories, [defined as a 100 GWh/yr facility] operating for 20 years each, are needed to electrify the world’s fleet of vehicles, and enable segments of the energy storage market.” This is inline with what Elon Musk has said. David’s analysis is straightforward and thought provoking. NOTE: {On January 26th, Joe tweeted, “Dr. D makes me look like an abject pessimist. That said, I am coming around.“}
Do Orocobre’s operating and quality problems portend challenges for Argentina’s next wave of brine producers?
Not at all. Orocobre made rookie mistakes across the board – ponds, process, etc. Their failure to execute says nothing about the quality of Argentina’s resources or the operating environment. ORE had the misfortune to start the project under the former government which, to be fair, was also an issue. On balance though, ORE had the best entry opportunity in the history of lithium – market shortage, rising pricing, etc. If they had executed in a similar fashion ten years ago, they would already be bankrupt.
Please explain China’s growing role in the global Li market.
China is the world’s largest lithium consumer overall and largest producer of cathode materials for lithium ion batteries. I don’t expect that to change in the coming five years. More importantly, China’s hard rock converters have kept the market in balance via processing spodumene concentrate from Australia. China now has two major lithium companies – Ganfeng and Tianqi. Both have resource assets outside of China and are rapidly transitioning from regional to global players.
You’ve been vocal about the importance of Argentinean brines and the likelihood of investment and market consolidation. What are your latest views?
By 2021 you will have four significant lithium operations in Argentina vs two in Chile. Minera Exar SA (SQM/LAC’s JV), and Galaxy will join FMC Corp (NYSE: FMC) and Orocobre. Ganfeng now owns ~20% of LAC so we have an emerging alliance with SQM/Ganfeng/LAC being formed. The big question mark is what Luke Kissam does with his cash hoard and stated ambition to grow ALB’s lithium business. ORE and Galaxy seem like takeout candidates, but both are probably too expensive to make sense for ALB. ORE requires a major investment to produce a high percentage of world class product.
Many Li juniors are planning to deploy largely untested (at commercial scale) direct brine extraction technologies. What are you hearing lately about these technologies?
Some of these technologies have been around for years. At some point I expect one or more will be implemented at scale, but the benefits are still unknown. I’m agnostic at this point and certainly think investors have better options than a project that depends on new technology.
You made some great calls and provided insightful analysis last year, what was the biggest surprise of 2016?
Albemarle’s approach to the business continues to mystify me. From my perspective the deal with Chile was too one-sided in a negative way for ALB shareholders. ALB’s pricing is well below their major competitors for no real long-term benefit in a market that will be tight for an extended period.
What are the top 1 or 2 misconceptions investors have in gauging the prospects of Li junior companies?
#1 – most hard rock investors seem not to understand that mining is the easy part of a hard rock project. Even in the production of spodumene concentrate, chemistry is critical.
#2 – despite a great long-term demand trend in lithium, the world doesn’t need 20 “lithium” companies, let alone the dozens we now have. I don’t give investment advice but I can only think of five juniors that are viable even for speculative capital.
Joe, thank you, as always, for sharing your latest views on the lithium industry. 2017 is likely to be a very interesting year.
British consumer prices rose 1.8% yoy, slightly below expectations for a 1.9% rise. The Bank of England forecast earlier this month that inflation will rise above 2.7% in around a year’s time as Britain’s vote to leave the European Union pushes up the cost of imports. Excluding oil prices and other volatile components such as food, core consumer price inflation held steady at 1.6%, confounding market expectations for a rise to 1.8%. Retail price inflation also rose to its highest since June 2014 at 2.6%.
Data on factory gate prices underscored the inflationary pressures in the pipeline. Output prices rose 3.5% yoy, the biggest increase since January 2012. Prices paid by factories for fuel and materials rose at an annual rate of 20.5% in January, the sharpest rise since September 2008.
The pound’s fall – it is down about 17% against the USD and 11% against the EUR since the June 2016 referendum – is starting to hit the spending power of consumers, who have helped the British economy to grow since the vote.
Last week BoE rate-setter Kristin Forbes said she was beginning to become uncomfortable with the central bank’s commitment to a neutral policy stance, arguing instead that interest rates could need to rise soon if price pressures continue to build.
The Office for National Statistics also released figures for December house prices, which showed an 7.2% annual rise across the UK as a whole compared with a 6.1% increase in November.
The GBP/USD fell back below 1.2500 after inflation data for January came in below forecast, adding to a handful of worse-than-expected economic numbers over the past couple of weeks.
Brexit minister David Davis says the government is on course to meet its end-March deadline to launch the formal divorce procedure from the European Union but he does not expect it to happen at a March 9 EU summit.
Fed Chair Janet Yellen’s testimony will be the main event today. In her testimony before the US Congress, Yellen will likely reaffirm her prudent stance. She is likely to reiterate the outlook for a few gradual hikes this year as the economy is close to the Fed’s goals. But the timing still depends on the data out in the next few months.
This will probably limit the impact of the new round of US data releases, including CPI (today) and retail sales data, as markets will conclude that even strong numbers will not trigger a Fed response. We expect the next move will occur only in June.
Technical analysis
The short-term outlook is slightly bullish. The GBP/USD remains above the Ichi cloud top (1.2441) and 100-dma (1.2430), which suggest that the bias stays with the bulls. The resistance is at last week’s 1.2582 peak, then 1.2621 (76.4% fibo of February fall).
Trading strategy
We got long today at 1.2460 for 1.2700.
AUD/USD long in good shape after positive data
Macroeconomic overview
Australian business conditions jumped to their highest in nearly a decade in January as firms reported a pick up in sales while profits steadied, pointing to solid economic growth after a soft patch late last year.
National Australia Bank’s monthly survey of more than 400 firms showed its index of business conditions jumped 6 points to +16 in January. That took it back to the highs seen in mid-2007 and well above the long run average of +5.
The survey’s measure of business confidence also climbed 4 points to +10 in January.
Its index of sales doubled to +22 for the month, while the measure of profits was steady at +12. A healthy 5 point rise in employment to its highest since 2011 seemed to bode well for the generally tardy labour market.
Cost price measures in the survey also lifted notably, suggesting a build up in wage pressures, although retail price inflation remained very subdued.
The Reserve Bank of Australia held rates steady this month and painted an optimistic picture for the next couple of years, predicting solid economic growth, further expansion in resource exports and a welcome pick-up in inflation.
The AUD/USD nudged higher after a business conditions indicator jumped to near decade highs but the currency struggled at 0.7700, which is proving to be a crucial barrier.
Technical analysis
AUD/USD outlook is clearly bullish – the rate remains above 14-day exponential moving average, which is positively aligned. However, the 0.7700 has been too strong barrier so far. We think that the next attempt to break above 0.7700 will be successful.
Trading strategy
We stay long are getting closer to our short- and long-term target at 0.7750.
The AUD/USD pair is getting more expensive on Tuesday after Australia and China published their statistical reports.
On Tuesday afternoon, the Australian Dollar is growing against the USD. The current quote for the instrument is 0.7677.
The statistics from Australia published this morning showed that the NAB Business Confidence in January increased up to 10 points after being 6 points in the previous month. However, the comments from the NAB say that one should treat this report very carefully, because the growth is probably influenced by the seasonal factor. One of the “thinnest” points of the indicator is a weak tendency in the household spending – it looks like there are some reasons why the consumption size and rate might be decreasing in the future.
Also, some of the market’s attention in the morning was attracted by the statistics from China. The Chinese Inflation Rate in January added 2.5% y/y although it was predicted to increase by 2.4% y/y. On MoM, the indicator expanded by 1.0%, which is much better that the December reading of 0.2%. The Producer Price Index in its turn added 6.9% y/y against expectations of 6.3% y/y.
The inflation is one of the most important macroeconomic indicators, which are used to analyze the country’s economy. China doesn’t publish a lot of statistical reports and they are usually overdue, that’s why up-to-date inflationary readings may look quite informative. On the one hand, the January growth of the inflation in the country has a seasonal explanation: normally, prices grow before the celebration of the Lunar New Year. However, the February reports on the Chinese CPI will be very interesting to see: if the inflation tends to grow quickly, one can expect the country’s Central Bank to tighten fiscal terms.
As usual, the strong statistics from China supports the Aussie.
Attention! Forecasts presented in this section only reflect the author’s private opinion and should not be considered as guidance for trading. RoboForex LP bears no responsibility for trading results based on trading recommendations described in these analytical reviews.
After finishing the zigzag in the wave 2, the EUR/USD pair resumed moving downwards. Possibly, at the moment the price is forming the descending extension in the wave [iii]. In this case, in the nearest future the market may continue falling and break the low of the wave 1.
More detailed structure is shown on the H1 chart. After finishing the wave [ii], the pair completed the descending impulse in the wave (i) and the correctional wave (ii). As a result, on Tuesday, the market may continue moving downwards while forming the extended wave (iii) of [iii].
GBP USD, “Great Britain Pound vs US Dollar”
In case of the GBP/USD pair, the chart structure is still rather complicated. After finishing the wave [iii], the price started another correction and completed the ascending zigzag, which may be the wave (a) or (w). Consequently, in the future the pair may continue forming the wave (b) or (x), which is taking the form of the double zigzag.
As we can see at the H1 chart, the pair is probably forming the zigzag in the wave y. Earlier, the price completed the ascending zigzag in the wave x. As a result, during the next several days the market may start a short-term decline towards the local low.
USD JPY, “US Dollar vs Japanese Yen”
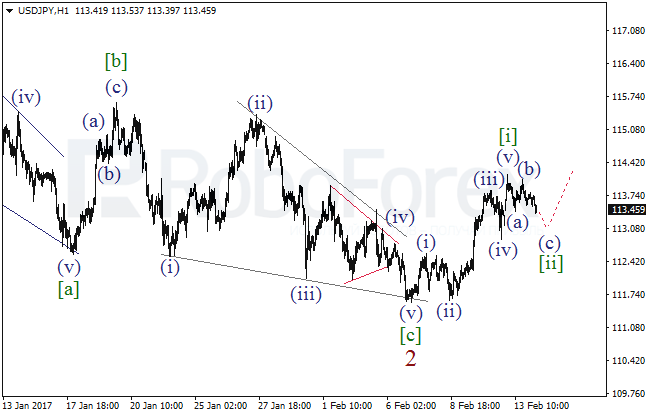
Probably, after finishing the wave 2 in the form of the zigzag with the diagonal triangle[c] inside it, the USD/JPY pair completed the bullish impulse in the wave [i]. Consequently, after finishing the local correction, the market is expected to continue moving upwards.
More detailed structure is shown on the H1 chart. Yesterday, the pair completed the wave (v) of [i]. Possibly, the wave [ii] is taking the form of the zigzag. After finishing the wave (c) of [ii], the market is expected to resume its growth.
AUD USD, “Australian Dollar vs US Dollar”
In case of the AUD/USD pair, the main scenario remains bearish. Probably, the price completed the zigzag[ii] of the diagonal triangle in the wave 5. Later, the market may resume falling in the wave [iii] of 5.
As we can see at the M30 chart, the pair formed the triangle b in the wave (ii). As a result, after finishing the wave c of [ii], the price may start falling in the third wave.
Attention! Forecasts presented in this section only reflect the author’s private opinion and should not be considered as guidance for trading. RoboForex LP bears no responsibility for trading results based on trading recommendations described in these analytical reviews.
Trading on the euro on Monday closed in negative territory. The EUR/USD rate fell to 1.0592. The single currency depreciated on the back of a rise in US 10-year bond yields to 2.4519%.
The euro was also sensitive to news about Greece, who is unable to reach a deal with its international creditors. The Greek government need to gain approval in order to receive their next installment of financial assistance in their economic adjustment program, which amounts to 86 billion EUR.
Market expectations:
The economic calendar was bare on Monday. Today, traders will be awaiting the speech of Janet Yellen, Chair of the Federal Reserve System, as she addresses Congress, as well as the release of US inflation figures for January.
During the Asian session, the euro rose to 1.0612 owing to a fall in US bond yields. If yields continue to fall in the European session, the euro will strengthen against the dollar up to the moment of Yellen’s speech. From a technical standpoint, a serious correction is due, so it’s a good idea to lower your trading volume when it comes to short positions. The target for Tuesday is 1.0640 (45 degrees).
Day’s news (GMT+3):
10:00 Germany: preliminary GDP data (Q4), Consumer Price Index (Jan);
11:15 Switzerland: Consumer Price Index (Jan), producer and import prices (Jan);
12:30 UK: Retail Price Index (Jan), Producer Price Index – input (Jan), Consumer Price Index (Jan), DCLG House Price Index (Jan), Producer Price Index – output (Jan);
13:00 Eurozone: preliminary GDP data (Q4), industrial production (Dec); Germany: ZEW survey – economic sentiment;
The EUR/USD rate fell from the balance line to 1.0588. Now a smaller corrective movement is forming for 10-13th of February. The bears didn’t make it to the 67th degree, but this is no real cause for concern. US 10-year bond yields reversed downwards, and the euro went upwards.
As bond yields fall to 2.4350%, the euro’s strengthening will gather pace. For 10-year bonds, a double top looks to be forming on the weekly timeframe. Should the model be completed, the euro’s trend line will be broken through. First of all, I’m expecting the euro rate to restore to 1.0621 or 1.0625. After a short correctional phase, the euro should continue to strengthen. In making my forecast for today, I’m mostly relying on the hourly timeframe of US 10-year bonds.