Large speculators and traders decreased their net positions in the copper futures markets last week for a second straight week, according to the latest Commitment of Traders (COT) data released by the Commodity Futures Trading Commission (CFTC) on Friday.
The non-commercial futures contracts of copper futures, traded by large speculators and hedge funds, totaled a net position of 45,243 contracts in the data reported through February 14th. This was a weekly decline of -6,316 contracts from the previous week which had a total of 51,559 net contracts.
Speculative positions, despite the two weeks of declines, remain on the bullish side for the sixteenth straight week and above the +40,000 net bullish level for a fourteenth straight week.
Copper Commercial Positions:
The commercial traders position, categorized by the CFTC as hedgers or traders engaged in buying and selling for business purposes, totaled a net position of -48,517 contracts last week. This is a weekly change of 6,135 contracts from the total net of -54,652 contracts reported the previous week.
Copper ETN:
Over the same weekly reporting time-frame, from Tuesday to Tuesday, the JJC iPath Bloomber Copper ETN, which tracks the price of copper, closed at approximately $31.77 which was a rise of $1.39 from the previous close of $30.38, according to financial market data.
*COT Report: The COT data, released weekly to the public each Friday, is updated through the previous Tuesday (data is 3 days old) and shows a quick view of how large speculators or non-commercials (for-profit traders) as well as the commercial traders (hedgers & traders for business purposes) were positioned in the futures markets. The CFTC categorizes trader positions according to commercial hedgers (traders who use futures contracts for hedging as part of the business), non-commercials (large traders who speculate to realize trading profits) and nonreportable traders (usually small traders/speculators). Find CFTC criteria here: (http://www.cftc.gov/MarketReports/CommitmentsofTraders/ExplanatoryNotes/index.htm).
Gold is setting up for a historic rally based on my analysis. Recent news provides further evidence that the Precious Metals and Currencies are in for a wild ride. Just this week, news that China’s reserves fell below $3 Trillion as well as the implications that the fall to near $2T in reserves could happen before the end of 2017. Additionally, we have recent news that the EU may be under further strain with regards to Greece, the IMF and debt. The accumulation of Precious Metals should be on everyone’s mind as well as the potential for a breakout rally.
Based on my analysis, I would estimate that near June or July 2017, Gold will be near $1315 ~ $1341 (+13% from recent lows). This level correlates to a Fibonacci frequency that has been in place for over 3 years now. A second Fibonacci frequency rate would put the project advancement levels, possibly closer to October/November 2017, near $1421 (+21% from recent lows). After these levels are reached, I expect a pullback to near $1261 if the Gold rally ends near $1315~1341 or to near $1308~1309 if the Gold rally ends near $1421. This pullback would setup a massive next wave rally to $1585 or $1731. So, if you need confirmation of this move, just wait for any rally to end above $1315, then wait for a pullback below $1280 or $1315 and BUY.
Subscribers and followers of my work profited handsomely this month locking a 112% profit with NUGT ETF with my service at ActiveTradingPartners.
Remember, the volatility expansion I am expecting in the VIX near March/April will likely be the precursor event to a much larger volatility expansion later this year. I can’t accurately detail the scale and scope of the projected March/April event other than it will likely be larger than the last VIX expansion. I expect these global debt events to unravel the low volatility activity we have been seeing and shake up global markets/currencies. Within this process, Precious Metals will likely see a massive upside run as a protection from uncertainty and risk.
Silver Rally
Much like Gold, the other shiny metal is set for incredible runs as well. Given my Fibonacci frequency analysis, a similar type of patter may occur in Silver. Before we get too much further into this analysis, let me be clear about one thing. We are already nearly +50% towards the upside rally target in Silver based on simple Fibonacci frequency. This target is $19.10. This does not mean this is the end of the run (yet). It means we have already achieved some success in one level of predictive analysis and now we need to see if the second Fibonacci frequency plays out. The second Fibonacci frequency target is $20.78 (nearly +25% from recent lows)
Much like the Gold analysis, after these levels are reached, I expect a retracement/pullback to levels that reflect the Fibonacci frequencies before a follow through rally continues. The first Fibonacci frequency pullback range is $18.26~$17.85. The second, larger, Fibonacci frequency pullback range is $19.50~$18.82. Case in point, these retracement levels are based on what I can determine as common Fibonacci frequencies. The pullbacks could be deeper and reflect more uncommon frequency functions. As of right now, I don’t believe that will be the case – but I could be wrong on this matter. In any event, once the rally points ($19.10 or $20.78) are reached and Silver pulls back to below my retracement objectives ($18.26~$17.85 or $19.50~$18.82 respectively), look for long entry positions or accumulate more physical metals. Want to know what my upside “second wave” objective might be based on my frequency analysis for Silver?
Silver Charts – Daily & Weekly
Seeing as though you have been so patient in reading my analysis/article regarding these VIX cycle patterns and what I believe could happen with the US and global markets, I’m going to shed a little light into the future cycle phases of Silver. We’ll focus on Silver for one reason, it is a cheaper precious metal for most traders to participate in and it has some very interesting facets of cycle/Fibonacci analysis. One key date range that keeps appearing in my cycle analysis is April 17th through April 24th.
Additionally, June 26, July 31 and August 14 appear to be key cycle dates. Given my earlier analysis, I suspect the April dates will be critical to the VIX cycle spike that I’m expecting. It could also drive further expansion or price rotation in the Gold, Silver and OIL charts. What is interesting about these Fibonacci Time/Price “inflection points” is that they can be drivers of many outcomes (rallies, collapses, rotations, tops or bottoms). They simply tell us that we need to be aware of these dates and they may, and will likely, present key information for future decision making.
Now, onto the extended projections for Silver. If my first, shorter, Fibonacci frequency is correct, any subsequent (second wave) rally will likely start near $17.85~$18.15 sometime near or after April 10, 2017. This second phase rally will likely run to near $21.46 before finding resistance (possibly slightly higher). Target objective date ranges for this rally to end are June 19 through July 24.
If my second, longer/larger, Fibonacci frequency analysis is correct, any subsequent (second wave) rally will likely start near $18.80 sometime near or after May 8, 2017 and run to near $24.85 before finding resistance (possibly higher). Target objective date ranges for this rally to end are July 3 through August 7 (or later).
Remember, these second wave projections in Silver represent a 20.5% and 32.85% rally from my projected retracement levels. These are massive moves and I hope you are all able to take advantage of these triggers. Gold should move in somewhat similar manners – so pay attention. Smart traders and followers of ATP newsletter may take advantage of trades to play these moves.
USD (US Dollar) and Foreign Currencies
I touched on this topic earlier, yet I feel the need to provide further documentation regarding my belief that the USD will continue to enjoy renewed strength at least for the next few months. First, I expect the global weakness in foreign markets to continue to propel the USD and the US stock market to greater attempts at new highs. I believe large amounts of money will keep pouring into the US markets for reasons that are obvious to most – US strength and capabilities for growth. As I often tell my clients, if the US is growing, so is the rest of the world. The current situation is a bit different though as the US markets and currency is, as I believe, going to be a standout marketplace in a global pot of debt and confusion.
There is one level of resistance on the USD that we have to be concerned with, the $102.25 level. Beyond that, I believe the USD could reach $104~105 before August 2017. The possibility that a VIX expansion could drive the USD higher would be more highly correlated if there is some external (global) event that provides a catalyst for a stronger US Dollar. For example, a crisis in Europe, Greece or Asia that undermines expected currency valuations and results in strength in the USD. Right now, I would put that possibility at about 50/50 given some of the news items I’m seeing and the continued fundamental strength of the US economy.
USD Daily & Weekly Charts
The EURUSD relationship will continue to see downward pressure with a likely target objective near 1.035 as a first target. This downward pressure could drive the EURUSD valuations well below this level, but I feel the potential for the EURUSD falling below the 1.00 level is still far off. It would take a global cataclysmic event to drive the EURUSD values below PAR. I’m not saying it could happen, but I am saying I don’t see it happening anytime soon (without a global cataclysmic event).
My Fibonacci frequency target levels for the EURUSD are 1.014 and 0.999. As I stated, I don’t believe there is much downside risk below 0.99 unless the EU completely collapses. I still feel the Euro will survive as a global currency near PAR with the USD.
EURUSD Daily & Weekly Charts
Take a look at some of my recent trades to see how we’ve been able to generate profits for our valued members.
I hope you have enjoyed my analysis of the VIX cycle patterns and how the relate to opportunities for all traders? If you find this type of analysis helpful and want to take advantage of clear, concise and profitable trading signals, visit ActiveTradingPartners.com where I share even more detailed analysis and trading triggers with my members.
After a decade of huge international events, many Chinese people suffer from ‘gala-fatigue.’ So has the case for Beijing Winter Olympics 2022 dimmed as well? Not necessarily.
When the International Olympic Committee (IOC) awarded the 2022 Winter Games to Beijing, in a joint bid with the city of Zhangjiakou in North China’s Hebei province, the initial reaction of the international community was lukewarm.
In the past 120 years, the costs of the Olympic Games have skyrocketed.
Olympic cost overruns
While cost overruns – the differences between initial projections and final costs – have been the rule since the 1960s, the best-known Olympic debacles occurred a decade later. In Montreal’s 1976 Summer Games, costs overruns proved so huge that the Canadian city almost went bankrupt and spent three decades to pay off the bill.
Over the past two decades, the cost overruns of hosting the Olympic Games have skyrocketed from a minimum of 35 percent (Beijing 2008) to over 1,260 percent (Sarajevo 1984). While Barcelona 1992 ($9.7 billion) and Athens 2004 ($3 billion) contributed to debt crises in both countries, London 2012 ($15 billion) boosted UK’s economic distress before the Brexit referendum and Sochi 2014 ($22 billion) added to Russia’s economic challenges amid the US-EU sanctions.
The last nail in the coffin was Brazil 2016, where costs soared to $10 billion amid economic, political and security challenges.
Thinking big is no longer the Olympic goal. Rather, the point is to think smart. Typically, South Korea’s 2018 Winter Games will take place in a small mountain town, Pyeongchang; the smallest to host the Olympics since Lillehammer 1994 in Norway.
If Olympic cost overruns are a rule, how can the Beijing 2022 Winter Olympics be a success?
New preconditions for Olympic success
Cost control is the first precondition. Unlike most hosts, China has a track record. In the case of summer games, only few hosts – most impressively Beijing in 2008 – have managed to keep the cost overrun reasonable. But Winter Games aim far higher. While Beijing’s Summer Games cost $44 billion, the official 2022 budget is barely $3.1 billion.
The second precondition involves damage control. In 2014, the IOC introduced the Olympic Agenda 2020, which promotes sustainability and cost control seeking to transform Olympics into a “plug-and-play” event with minimal economic and environmental damage. For instance, Beijing 2022 is adapting six venues that hosted the 2008 Olympic Games to minimize the cost of construction.
Third, sustainability must be pervasive. Typically, the six new competition venues will be built using renewable technologies with energy saving and environmentally-friendly materials, while electricity for lighting, venue operations and transportation will come from solar and wind power.
Fourth, to promote sports economy, China needs world-class athletes as well as ordinary people. So the mainland is rolling out a national campaign to encourage 300 million people to participate in winter sports by 2022. Moreover, the venues will be distributed in three zones which will maximize opportunities for post-Games use, fostering the development of winter sports in and around Beijing.
Finally, local tourism needs sustained investment. While the current investment focuses for the 2022 Olympics, life will continue after the games. To avoid waste of resources, local governments and property developers could consider a sustained focus on local tourism and infrastructure, accommodations and environmental protection.
New China, new Olympics
While the first Olympics took place in 1896, the first Olympics in an emerging economy took place in Mexico City only in 1968. In Winter Olympics, the torch is shifting from advanced to emerging economies, as evinced by Russia 2014, South Korea 2018 and China 2022. That reflects the shift of economic power from the West to emerging Asia.
Gala-fatigue is difficult to avoid in an increasingly international mega city like Beijing. However, much of the cost controversy could be avoided if the Olympics can be organized with cost consciousness, damage control, sustainability, promotion of sports economy and sustained tourism and infrastructure investment.
Since Beijing Summer Olympics were China’s “coming-out party,” skeptics say there is no reason for new Olympics. Yet, several advanced economies have hosted two or more Olympic Games. Moreover, by 2022 China may be ready for a second coming-out party.
In 2008, Chinese GDP per capita was less than $7,900 and China accounted for 31 percent of the US economy and 7 percent of global economy, respectively. That was China of elevated growth but low living standards, cheap prices but high investment and overcapacity.
In 2022, Chinese living standards could be more than 2.5 times higher, while China may account for more than 80 percent of the US economy and some 20 percent of the global economy, respectively. That means a China with steadier growth but higher living standards, greater innovation and consumption will host the 2022 Winter Games. It will also mean China’s second coming-out party.
About the Author:
Dan Steinbock is research director of international business at the India China and America Institute (US) and a visiting fellow at the Shanghai Institutes for International Studies (China) and the EU Centre (Singapore). See http://www.differencegroup.net/
The original, slightly shorter commentary was released by China Daily on February 15, 2017
GBP USD, Time Frame H4. Indicator signals: Tenkan-Sen and Kijun-Sen ran into one another inside Kumo Cloud, they may intersect and form “Dead Cross” (1). Ichimoku Cloud is closed (2), Chinkou Lagging Span is below the chart. Short-term forecast: we can expect support from Senkou Span B, and decline of the price towards W Tenkan-Sen.
GBP USD, Time Frame H1. Indicator signals: Tenkan-Sen and Kijun-Sen are intersecting and forming “Dead Cross” (1). Ichimoku Cloud is closed (2), Chinkou Lagging Span is below the chart, and the price is below the lines. Short-term forecast: we can expect resistance from Tenkan-Sen, and decline of the price.
XAU USD, “Gold vs US Dollar”
XAU USD, Time Frame H4. Indicator signals: Tenkan-Sen and Kijun-Sen intersected inside Kumo Cloud and formed “Golden Cross” (1), the lines are still influenced by D “Golden Cross”; Tenkan-Sen is directed to the upside. Ichimoku Cloud is moving upwards (2), Chinkou Lagging Span is above the chart, and the price is on W Kijun-Sen. Short‑term forecast: we can expect resistance from W Kijun-Sen, and growth of the price.
Attention! Forecasts presented in this section only reflect the author’s private opinion and should not be considered as guidance for trading. RoboForex LP bears no responsibility for trading results based on trading recommendations described in these analytical reviews.
Inflation is coming. In fact, inflation rose at the fastest pace in four years during January. Consumer prices surged 0.6% in January from December, double the consensus forecast of a 0.3% rise. This marks the sharpest monthly increase since February 2013, according to the Bureau of Labor Statistics.
Source: BLS St. Louis FED / Wolfstreet
The year over year chart helps to highlight the acceleration in inflation that we have seen over the past several months. The January spike is certainly more than a blip on the radar.
Source: BLS St. Louis FED / Wolfstreet
The year-over-year non-seasonally adjusted Headline CPI came in at 2.50%, up from 2.07% the previous month. While a sharp rise in the gasoline index accounted for nearly half the increase, there were advances in the indexes for shelter, apparel and new vehicles. Energy prices jumped 4% month over month, including gasoline which jumped 7.8%.
While many analysts have been calling for rampant inflation or even hyperinflation, it has failed to surface over the past decade. All of the money printing, fiscal stimulus, bank bailouts and explosion of the FED’s balance sheet has failed to generate any alarming inflation in official statistics. However, if you buy groceries or pay for health care, you might have a different take on the situation.
In fact, prices for beef and seafood have risen roughly 50% over the past ten years. Rice, pasta and bread are up around 40% in the same time period. Prescription drug prices are up 44% and health care premiums have skyrocketed. The price of college tuition is up 150% since 2000. Housing prices, to purchase or lease, have also climbed significantly over the past six years. The bottom line is that prices for nearly everything have been rising much faster than wages. Consumers are feeling the pain in their pocketbook and savings account, as their standard of living declines. If these latest inflation figures are a sign of things to come, that pain is going to get much worse.
What is causing prices to rise so fast?
It is the unholy alliance of the Federal Reserve and government. The Federal Reserve continues to debase the value of the dollar by creating trillions of dollars out of thin air in order to keep the economy afloat and enrich their bankster buddies. We’ve all seen this chart, but it a potent visual aide in understanding the extent to which the dollar has been devalued over time. One dollar from 1913, when the Federal Reserve was created, would be worth only 5 cents today!
You see, the FED can create unlimited amounts of dollars to suit their needs. Want to start another war? Let’s just borrow and print. Should the government balance the budget? Nah, just borrow, print and kick that can down the road. Big bank profits slipping? Reduce their borrowing costs, pay them interest on excess reserves and increase their leverage. That will fix it! After all, the Federal Reserve is believed to be majority owned by the big banks and their executives. So, it is no surprise that a quasi-federal institution would be working to benefit their largest shareholders.
We now have a President well versed with using debt and committed to massive new spending on infrastructure and the military. Deficits are likely to explode higher and the overall debt load will climb. My guess is that he will prioritize immediate economic growth over the disastorous long-term impact of unsustainable debt. Some of the increased deficit spending my be offset by increased tax revenues, if he is able to get corporations to repatriate cash and bring factory jobs back to the United States. Still, I believe we are likely to see rising annual deficits under Trump.
While the official CPI is growing at 2.5%, John Williams at Shadowstats.com believes the true inflation rate is closer to 6%. This measure reflects the CPI as if it were calculated using the methodologies in place in 1980. In general terms, methodological shifts in government reporting have depressed reported inflation, moving the concept of the CPI away from being a measure of the cost of living needed to maintain a constant standard of living.
Note that no matter which measure of inflation you use, inflation is currently spiking higher. We will need to watch closely in the coming months to see if this is a temporary spike or the start of a new major uptrend in the inflation rate. The worry is that inflation has a way of spiraling out of control, especially when massive amounts of new fiat funny money finally begin flowing through the economy. While the velocity of money has yet to pick up, as of Q4 2016, we are seeing other signs such as retail sales soaring 5.6% year-over-year in the latest reading.
What Does Increased Inflation Mean for Gold Investors?
Gold is off to a strong start of 2017, much like the strong start to 2016. It is up 8% despite the December rate hike, again similar to gold rising after the December 2015 rate hike. Gold had a small correction during mid-February last year and appears to be correcting again in mid-February this year. History repeats.
But the interesting thing in 2017 is that gold is holding up this time around despite increased odds of a March FED rate hike. The odds have recently doubled from 20% to 40% after hawkish comments from Janet Yellen stating that a March rate hike is not off the table. Of course, a spike in inflation also supports another rate hike sooner rather than later.
So, on the one hand gold should be dropping on increasing rate hike expectations, but on the other hand the spike in inflation is supporting the gold price. Gold tends to perform well during period of inflation when the dollar loses value. The Federal Reserve over-promised and under-delivered in terms of rate hikes in 2016 and the market may be betting on a more gradual pace than previously anticipated.
The bottom line is that the Fed is sitting on a powder keg, after years of QE and a zero-interest-rate policy (ZIRP) that have caused mind-boggling asset price inflation. The stock market and bond market are both in overvalued bubble territory waiting to pop. Real estate prices are back in bubble territory, with many markets now above pre-financial crisis highs. Banks are more levered than ever, with the persistence of too-big-to-fail and moral hazard unabated. When you throw in the increasing political instability occurring globally, it is only a matter of time before one of the bubbles pop and create a ripple effect throughout multiple markets.
I expect gold and silver price to continue much higher during 2017 and believe that all dips should be viewed as buying opportunities. Mining stocks have been giving investors leveraged returns of roughly 3X the advance in gold. Several of the junior mining stocks that we track in our newsletter are up 50% or more in just the first two months of the year!
In addition to gold, we have been generating significant profits in uranium stocks, lithium stocks, cannabis stocks and other sector. Get all of our top picks by becoming a Gold Stock Bull Premium Member.
Please note that our subscription prices are going up March 1st, so you may want to consider locking in current rates before they increase. It is currently less than $1 per day for the subscription. We believe it will pay for itself many times over.
Jason Hamlin is the founder of Gold Stock Bull and has been investing in precious metals for over 20 years. Jason spent nearly a decade in analytics for the world’s largest market research firm, before finding success investing full time. He launched Gold Stock Bull in 2005 and turned his focus from helping fortune 500 companies to helping individual investors that were struggling to achieve strong gains in the stock market.
The EUR/USD pair has reached the target of the correction and right now is consolidating at the top of the ascending wave. Possibly, today the price may break this range to the downside and start forming the fifth wave inside the downtrend. The target is at 1.0500.
GBP USD, “Great Britain Pound vs US Dollar”
The GBP/USD pair is consolidating in the center of the range without any particular direction. Possibly, today the price may break 1.2460. The target is at 1.2344. However, if the instrument breaks 1.2500 to the upside, the market may move upwards to reach 1.2582.
USD CHF, “US Dollar vs Swiss Franc”
The USD/CHF pair has reached the target of the correction and right now is consolidating. After breaking the range to the upside, the price may start the fifth ascending wave towards 1.0125.
USD JPY, “US Dollar vs Japanese Yen”
The USD/JPY pair is still being corrected. Possibly, today the price may grow towards 113.83. Later, in our opinion, the market may fall with target at 112.60 and then start another growth to reach 115.30.
AUD USD, “Australian Dollar vs US Dollar”
The AUD/USD pair is falling towards 0.7650. After reaching this level, the instrument may grow to with the target at 0.7700. Later, in our opinion, the market may break 0.7650 to the downside and continue falling to reach 0.7500.
USD RUB, “US Dollar vs Russian Ruble”
The USD/RUB pair has completed the correction. Possibly, today the price may break 57.90 upwards and then grow to reach 58.40.
XAU USD, “Gold vs US Dollar”
Gold has completed another ascending structure. Possibly, today the price may fall towards 1213.50. After breaking this level to the downside, the instrument may continue moving downwards to reach the local target at 1192.00.
BRENT
Brent has reached the target of the descending structure. Possibly, today the price may grow towards 56.25 and then start another decline to reach the local target at 54.50.
Attention! Forecasts presented in this section only reflect the author’s private opinion and should not be considered as guidance for trading. RoboForex LP bears no responsibility for trading results based on trading recommendations described in these analytical reviews.
Trading on the euro on Thursday closed in the green. The EUR/USD rate corrected to 1.0679 on the back on a fall in US bond yields. The US statistics released were kind to the dollar, but not enough to reverse the correction. After an unsuccessful attempt to rise above 2.4868% on the back of this news, US 10-year bond yields fell to 2.4386% (-1.94%).
A rise in bond yields increases the chances of a rate hike by the Fed, and, conversely, a fall is likely to lead to rates being slashed. According to the CME Group FedWatch Tool, the likelihood of a rate hike in March has fallen from 31% to 17%. It was this downgrading that saw bond yields fall on Thursday. Investors are unsure whether or not the rate hike in March will happen. The probability of a rate hike in June, however, has increased from 45.4% to 46.4%.
US statistics:
The number of US jobless claims in the week ending 11/02 amounted to 239,000 (forecasted: 245,000, previous figure: 234,000).
New housing starts in January came to 1.246m (forecasted: 1.227m, previous figure: 1.279m).
The number of building permits issued in the US in January was 1.285m (forecasted: 1.230m, previous figure: 1.210m).
The Philadelphia Fed manufacturing survey saw the index rise to 43.3, up from the previous value of 23.6.
Market expectations:
The EUR/USD rate has found an equilibrium point at 1.0675 despite the balance line on the hourly timeframe running through the 1.0616 mark. Given that from a technical standpoint, US 10-year bond yields are expected to fall further, I’m expecting the euro to jump to around 1.0689 when trading opens in Europe. If the EUR/GBP cross rises, this could further increase to 1.0701. Once a new high has been reached, in the second half of the day, cyclical analysis points to a weakening of the euro. The scale of this correction will again depend on the dynamics of US bonds.
Day’s news (GMT+3):
12:00 Eurozone: current account (Dec);
12:30 UK: retail sales (Jan);
16:30 Canada: foreign portfolio investment in Canadian securities (Dec);
18:00 USA: CB leading indicator (Jan);
21:00 USA: Baker Hughes US oil rig count.
EURUSD rate on the hourly. Source: TradingView
Intraday forecast: low: 1.0653, high: 1.0690 (1.0701 if the EUR/GBP cross rises), close; 1.0665.
My predictions for the euro on Thursday came off in terms of growth. The euro received strong support from a fall in US bond yields as well as from growth on the EUR/GBP cross.
The euro’s strengthening against the dollar slowed down around the 135th degree at 1.0675. From there, after a rise in bond yields, the rate rebounded, but subsequently restored by the end of the session.
Trading on the pair has now been showing a bullish trend for several hours under the 1.0675 mark. The thing is that the euro has corrected by 76.4% from 1.0714 to 1.0521 and by 50.0% from 1.0829 to 1.0521. When several levels coincide from various methods of analysis, the strength of the support level increases. I’m forecasting a rise to 1.0690 followed by a fall to 1.0653. The euro could fall immediately given that the Stochastic indicator is reversing downwards. However, this is a relatively weak signal.
On the chart I’ve drawn two 45 degree marks. The first was calculated from a maximum of 1.0679, and the second from 1.0690. If the cross falls on the back of a rising dollar, you should look at the targets below the 45th degree. Don’t forget to keep an eye on US 10-year bonds, since a fall in yields will prevent the euro from weakening.
Learn what indicator foresaw the euro’s recent reversal to a one-month low
By Elliott Wave International
Today, February 14, is Valentine’s Day. But instead of chocolate hearts and red roses, we’re going to give investors and traders the ultimate gift — namely, the gift of knowledge.
According to mainstream financial wisdom, market trends are driven by news events much in the same way a lover’s heart is controlled by Cupid’s arrow. A “shot” of positive news lifts prices; a “shot” of negative news hurts them.
Simple, right?
Not exactly. See, we believe the main force driving market trends is that of investor psychology, which unfolds as Elliott wave patterns directly on the market’s price chart. These patterns are not beholden to the current news cycle, and therefore, often run counter in nature to the mainstream outlook for future price action.
Take, for instance, the euro’s recent performance. On January 31, the euro was on cloud nine, having started the month at a 14-year low only to end it at a two-month high.
“Why the Euro is a Buy?” asked one January 31 news source.
And, according to the mainstream experts, the answer included a raft of positive economic data released on January 31, such as:
Eurozone inflation soared to its highest level since February 2013
Euro area’s GDP rose at a faster pace than the U.S. for the first time since 2008
Euro area registered its lowest unemployment rate in 7 years
The U.S. dollar suffered its worst January in 30 years
Also in the euro’s favor was supportive political rhetoric expressed on February 1 by U.S. President Trump’s top trade advisor, who on that day called the euro “an implicit Deutsche mark that is grossly undervalued.”
Everything was coming up red roses in the euro’s fundamental backdrop.
But, according to the analysis our Currency Pro Service posted on February 2, a major bearish development was underway in the EURUSD’s technical backdrop — namely, the end of an Elliott second wave, and start of a powerful wave 3 decline.
“EURUSD poked to a new recovery high before closing lower when compared to Wednesday. The possible reversal day might signal the second wave recovery is finally at an end. An impulsive decline would bolster that idea…
“A decline beneath 1.0620 would signal the turn might have occurred.”
So, what happened next?
Well, despite the rosy fundamental backdrop, the EURUSD indeed turned down (falling euro, rising dollar), plunging rapidly to a one-month low on February 14. Here, the next chart captures the dramatic decline:
Now, the February 14 Currency Pro Service reveals whether ample evidence is in place of a bottom — none of which, by the way, comes from the day’s news.
Free eBook Trading Forex: How the Elliott Wave Principle Can Boost Your Forex Success
Learn how to put the power of the Wave Principle to work in your forex trading with this free, 14-page eBook. EWI Currency Pro Service editor Jim Martens shares actionable trading lessons and tips to help you find the best opportunities in the FX markets you trade.
This article was syndicated by Elliott Wave International and was originally published under the headline Roses Are Red… and So’s Been EURUSD’s Trend. EWI is the world’s largest market forecasting firm. Its staff of full-time analysts led by Chartered Market Technician Robert Prechter provides 24-hour-a-day market analysis to institutional and private investors around the world.
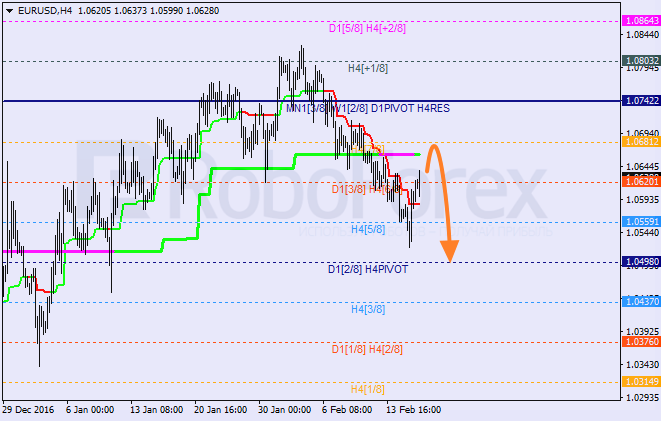
The EUR/USD pair failed to fix below the 5/8 level and, as a result, started the current ascending correction. The closest target for bulls is the 7/8 level. If later the price rebounds from this level, the market may resume moving downwards to reach the 4/8 one.
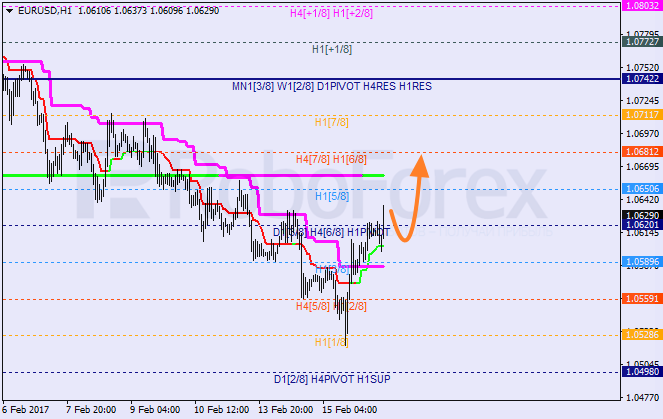
At the H1 chart, the pair rebounded from the 1/8 level and started a new correction; Super Trends formed “bullish cross”. During the day, the price may start a short-term decline, but later the market is expected to continue moving upwards to reach the 6/8 level.
NZD USD, “New Zealand Dollar vs US Dollar”
The NZD/USD pair rebounded from the 5/8 level and started a new correction. In the nearest future, the market may test the 7/8 level. If later the price rebounds from this level, it may resume moving downwards and test the 4/8 one.
At the H1 chart, the pair rebounded from the 2/8 level and then Super Trends formed “bullish cross”. On Thursday, the price may start a local correction towards the 4/8 level. If later the pair rebounds from this level, the market will resume growing towards the 6/8 one.
Attention! Forecasts presented in this section only reflect the author’s private opinion and should not be considered as guidance for trading. RoboForex LP bears no responsibility for trading results based on trading recommendations described in these analytical reviews.
The EUR/USD pair has reached the local target of the descending wave and right now is being corrected. Possibly, the price may grow towards 1.0658 to test it from below. Later, in our opinion, the market may start forming the fifth wave to reach 1.0500.
GBP USD, “Great Britain Pound vs US Dollar”
The GBP/USD pair has completed the third descending wave and right now is forming the fourth one to reach 1.2489. After that, the instrument may fall with the target at 1.2344 and then move upwards again to reach 1.2580.
USD CHF, “US Dollar vs Swiss Franc”
The USD/CHF pair is being corrected upwards. Possibly, today the price may reach 1.0017 and then continue growing towards 1.0133.
USD JPY, “US Dollar vs Japanese Yen”
The USD/JPY pair is being corrected towards 113.48. Later, in our opinion, the market may grow with target at 115.30.
AUD USD, “Australian Dollar vs US Dollar”
The AUD/USD pair has reached 0.7725 once again. Possibly, today the price may form another descending wave with the target at 0.7600. After breaking this level, the instrument may continue falling to reach 0.7500.
USD RUB, “US Dollar vs Russian Ruble”
The USD/RUB pair has completed the ascending impulse. Possibly, today the price may complete the correction at 57.21. Later, in our opinion, the market may grow towards 58.36.
XAU USD, “Gold vs US Dollar”
Gold is extending the correction towards 1239.00. After that, the instrument may continue falling inside the downtrend to reach 1211.00, or even extend this structure towards 1192.50.
BRENT
Brent is forming another descending structure to reach 55.37. Right now, the instrument is consolidating in the center of this wave. Possibly, the price may break this range downwards to reach 55.37. Later, in our opinion, the market may grow towards 56.24 and then start another decline to reach the local target at 54.00.
Attention! Forecasts presented in this section only reflect the author’s private opinion and should not be considered as guidance for trading. RoboForex LP bears no responsibility for trading results based on trading recommendations described in these analytical reviews.
 By CountingPips.com – Get our weekly COT Reports by Email