Author Archive for InvestMacro – Page 586

EUR/USD: the euro has fallen on the back of a rise in US bond yields

By Gabriel Ojimadu, Alpari

Previous:

On Wednesday, trading on the euro closed down. During trading in New York, the euro fell to 1.0535 as the release of statistics in the US fell kindly in the dollar. The number of new private sector jobs in February exceeded expectations. The previous figure was revised and upgraded.

The euro subsequently bounced up to 1.0563 as German 10-year bond yields rose by 15.3%. The effect from the European debt market was minimal.

On this news, US 10-year bond yields rose by 1.74% to 2.562%. The probability of a rate hike by the Fed in March has risen from 84.1% to 90.8%, in May from 85.5% to 91.4%, and in June from 92.2% to 95.8%.

The number of new private sector jobs came to 298,000 (forecasted: 190,000, previous figure revised from 246,000 to 261,000).

Market expectations:

In Asia, US 10-year bond yields have grown by 0.77% to 2.571%. Correspondingly, the EUR/USD rate has fallen to 1.0529. Sellers are showing some bearish behaviour in anticipation of a rate hike by the Fed on the 15th of March, trying to bring the price down to around 1.0495.

For Thursday, traders will be focusing on the ECB meeting and the press conference with Draghi that will follow. I don’t make forecasts on days when there is a press conference with the head of the ECB, or on payrolls day (Friday). These are two events that will have a short-term effect on the euro, but at the same time, it will pose a problem for traders who are using technical analysis in their trading strategies.

Day’s news (GMT+3):

  • 09:00 Japan: machine tool orders (Feb);
  • 09:45 Switzerland: unemployment rate (Feb);
  • 15:30 USA: Challenger job cuts (Feb);
  • 15:45 Eurozone: ECB interest rate decision;
  • 16:30 Eurozone: ECB statement and press conference;
  • 16:30 Canada: new housing price index (Jan), capacity utilisation (Q4);
  • 16:30 USA: initial jobless claims (Mar 3), import price index (Feb).

EURUSD rate on the hourly. Source: TradingView

Intraday forecast: low: n/a, high: n/a, close: n/a.

My prediction of a fall in the euro yesterday to the 90th degree played out perfectly. Some strong figures from the ADP brought about a sharp rise in US bond yields and a strengthening of the dollar across the board.

In Asia, the euro has fallen to 1.0529, breaking past the 90th degree. The reversal zone can be found between 1.0511 and 1.0486. Given that the ECB has a press conference scheduled for after the meeting today, my graph doesn’t contain any predictions, just one markup of price levels.

The only thing I have to add is that the euro index has been trading within a range of 99.53 – 99.86 for the last two days. The current value is 99.56, which puts the price at the lower boundary of the range and the trend line. The index for the EUR/GBP cross currently stands at 30.5%, so in the event of a downwards correction, the index will leave this range downwards and break through the trend line. The target for US 10Y is 2.64%, meaning that the euro could go lower than 1.0495.

Positives for the euro (+):

Fundamental:

(+) US president Donald Trump favours a weaker dollar;

(+) The threshold for acceptable US government debt of 20.1 trillion USD may be reached by March this year. This will create headaches for new US president Donald Trump. A new law on the debt ceiling will come into force on the 16th of March 2017;

(+) The Greek government has made some progress in its talks with international creditors on the second stage of their reform program;

Technical (short-term):

(+) According to data from 28/02/17, large speculators on the Chicago Exchange have increased their short and long positions. Long positions have grown by 10,546 to 142,762 contracts, while short positions have grown by 4,293 to 187,304 contracts. Net short positions have fallen from 50,779 to 44,542 contracts.

(+) German 10-year bond yields: 0.369% (up 15.3% from 08/03/17);

(+) EURGBP (W):  the CCI (20), AC and the Stochastic (5,3,3) are moving upwards;

(+) EURGBP (D): the AO is moving upwards;

(+) EURUSD (M): the Stochastic (5,3,3) is moving upwards;

(+) EURUSD (D): The AC and CCI (20) indicators are moving upwards;

Negatives for the euro (-):

Fundamental:

(-) The ECB has no plans to curtail its QE program. According to the minutes of the latest meeting, most members of the Governing Council don’t believe it necessary to reduce the amount of stimulus (long-term impact);

(-) According to CME Group’s FedWatch Tool, as of Wednesday the 8th of March, the probability of a rate hike in March has risen from 84.1% to 90.8%, in May from 85.5% to 91.4%, and in June from 92.2% to 95.8%;

(-) There’s a high level of political uncertainty in Europe (French elections and Brexit). Ex-Prime Minister Alain Juppe has ruled himself out of participation in the French presidential elections;

(-) The ECB will hold a meeting on Thursday;

(-) Excellent ADP data (for the dollar);

Technical factors (short-term):

(-) According to data from 28/02/17, small speculators have increased their short positions by 1,481 contracts and reduced their long positions by 210;

(-) US 10-year bond yields have risen to 2.562% (up 01.74% from 08/03/17). In Asia, yields have risen by 0.77% to 2.571%;

(-) Long/short ratio according to myfxbook as of 7:30 EET: 31%/68%, lots: 11000/23800 (previous day: 11979/19122), positions: 30156/55841 (previous day: 35229/45836)

(-) EURUSD (W): AO, AC, and CCI are moving downwards;

(-) EURUSD (D):  A false breaking through of the trend line. The Stochastic (5,3,3) and CCI (20) indicators are moving downwards;

(-) EURGBP (D): the cross has reached the trend line and a reversal hammer has formed. The Stochastic (5,3,3) and CCI (20) indicators are moving downwards;

Built into the price:

(-) President of the Philadelphia Fed, Patrick Harker, has hinted at a rate hike in March;

(-) President of the Dallas Fed, Kaplan, says that it’s better to raise rates sooner rather than later;

(-) President of the San Francisco Fed, John Williams, says that March is a good time for the FOMC to seriously consider a rate hike;

(-) FOMC member Lael Brainard says that the US economy is growing, and that a rate hike would soon be appropriate;

(-) Head of the FOMC, Janet Yellen, has said that interest rates might be raised in March;

(-) Head of the Fed in Richmond, Lacker, has said that losing control over inflation could prove very costly;

(-) Vice-president of the Federal Reserve, Stanley Fischer, echoes his colleagues’ comments about rate hikes;

(+) François Bayrou, leader of the “Democratic Movement” party, has ruled out running for the presidency and thrown his weight behind independent candidate Emmanuel Macron;

(+) Marine Le Pen has had her EU parliamentary immunity from prosecution lifted for political reasons.
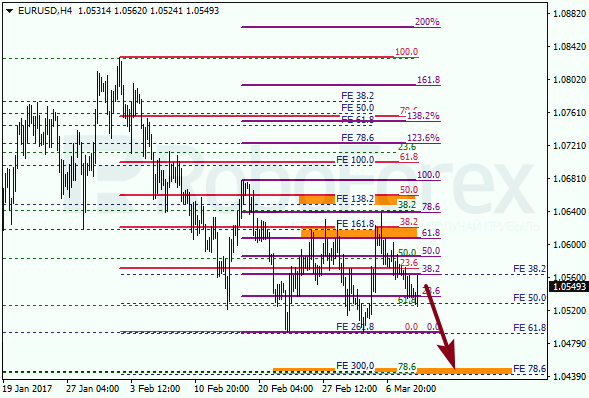
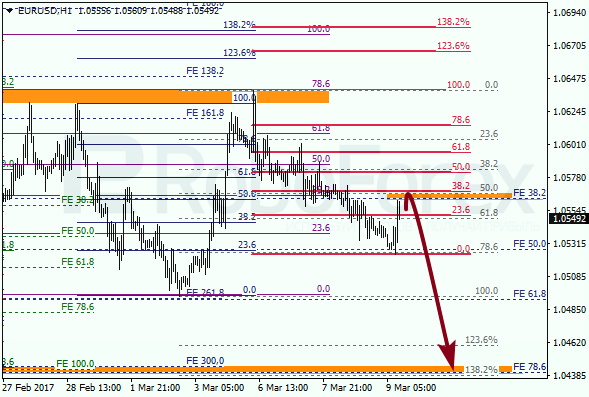
Fibonacci Retracements Analysis 09.03.2017 (EUR/USD, EUR/GBP)

Article By RoboForex.com

EUR USD, “Euro vs US Dollar”

The EUR/USD pair rebounded from the correctional retracement of 38.2% several times and resumed falling. After finishing the local correction, the market may continue moving downwards to reach the area at 1.0445 – 1.0440.

As we can see at the H1 chart, the closest target of the current correction is the retracement of 38.2%. If the price rebounds from this level on Thursday, the pair may continue falling and reach several new lows.


EUR GBP, “Euro vs Great Britain Pound”

The EUR/GBP pair continues growing. The main target for bulls is the group of fibo-levels at 0.8760 – 0.8750. if later the price rebounds from this area, the market may start a new descending correction.

At the H1 chart, the upside targets are confirmed by intraday fibo-levels. Possibly, on Thursday bulls may test this area, which may provide resistance.


RoboForex Analytical Department

Article By RoboForex.com

Attention!
Forecasts presented in this section only reflect the author’s private opinion and should not be considered as guidance for trading. RoboForex LP bears no responsibility for trading results based on trading recommendations described in these analytical reviews.

How Trump Versus Fed Adds to Uncertainty

By Dan Steinbock

To implement his $1 trillion dollar infrastructure plan, President Trump needs low rates, even though the Fed’s rate hikes will strengthen dollar. That means new uncertainty worldwide.

In his Crippled America (2015), Trump argued that “our airports, bridges, water tunnels, power grids, rail systems—our nation’s entire infrastructure is crumbling, and we aren’t doing anything about it.”

The problem is that as Trump would like to begin his $1 trillion dollar infrastructure plan, the Fed is about to accelerate rate hikes. Trump needs low rates and weak dollar. Yellen is raising rates and strengthening dollar. Something has got to give in.

Trump’s $1 trillion infrastructure plan

During his campaign, President Trump argued that US economic growth and job creation rests on the combination of income tax cuts, deregulation, trade protectionism and spending for defense and infrastructure. His proposal to boost defense-related spending by $54 billion suggests that he is about to move ahead.

Trump’s newly-confirmed secretary of commerce, billionaire Wilbur Ross, and the head of National Industrial Policy Commission, Peter Navarro, believe that increased economic growth would be stimulated by income tax cuts and additional military and infrastructure spending, which would offset increased budget deficits.

While there is a longstanding bipartisan agreement on the need for the modernization of the US infrastructure, there has been little consensus about how to go about it. During his campaign, Trump proposed to spend $800 to $1 trillion to repair and improve the U.S. infrastructure. To raise capital, he hopes to create an infrastructure fund supported by government bonds that investors and citizens could purchase, similar to Build America Bonds.

Nevertheless, realistic analysis of the Trump plan suggests it would cause the national debt to increase by almost $10 trillion over a decade; on top of the current $20 trillion which already accounts for 107 percent of the US GDP. That would translate to a debt tsunami.

Fed’s impending rate hikes

When Trump’s infrastructure plan was developed, interest rates were still close to zero. But as the Fed is about to hike up the rates, the plan will be a lot more expensive to execute.

In December 2015, the US Federal Reserve raised the interest rate by 25 basis points. It was the first step away from the zero-bound interest rate policy since 2008. In the current year, the Fed seeks to accelerate tightening with three comparable rate increases, even as Trump is about to unleash his $1 trillion debt tornado.

“If we raise interest rates and if the dollar starts getting too strong, we’re going to have some major problems,” Trump warned in June 2016. That shift is a reality now. He can no longer rely on the Fed to ease and thus to monetize the debt issuance. In turn, efforts at aggressive infrastructure modernization could force Yellen to slow down rate increases, keep them lower, or halt such hikes, and so on.

At the same time, any perceived stalemate between the White House and the Fed could lead foreign holders of US treasuries to unload their holdings. That’s what happened last year when the US presidential elections got ugly and foreign holders of US treasury securities – China, Saudi Arabia, Russia, and Turkey – reduced their holdings by $250 billion.

Increased uncertainty about the contradictory objectives of the Fed and the White House could result in a new wave of dumping.

More volatility

What’s at stake is also the value of the US dollar. Fed’s rate hikes tend to strengthen the dollar, while Trump’s debt tsunami would weaken it.

US dollar’s recent fluctuations reflect uncertainty about the administration’s contradictory objectives, even as the US dollar has replaced the volatility index as the new “fear index.”

The timing is not favorable as the Trump administration is about to accuse its key trade partners – China, Germany, Japan and Mexico – for “unfair trade” and “currency manipulation.”

The new economic uncertainty and market volatility is only about to begin.

About the Author:

Dr Steinbock is the founder of Difference Group and has served as research director at the India, China and America Institute (USA) and visiting fellow at the Shanghai Institutes for International Studies (China) and the EU Center (Singapore). For more, see http://www.differencegroup.net/ 

The original commentary was released by Shanghai Daily, March 2, 2017


The Rise and Decline of Four Little Dragons

By Dan Steinbock

After a stunning growth performance, all four dragons are slowing and aging. In the absence of drastic policy changes, they are facing relative stagnation, says Dan Steinbock.

In The Four Little Dragons (1992), U.S. academic Ezra Vogel argued that the four little dragons—Taiwan, South Korea, Hong Kong, and Singapore—were the newly-industrialized economies, which had followed Japan’s export-led growth model to prosperity. Unlike major advanced economies, which established their position in a century or two, the four dragons made their mark in just a few decades.

Today, the dragons’ world looks very different. There is a common denominator behind Hong Kong’s economic and political malaise, Taiwan president Tsai Ing-wen’s effort to lean on the Trump White House, South Korea’s mass demonstrations to impeach President Park Geun-hye, and Singapore’s Future Committee’s attempt to accelerate economic growth.

Political friction usually follows aging and slowing. That’s the common denominator.

Rise of dragons

Some half a century ago, the four dragons began extraordinary rapid industrialization starting with Hong Kong’s textile industry in the 60s, followed by export-oriented industrialization in Lee Kuan Yew’s Singapore, modernization and export expansion in Kuomintang’s Taiwan, and Park Chung-hee’s South Korea. From the early 1960s to the 90s, the dragons enjoyed high growth rates. In the process, they leapt “From the Third World to the First” within one generation, as Lee later put it.

In 1960, Hong Kong, the first dragon to begin the catch-up, still led in average living standards; it was only 20 percent behind Japan, followed by Singapore, Taiwan and South Korea. But Hong Kong remained more than 30 percent behind U.S. In the weakest dragon, South Korea, living standards were barely 10 percent of those in America.

As the toughest phase of industrialization was achieved by 1980, little dragons were still led by Hong Kong. Although trade-friction between the U.S. and Japan was about to dominate headlines, living standards in Hong Kong were now only 25 percent behind those in Japan, but still 45 percent behind those in U.S.

Usually, most economies’ internal engines decelerate after industrialization associated high growth. However, the four dragons were in the right place in the right time and made the right growth choices. As China – the ultimate dragon – began its economic reforms and opening-up policies, the little dragons’ went overdrive that supported their growth another three decades.

Today, living standards in all dragons, except for South Korea, are relatively higher than in Japan, which has been overwhelmed by economic stagnation. Intriguingly, living standards in Singapore are now on average 35 percent higher than those in America; which Hong Kong has caught up with as well.

But easy catch-up growth is behind.

Shaky short-term prospects

In 2017, Singapore hopes growth of 2-3 percent, although analysts expect it to stay below 2 percent. Despite a strong last quarter in 2016, it is coping with economic malaise. Trade outlook is uncertain, due to new protectionism and regional tensions. Like Hong Kong, Singapore must also cope with the Fed’s hikes amid a tight labor market and softening property sector. It is seeking new growth not just in China and emerging Asia but via economic integration with Malaysia and Riau.

Despite improved prospects, Hong Kong ‘ growth is about 2.0 percent. Its future is overshadowed by political angst. Even more than Singapore, it is exposed to global liquidity swings, US trade protectionism and China’s rebalancing in the region. But unlike Singapore, Hong Kong has missed or continues to shun pro-growth integration opportunities. Failures in leadership are illustrated by the misconduct of former chief executive Donald Tsang and the weakness of his successor CY Leung.

South Korea’s growth rate has been cut to 2.8 percent, but economic momentum has moderated. Neither foreign trade, which is constrained by international environment, nor domestic demand, which suffers from indebted households, has been adequate to support strong growth. While rising inflation may generate a hike by the Bank of Korea, Seoul must cope with Chinese deceleration and U.S. protectionism and Washington could also target it for alleged currency manipulation.

Despite improved forecasts, Taiwanese growth rate for 2017 is estimated at 1.8 percent. Like Hong Kong, it is struggling with economic and political malaise; the former derive from maturation, the latter are largely self-induced. Thanks to growing political uncertainty, investment contraction could follow in due time, especially if friction with China will weigh on trade and investment.

Today, dragons are steadily aging and slowing, as evidenced by steady and occasionally steep deceleration of growth in each.

Slowing growth

The four dragons are aging. With demographic transition, birth and death rates are slowing, as evidenced by rise of median age. Among major advanced economies, it is highest in Japan and Germany (47), which are facing population decline. Among the dragons, it is highest in Hong Kong (43), followed by South Korea (41), Taiwan (40) and Singapore (40).

Worse, average living standards tend to mask broadening income polarization in the four dragons. Among major advanced economies, income inequality, as measured by Gini coefficient, is the highest in the US (45), but significantly lower in Japan (32), France and Germany (less than 30).  Among the dragons, it is highest in the financial hubs of Hong Kong (54) and Singapore (46), as opposed to high-tech giants Taiwan (34) and South Korea (30).

In the long-run, high living standards require solid growth and strong productivity, which usually rely on sustained innovation. Most dragons are driven by technology innovation, as reflected by their R&D per GDP. It is relatively highest in the world in South Korea (4.3%), and in the top league in Singapore (3.2%) and Taiwan (3%), which have bypassed the U.S. and Western Europe. However, Hong Kong (0.7%) is the great laggard.

All four dragons need great structural reforms and inclusive pro-growth policies, including greater productivity, innovation and R&D investments; more dynamic competition and new enterprises; higher retirement ages, accelerated skill-based immigration, drastically reduced policy barriers to female labor participation; and greater efficiency of public spending. A greater stress on human capital also requires more progressive taxation, aggressive measures to reduce income inequality; and adequate job protection legislation.

Finally, as the dragons’ internal growth engines are slowing, they must aggressively seek greater integration opportunities, especially through greater economic integration regionally and international trading arrangements.

In the absence of such changes, all four dragons could face creeping stagnation.

About the Author:

Dr Steinbock is the founder of the Difference Group and has served as the research director at the India, China, and America Institute (USA) and a visiting fellow at the Shanghai Institutes for International Studies (China) and the EU Center (Singapore). For more information, see http://www.differencegroup.net/

The original, slightly shorter version was published by South China Morning Post on February 28, 2017


Will Gold Continue to Drop? Rate Hikes, COMEX Shorts, Divergent Tops, Oh My!!

By Jason Hamlin, GoldStockBull.com

The gold price has dropped $40 or more than 3% over the past week from $1,255 to a low of $1,215. Silver has shed nearly $1 or 5.4% from $18.40 to $17.40. Sentiment has turned bearish and many analysts are now calling for precious metals to decline to new 2017 lows in the days and weeks ahead.

Fear the FED?

The main driver of the drop in the gold price has been a dollar rally, driven by increased odds of a March rate hike. Several FED officials have made comments suggesting they are ready to hike rates at the March 15 meeting. The odds of the FED hiking rates in March increased sharply from around 40% to 75% in a matter of days following their comments. Those odds have continued to inch higher, now around 90% probability of an increase in interest rates.

Slowly rising interest rates coming off a base around zero are not bearish for gold prices. Gold gained 52% in the June 2004 to June 2006 tightening cycle. It is also worth noting that precious metals initiated massive rallies immediately following the last two Federal Reserve rate hikes in December of 2015 and 2016. A hike of 25 basis points appears to already be baked into prices. If the FED fails to hike for some reason, watch for gold and silver to rocket higher. With the FED, you can always expect the unexpected.

Spring tends to be a weak seasonal period for gold and silver, but also one of the best times of year to buy. So, fear not the rate hike and instead exploit the unfounded fears of others to pick up precious metals on the dip and mining stocks at deep discounts.

Commercial Paper Shorts Pile On

Another factor that is no doubt weighing on gold and silver prices is the huge increase in short positions on the COMEX by commercial traders. Silver in particular now has the largest short position in history by commercial traders. This is often a precursor to a massive drop in the price, as commercials tend to be “smart money” (big banks with the means and leverage to manipulate prices).

silver cot

The blue bars show the short positions by commercial traders, which ou can see has increased to record levels as of the last COT report on March 3rd. The next report will be released on March 10th, which will give us a better idea of their position against silver. The gold chart also shows an increase in commercial shorts, but not nearly as dramatic as it occurred in silver.

On the flip side, large short positions also have the potential to add fuel to the fire of any rebound, as shorts would have to scramble to cover the positions. Given how large these positions have become, that is a significant amount of buying that would need to take place to cover. It remains to be seen just how committed they are to their bet on lower gold and silver prices.

Divergent Tops and Bottoms

We sent a note to subscribers last week when gold and silver started to climb higher, but mining stocks did not lead. This type of divergent top is almost always bearish and prices did reverse course in the days following this signal. Not only did mining stocks fail to lead the metals, but silver failed to lead gold higher. We ideally want to see these conditions present in order to increase our confidence in any move higher.

More recently, we have seen the opposite happening. Gold and silver were down 0.8% and 1.6% today, yet the GDX was only down 0.6% and GDXJ was actually in the green by 0.8%. We would normally expect to see mining stocks leading the metals lower with leveraged declines. Could this divergent bottom be a bullish sign for the sector?

Gold Technicals Are Neutral

The technical chart for gold is neutral from my perspective and does not yet suggest a major move in either direction. On the bearish side of things, the long-term downtrend that started in 2011 remains in place. The advance in 2016 was powerful, but not strong enough to break above of the downward-sloping trend channel.

But the shorter-term trend channel (dotted lines) is largely bullish. The advance in 2016 interrupted the series of lower highs and lower lows that had been taking place for years. Instead, gold has experienced a few higher highs and higher lows over the past few years. The 50-day moving average has crossed upwards through the 200-day moving average, which is another bullish sign.

Gold is holding right around support at $1,220, which has acted as both support and resistance over the past few years. I think this support will likely fail over the next few days and gold will test $1,200. From there, all eyes will be on $1,140 and bulls will want to see gold bottom somewhere above this price level to remain long for the remainder of 2017.

Bottom Line

The bottom line is that gold is currently directionless. We can’t project the direction of the next move with any confidence until gold breaks decisively below $1,140 or above $1,300. The current price of $1,220 is directly between these two key price points, so a move higher or lower has roughly equal weighting.

A break above $1,300 would be very bullish as gold would break through and invalidate the multi-year downward-sloping trend channel. A break below $1,140 would make a lower low on the chart and invalidate the short-term upward-sloping trend channel in place since late 2015. The RSI momentum indicator is in neutral territory with plenty of room to run in either direction.

With the above conditions present, we believe it is best to remain on the sidelines with plenty of cash available to take advantage of a potential dip in prices. The Gold Miners ETF (GDX) has already corrected by 15% and the Junior Gold Miners ETF (GDXJ) is down 20% since topping in early February. I would not be surprised to see a bit more downside from GDX to support just above $20. However, it is worth noting that the RSI is very close to oversold levels. A relief rally could be in play as early as Friday.

Want the good stuff? Get our stock picks, portfolio, precious metals research, charts, trade alerts and more by subscribing here.

About the Author: Jason Hamlin, GoldStockBull.com

Jason Hamlin is the founder of Gold Stock Bull and has been investing in precious metals for over 20 years. Jason spent nearly a decade in analytics for the world’s largest market research firm, before finding success investing full time. He launched Gold Stock Bull in 2005 and turned his focus from helping fortune 500 companies to helping individual investors that were struggling to achieve strong gains in the stock market.


Forex Technical Analysis & Forecast 08.03.2017 (EUR/USD, GBP/USD, USD/CHF, USD/JPY, AUD/USD, USD/RUB, GOLD, BRENT)

Article By RoboForex.com

EUR USD, “Euro vs US Dollar”

The EUR/USD pair continues forming another descending structure. Possibly, the price may reach the local target at 1.0554. After that, the instrument may grow towards 1.0580 and then continue falling to reach 1.0525.


GBP USD, “Great Britain Pound vs US Dollar”

The GBP/USD pair has reached the local target of the descending wave. Possibly, today the price may consolidate and start another correction with the target at 1.2377. Later, in our opinion, the market is expected to form the fifth structure to reach 1.2071.


USD CHF, “US Dollar vs Swiss Franc”

The USD/CHF pair is trading to break 1.0137 to the upside. Possibly, today the price may continue growing with the target at 1.0200. After that, the instrument may be corrected towards 1.0137 and then grow to reach 1.0240.


USD JPY, “US Dollar vs Japanese Yen”

Being under pressure, the USD/JPY pair is falling towards 113.40. Later, in our opinion, the market may grow with the target at 115.30, then reverse, and start falling to reach 111.10.


AUD USD, “Australian Dollar vs US Dollar”

The AUD/USD pair has completed the correction. Possibly, today the price may fall towards 0.7527. After that, the instrument may start another growth to reach 0.7630.


USD RUB, “US Dollar vs Russian Ruble”

The USD/RUB pair is being corrected towards 57.64. Possibly, today the price may reach this level and start growing with the target at 58.73. In fact, the instrument is expected to start forming the third ascending wave with the predicted target at 60.00.


XAU USD, “Gold vs US Dollar”

Gold is extending the descending wave; it has broken 1223 and formed the continuation pattern. Possibly, today the price may test 1223 from below and then continue falling to reach 1182.


BRENT

Brent has broken the ascending channel. Possibly, the price may reach 55.30 and form another consolidation range. After breaking the range downwards, the market may form a downside continuation pattern. The local target is at 54.00.


RoboForex Analytical Department

Article By RoboForex.com

Attention!
Forecasts presented in this section only reflect the author’s private opinion and should not be considered as guidance for trading. RoboForex LP bears no responsibility for trading results based on trading recommendations described in these analytical reviews.

The Yen is growing again. Overview for 08.03.2017

Article By RoboForex.com

The USD/JPY pair is falling on Wednesday morning as the market is processing the weak GDP report.

On Wednesday, the Japanese Yen is slowly growing against the USD. The current quote for the instrument is 113.70. The pair has been moving in the range between 113.60 and 114.80 more than a week.

This morning, Japan published the Final GDP report in the country in the fourth quarter 2016. The indicator expanded by 0.3% q/q against expectation of 0.4% q/q and the preliminary reading of 0.2% q/q. On YoY, the Japanese GDP added 1.2%, although it was expected to increase by 1.6%.

It’s quite interesting that the report components show the increase of the business spending (2.0% against 0.9%), but the private consumption isn’t growing as fast as the Japanese authorities want it to.

The Japanese GDP readings are positive for the fourth quarter in a row, i.e the entire year of 2016, which is the longest streak over the last 3 and half years. Rather, the question is how much it costs to the Japanese government.

The Leading Economic Index in Japan in January increased up to 105.5 points after being 104.8 points the month before and against expectations of 105.4 points. By the way, the December reading was the highest since the summer of 2015, and today’s number is even better. The indicator shows the economic activity in the country in the future. The bigger the number, the better for the Japanese Yen.


RoboForex Analytical Department
Article By RoboForex.com

Attention!
Forecasts presented in this section only reflect the author’s private opinion and should not be considered as guidance for trading. RoboForex LP bears no responsibility for trading results based on trading recommendations described in these analytical reviews.

EUR/USD: awaiting a renewed minimum

By Gabriel Ojimadu, Alpari

Previous:

Trading on the EUR/USD pair closed down on Tuesday. The single currency depreciated against the dollar on the back of a rise in US 10-year bond yields and a drop in their German equivalent.

By the end of the day, US 10-year bond yields had risen by 0.72% to 2.494%. German 10-year bond yields fell by 3.17% to 0.319%. The price found some support at around the 1.0560 mark, where the pair has been caught in a sideways trend for the last 17 hours or so.

Market expectations:

Expectations of an interest rate hike in the US are facilitating a downwards correction of the euro. After speeches from Janet Yellen and other Fed members last week, the probability of a rate hike in March reached 86.4% on Monday.

Six days remain until the Federal Reserve announces their decision. It’s worth noting that the probability of a rate hike has started to decrease. On Tuesday the 7th of March, according to CME Group’s FedWatch, the probability of interest rates being raised in March dropped from 86.4% to 84.1%, in May from 87.5% to 85.5%, and in June from 92.7% to 92.2%.

Traders on Wednesday will be looking at the ADP jobs report, and on Friday at the official statistics from the US Department of Labor. Friday’s payrolls should tell us whether or not the Fed will raise interest rates.

On the hourly timeframe, the euro has completed a correctional model similar to a triangle. Cyclical analysis points towards a reversal of the downwards movement sometime in the middle of the day. For Wednesday, I’m forecasting a drop in the rate to 1.0537 with a subsequent rebound to around 1.0563.

Day’s news (GMT+3):

  • 10:00 Germany: industrial production (Jan);
  • 11:15 Switzerland: CPI (Feb);
  • 15:30 UK: Spring budget;
  • 16:15 Canada: housing starts (Feb), USA: ADP employment change (Feb);
  • 16:30 Canada: building permits (Jan), labour productivity (Q4), USA: nonfarm productivity (Q4), unit labour costs (Q4);
  • 17:00 USA: wholesale inventories (Jan);
  • 18:30 USA: EIA crude oil stocks change (Mar 3).

EURUSD rate on the hourly. Source: TradingView

Intraday forecast: low: 1.0537, high: 1.0574, close: 1.0560.

My predictions about the EUR/USD pair for Tuesday came off in full. The rate corrected up to the 22nddegree at 1.0602 and subsequently fell to 1.0558 on the back of a rise in US bond yields.

The euro found some support at 67 degrees. The pair has been in a correctional phase for the last 17 hours. In the next few hours, there is a high risk of the currency pair renewing yesterday’s minimum. Given that the ECB is unlikely to make any changes to its monetary policy during Thursday’s meeting, I’m predicting a drop in the euro to 1.0537.

Looking at cycles and patterns, I’m expecting some growth beyond the rate’s current level with a rebound from the 67th degree. I have a feeling that before an upwards correction, we’ll see sellers taking out stop levels on long positions under 1.0558. Don’t forget that the long/short ratio is currently at 38%/61% and that the EUR/GBP cross is ready for a downwards correction after yesterday’s growth.

As cycles are suggestive of a reversal at around 14:00 EET, I’m expecting a sharp upwards rebound at around this time to 1.0563.

Keep an eye on US and German bonds. If US 10-year bond yields fall to 2.4930, the euro might restore to 1.0602 without falling.

Positives for the euro (+):

Fundamental:

(+) US president Donald Trump favours a weaker dollar;

(+) The threshold for acceptable US government debt of 20.1 trillion USD may be reached by March this year. This will create headaches for new US president Donald Trump. A new law on the debt ceiling will come into force on the 16th of March 2017;

(+) Greece may need less money than the IMF had planned for;

Technical (short-term):

(+) According to data from 28/02/17, large speculators on the Chicago Exchange have increased their short and long positions. Long positions have grown by 10,546 to 142,762 contracts, while short positions have grown by 4,293 to 187,304 contracts. Net short positions have fallen from 50,779 to 44,542 contracts.

(+) EURGBP (W):  the CCI (20), AC and the Stochastic (5,3,3) are moving upwards;

(+) EURGBP (D): the cross is in a phase of growth. The AO and AC are moving upwards;

(+) EURUSD (M): the Stochastic (5,3,3) is moving upwards;

(+) EURUSD (D): between the price and the CCI is a bullish divergence, the price rebounded from the minimum on 22/02/17, the CCI has intersected the -100 level from bottom to top, the fast line has intersected the slow line on the Stochastic (5,3,3) and the trend line from 02/02/17 has been broken through;

(+) In Asia, US 10-year bond yields have fallen by 0.09% to 2.509%;

Negatives for the euro (-):

Fundamental:

(-) The ECB has no plans to curtail its QE program. According to the minutes of the latest meeting, most members of the Governing Council don’t believe it necessary to reduce the amount of stimulus (long-term impact);

(-) According to CME Group’s FedWatch Tool, on Tuesday, the probability of a rate hike in March has fallen from 86.4% to 84.1%, in May from 87.5% to 85.5%, and in June from 92.7% to 92.2%;

(-) There’s a high level of political uncertainty in Europe (French elections and Brexit). Ex-Prime Minister Alain Juppe has ruled himself out of participation in the French presidential elections;

(-) Greece is unable to reach a deal with its creditors for financial assistance;

(-) The ECB will hold a meeting on Thursday;

Technical factors (short-term):

(-) According to data from 28/02/17, small speculators have increased their short positions by 1,481 contracts and reduced their long positions by 210;

(-) German 10-year bond yields: 0.319% (down 6.17% from 07/03/17). US 10-year bond yields: 2.511% (up 0.68% from 07/03/17);

(-) Long/short ratio according to myfxbook as of 5:13 EET: 38%/61%, lots: 11979/19122 (previous day: 14073/18231), positions: 35229/45836 (previous day: 40401/44557)

(-) EURUSD (W): AO, AC and CCI are moving downwards;

(-) EURUSD (D): Stochastic (5,3,3): the fast line has intersected the slow line from top to bottom;

(-) EURGBP (D): the cross has reached the trend line. Buyers are attempting to induce a rebound from it. The Stochastic (5,3,3) has crossed downwards.

Built into the price:

(-) President of the Philadelphia Fed, Patrick Harker, has hinted at a rate hike in March;

(-) President of the Dallas Fed, Kaplan, says that it’s better to raise rates sooner rather than later;

(-) President of the San Francisco Fed, John Williams, says that March is a good time for the FOMC to seriously consider a rate hike;

(-) FOMC member Lael Brainard says that the US economy is growing and that a rate hike would soon be appropriate;

(-) Head of the FOMC, Janet Yellen, has said that interest rates might be raised in March;

(-) Head of the Fed in Richmond, Lacker, has said that losing control over inflation could prove very costly;

(-) Vice-president of the Federal Reserve, Stanley Fischer, echoes his colleagues’ comments about rate hikes;

(+) François Bayrou, leader of the “Democratic Movement” party, has ruled out running for the presidency and thrown his weight behind independent candidate Emmanuel Macron;

(+) Marine Le Pen has had her EU parliamentary immunity from prosecution lifted for political reasons.

Japanese Candlesticks Analysis 07.03.2017 (EUR/USD, USD/JPY)

Article By RoboForex.com

EUR USD, “Euro vs. US Dollar”

At the H4 chart of EUR USD, bearish Harami pattern indicated a descending correction. Three Line Break chart and Heiken Ashi candlesticks confirm bullish direction.

At the H1 chart of EUR USD, the sideways correction continues. Engulfing Bearish pattern indicates a descending movement. The downside Window is a support level. Three Line Break chart shows a bullish direction; Heiken Ashi candlesticks confirm the descending movement.


USD JPY, “US Dollar vs. Japanese Yen”

At the H4 chart of USD JPY, bullish Inverted Hammer pattern indicates an ascending movement. Three Line Break chart and Heiken Ashi candlesticks shows a bearish direction to confirm that the descending correction continues.


RoboForex Analytical Department
Article By RoboForex.com

Attention!
Forecasts presented in this section only reflect the author’s private opinion and should not be considered as guidance for trading. RoboForex LP bears no responsibility for trading results based on trading recommendations described in these analytical reviews.

AUD/USD: RBA sounds neutral, as expected

By GrowthAces.com

Macroeconomic overview

The Reserve Bank of Australia held rates steady, widely expected decision given policymakers recently signalled a steady outlook for much of the year ahead.

Governor Philip Lowe has repeatedly emphasised limits to monetary policy and last month said further cuts in interest rates would not be in the national interest as the danger of a debt-fuelled boom and bust was just too severe. With the governor signalling a high bar for a move lower, interbank futures imply a mere 6% chance of another cut by August. Today Lowe maintained his upbeat tone. “Exports have risen strongly and non-mining business investment has risen over the past year,” Lowe said. “Most measures of business and consumer confidence are at, or above, average.” He also reiterated the central bank’s forecasts for a gradual pick-up in underlying inflation, which is pinned at a record low of 1.5%.

A survey of business expectations by Dun & Bradstreet on Tuesday found business confidence was at an 18-month high while plans for capital investments for the second quarter of 2017 were at a two-year peak.

The Australian dollar inched higher after the rate decision, supported by the outlook for steady policy. But the reaction was short-lived.

Technical analysis

The rejection of upward move today is an important bearish signal. What is more, the AUD/USD is below the negatively aligned 7-day exponential moving average, which highlights the bearish near-term outlook. But the scope for downward move is limited. The 0.7544 low on March 3 is still an important support level. Another solid support is situated at 0.7514 (38.2% fibo of December-February rise).

AUDUSD Daily Forex Signals Chart

Trading strategy

We think that further fall in the AUD/USD is likely in the near term, but we stay sideways, as the scope of this move may be relatively small. We will be looking to use lower levels to open another long position.


CHF/JPY: We expect a further fall to 38.2% fibo of last-year rally

Macroeconomic overview

Bank of Japan board member Takako Masai said large swings in exchange rates can be a concern for Japan’s economy as it could hurt business sentiment.

Masai said risks to Japan’s economy have subsided compared with the second half of last year, as a tightening job market supported household confidence and consumption.

But the BOJ stands ready to expand stimulus if necessary, as consumption and wage growth still lack momentum, she said.

Masai added that there is no change to the BOJ’s commitment to continue with its large-scale government bond purchases even under a new policy framework targeting interest rates.

North Korea fired four ballistic missiles into the sea off Japan’s northwest coast on Monday, angering South Korea and Japan, days after it promised retaliation over U.S.-South Korea military drills it sees as preparation for war. U.S. President Donald Trump told Japanese Prime Minister Shinzo Abe that the United States was with Japan “100 percent” over phone talks they held to discuss North Korea’s latest missile launches.

USD/JPY investors shrugged off geopolitical tensions after the North Korean missile tests.

Japan’s fourth-quarter GDP will be published tomorrow. We expect a slight upward revision, which should support the JPY.

Technical analysis

After a rejection of upward CHF/JPY move on Friday, the JPY started to appreciate against the Swiss currency. The CHF/JPY broke below the 112.45 (38.2% fibo of February-March rise) today. A close below 112.18 will open the way to full retracement of February-March move. We think the downward move will be continued to 110.64 (38.2% fibo of September-January rally).

CHFJPY Daily Forex Signals Chart

Trading strategy

We opened a short CHF/JPY position at 112.90 with the target at 110.60.


TRADING STRATEGIES SUMMARY:

(Detailed trading strategies are available only for VIP subscribers)
About the Author:

By GrowthAces.com – Daily Forex Trading Strategies