Author Archive for InvestMacro – Page 585

The Secret Wealth Of The World’s Richest Oil Billionaires

By OilPrice.com

A policy of nationalizing chunks of an economy inevitably creates oligarchs who skim profits off the country’s natural resources.

As such, you won’t be surprised to learn that the largest energy companies in the world are owned and operated by governments, and they include: Saudi Aramco, Russian Gazprom, China National Petroleum Corp. (CNPC), National Iranian Oil Co., Petroleos de Venezuela, Brazil’s Petrobras and Malaysia’s Petronas. How they’re run varies wildly—as does where their wealth goes.

While we’ve all been inundated with the massive amount of press on the scandals engulfing Brazil’s Petrobras, there are a few that stand out for creating and maintaining some of the world’s most interesting and colorful political leaders, who have grown their wealth through holdings in state-run oil and gas in some cases, and through more direct means in other cases.

Four state-run oil wealth stories stand out in today’s world: Russia, Azerbaijan, Kazakhstan, Angola and Brunei.

Vladimir Putin, Russia

Estimates of Russian President Vladimir Putin’s wealth only comes in ranges because most of his wealth is hidden through offshore companies or under clandestine financial devices.

The lower end of the range sits at US$40 billion – a 2007 figure based on research by mid-level Kremlin advisor Stanislav Belkovsky, which he later said had grown to US$70 billion. At this level, Putin already stands among Forbes’ Top 10 rankings of the world’s richest billionaires, though the magazine commented in 2015 that it could not verify enough of his assets to put him on the list.

Earlier this week, the International Business Times said Putin’s fortune could be as much as $200 billion.

The majority of Putin’s wealth comes from his stakes in the oil sector. He is said to own 37 percent of Surgutneftegaz, 4.5 percent of Gazprom, and holds a substantial share of commodities trader Gunvor.

“At least $40 billion,” Belkovsy told the Guardian in 2007. “Maximum we cannot know. I suspect there are some businesses I know nothing about.”

Putin’s trophies of wealth are far from subtle. His $1 billion palace on the Black Sea features “a magnificent columned façade reminiscent of the country palaces Russian tsars built in the 18th century,” according to the BBC, which also procured evidence that a secret slush fund had been created by a group of oligarchs to build the estate for Putin, personally.

It’s definitely not a lifestyle one can afford on a declared annual salary of around US$140,000.

In a 2012 dossier, Former Deputy Prime Minister Boris Nemtsov (later murdered) claimed that the Russian president owns a total of 20 palaces, four yachts and 58 aircraft.

“In a country where 20 million people can barely make ends meet, the luxurious life of the president is a brazen and cynical challenge to society from a high-handed potentate,” he said, according to the Telegraph.

But according to Putin himself, his wealth is not measured in money. In Steven Lee Myers’ book The New Tsar, Putin is quoted as saying: “I am the wealthiest man not just in Europe but in the whole world: I collect emotions.”

“I am wealthy in that the people of Russia have twice entrusted me with the leadership of a great nation such as Russia. I believe that is my greatest wealth.”

Azerbaijan

In 2003, Ilham Aliyev became the newly elected president of Azerbaijan. Thirteen years later, his name appeared in the Panama Papers – a massive leak of financial documents from the Panama-based law firm Mossack Fonseca, which revealed the shady financial dealings of some of the world’s most powerful political figures.

Months before the October 2003 presidential elections in Azerbaijan, Fazil Mammadov, Azerbaijan’s tax minister, began paperwork to form AtaHolding – a company that has become one of the nation’s largest conglomerates. It holds interests in telecommunications, construction, mining, and oil and gas for a total value of $490 million, according to the last filings in 2014.

A second entity – this time a foundation – called UF Universe holds more assets, but Panamanian laws regarding the confidentiality of foundations are strict, which makes uncovering dollar amounts difficult.

Aliyev’s two daughters and wife also have links to offshore companies managed by Mossack Fonsenca. Incidentally, Aliyev just named his wife Vice-President of Azerbaijan.

How much is the First Oil Family worth these days? No one really knows, but enough to make it onto this list.

Kazakhstan

Kazakh President-for-life Nursultan Nazarbayev was also named in the Panama Papers as a tax haven owner. He had two companies registered in the British Virgin Islands, which he used to operate a bank account with an unknown amount of funds, and a luxury yacht.

The revelations were particularly loaded with hypocrisy because of Nazarbayev’s push to encourage his country’s wealthy to repatriate funds from abroad in order to make them taxable.

“We’ve raised many rich people: billionaires, millionaires,” he said, when oil prices tanked in 2014 and the government began using sovereign wealth funds to fund operations. “They are showing off; (their) pictures in Forbes… They look good, with makeup, well-groomed, well-dressed. But it is Kazakhstan that enabled you to earn all this money… Bring the money here. We’ll forgive you.”

Angola

Things here may be about to change, because President Jose Eduardo dos Santos has said he plans to step down after decades in power, and won’t be running in August’s presidential elections, but still plans to control the ruling party. Here, wealth is all about Sonangol, which has been marred in controversy since the president last year named his daughter as the head of the state-run oil company.

Angola has massive oil wealth, yet the bulk of the country’s 22 million people live in poverty, and critics say he’s mismanaged the country’s oil wealth and created an elite that largely consists of his massively rich family. But this scheme is being hit hard by the fall in oil prices that began in mid-2014, and the people are no longer complacent in their poverty.

The president’s daughter, worth an estimated US$3.4 billion before she took over the state-run oil company, has been described by Forbes as Africa’s richest woman.

Brunei

And here’s one that’s probably not even on your radar, but it will be—sooner rather than later.

Vast reserves of oil and natural gas have made Sultan Hassanal Bolkiah of Brunei one of the richest leaders in the world. The Sultan is believed to be worth US$40 billion at the low end, and while ‘his’ holdings officially belong to Brunei, in reality they belong to the royal family.

Brunei is the third-largest oil producer in Southeast Asia, and pumps out, on average, 180,000 barrels per day. The royal family has controlled everything to do with oil and gas since the 1970s, and the line here between royal family assets and national assets is exceedingly blurry.

Vulnerable or Not?

The thing about these political oil leaders is that they’re not really vulnerable—yet. It would take an event such as that which brought down Gaddafi (said to secretly be worth US$200 billion) in Libya to change this.

In Brunei, things may be about to change, and the Sultan may find his wealth considerably downsized. Oil production is down 40 percent since 2006, and what’s left has lost a great deal of value due to low oil prices. Nearly 96 percent of Brunei’s exports are oil, gas and related products—that tops even Saudi Arabia, Kuwait and the UAE. Brunei could run out of oil in just over 20 years, but then again, the Sultan is said to have massive real estate holdings to tide him over.

Angola’s president is stepping down and the oil price crisis has hit him hard, but he’ll still control the ruling party and a new president will defer to him (and his daughter).

In Kazakhstan, Nazarbayev is president for life. In Azerbaijan, the family elite is as strong as ever and will continue to be so through any means necessary. In Russia, sanctions simply haven’t worked because they are designed to target those around Putin, and Putin appears to have designed it so they are always vulnerable to him first and foremost.

As Russian businessman and former Putin friend Sergei Pugachev notes to the Guardian, and as reported by U.S. News and World Report: “Everything that belongs to the territory of the Russian Federation Putin considers to be his. Everything – Gazprom, Rosneft, private companies. Any attempt to calculate it won’t succeed. … He’s the richest person in the world until he leaves power.”

Link to original article: http://oilprice.com/Energy/Energy-General/The-Secret-Wealth-Of-The-Worlds-Richest-Oil-Billionaires.html

By Zainab Calcuttawala for Oilprice.com
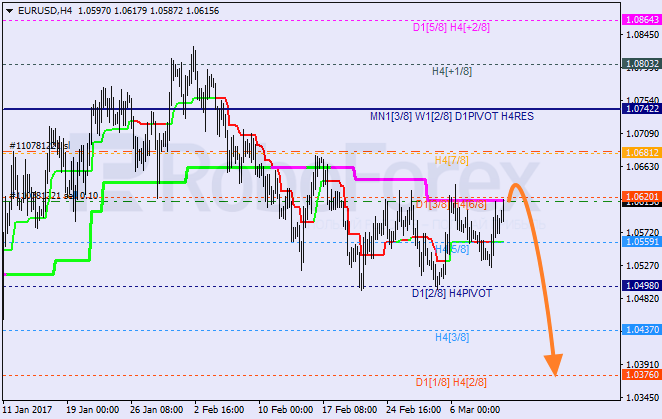


Murrey Math Lines 10.03.2017 (EUR/USD, USD/CHF)

Article By RoboForex.com

EUR USD, “Euro vs US Dollar”

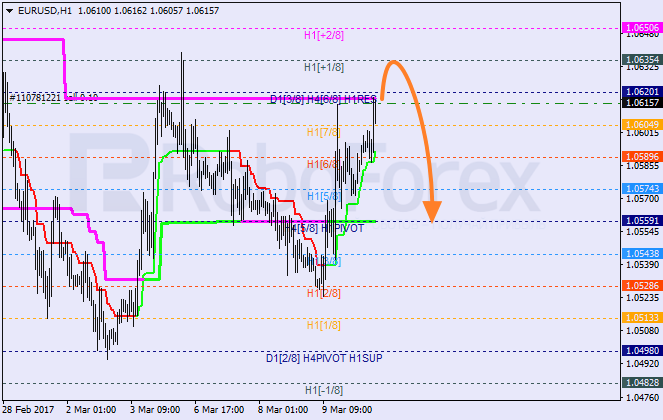
The EUR/USD pair is testing the 6/8 level and the daily Super Trend again. If the price rebounds from these levels, it may resume its decline. The closest target for bears is at the 2/8 level.

At the H1 chart, the pair is testing the downside border of the “overbought zone”. Possibly, on Friday the price may reach the +1/8 level. If later the pair rebounds from this level, the market may resume moving downwards.


USD CHF, “US Dollar vs Swiss Franc”

Yesterday, the USD/CHF pair rebounded from the 7/8 level. As a result, on Friday the price may resume moving upwards. If later the market breaks the +2/8 level, the lines at the chart will be redrawn.

At the H1 chart, the 3/8 level provided resistance. Consequently, in the future the price may test the 5/8 level. To confirm a new ascending movement, the market has to break this level and stay above it.


RoboForex Analytical Department

Article By RoboForex.com

Attention!
Forecasts presented in this section only reflect the author’s private opinion and should not be considered as guidance for trading. RoboForex LP bears no responsibility for trading results based on trading recommendations described in these analytical reviews.

Forex Technical Analysis & Forecast 10.03.2017 (EUR/USD, GBP/USD, USD/CHF, USD/JPY, AUD/USD, USD/RUB, GOLD, BRENT)

Article By RoboForex.com

EUR USD, “Euro vs US Dollar”

The EUR/USD pair has completed another descending impulse and right now is being corrected towards 1.0602. After that, the instrument may fall to break the low of the first impulse. The local target is at 1.0540.


GBP USD, “Great Britain Pound vs US Dollar”

The GBP/USD pair has reached its target and started consolidating. If later the market breaks this consolidation range to the downside, the instrument may reach 1.2071; if to the upside – start another correction with the target at 1.2370. Later, in our opinion, the market is expected continue falling to reach the main target at 1.2071.


USD CHF, “US Dollar vs Swiss Franc”

The USD/CHF pair is being corrected towards 1.0085. Later, in our opinion, the market may grow towards 1.0162 and then form another consolidation range. After breaking the range to the upside, the instrument is expected to continue growing to reach 1.0200.


USD JPY, “US Dollar vs Japanese Yen”

The USD/JPY pair has reached the target of the ascending wave. Possibly, today the price may form another consolidation range at the current highs and extend this structure towards 115.65. Later, in our opinion, the market may reverse and resume falling with the target at 111.10.


AUD USD, “Australian Dollar vs US Dollar”

The AUD/USD pair is consolidating. If later the market breaks this consolidation range to the upside, the instrument may be corrected to reach 0.7567; if to the downside – fall towards the main target at 0.7471.


USD RUB, “US Dollar vs Russian Ruble”

The USD/RUB pair is expected to continue growing towards 60.00. After that, the instrument may fall to reach 58.75 and then start growing with the target at 61.00.


XAU USD, “Gold vs US Dollar”

Being under pressure, Gold is still falling. Possibly, the price may reach the main target for the first wave at 1182. Later, in our opinion, the market may be corrected towards 1220.


BRENT

Brent is consolidating near the lows. Possibly, the price may grow to reach 54.45. After that, the instrument may fall towards 51.51 and then start another ascending movement with the target at 55.00.


RoboForex Analytical Department

Article By RoboForex.com

Attention!
Forecasts presented in this section only reflect the author’s private opinion and should not be considered as guidance for trading. RoboForex LP bears no responsibility for trading results based on trading recommendations described in these analytical reviews.

EUR/USD: price hovering around the trend line

By Gabriel Ojimadu, Alpari

Previous:

Trading on the euro on Thursday closed up. After Draghi’s press conference, the euro restored to 1.0615. The head of the ECB gave the impression that the regulator may not need to provide any further stimulus for the revitalisation of the European economy.

The ECB left its monetary policy unchanged and maintained its monthly net purchases in public and private sector securities at 80 billion EUR until the end of March. From April to December 2017, this figure will amount to 60 billion EUR a month on average. The ECB also upgraded its GDP and inflation forecasts for the Eurozone in 2017 and 2018.

Market expectations:

Today, traders’ attention will be directed towards America’s non-farm payrolls (NFP). A positive report could increase expectations of a rate hike by the Fed on the 15th of March.

According to CME Group’s FedWatch, as of the 9th of March, the probability of a rate hike this month is still 90.8%. For May, this probability has risen from 91.4% to 91.8% and for June from 95.8% to 95.9%.

Before the report is released, some growth to around 1.0610 is likely. As we get closer to the report’s release, it is expected that the price will stabilise around the 1.0599 mark. We also shouldn’t rule out a rise in US bond yields. On Thursday, US 10Y bond yields grew to 2.613% (up 2.07% from 09/03/17). In Asia, bond yields rose by 0.64% to 2.615%.

Day’s news:

  • 10:00 Germany: trade balance (Jan);
  • 12:30 UK: industrial production (Jan), manufacturing production (Jan), consumer inflation expectations, trade balance (Jan);
  • 16:30 Canada: net change in employment (Feb), unemployment rate (Feb); USA: average hourly earnings (Feb), unemployment rate (Feb), nonfarm payrolls (Feb);
  • 18:00 UK: NIESR GDP estimate (Dec-Feb);
  • 22:00 USA: monthly budget statement (Feb);

EURUSD rate on the hourly. Source: TradingView

Intraday forecast: low; n/a, high: n/a, close: n/a.

The euro closed up on Thursday. After Draghi’s speech, the scales tipped in buyers’ favour. The market has prepared itself for a rate hike on the 15th of March. Nothing is stopping the euro from rising towards 1.0675. If the Fed doesn’t raise interest rates on Wednesday, then the euro should reach 1.0800 within a couple of days. The NFP report should give us an indication as to what decision the Fed will take.

My forecast only goes as far as 16:30. Within this period, I’m expecting some growth to 1.0610 followed by a stabilisation at around 1.0600. Keep an eye on the EUR/GBP cross. If profits from long positions suddenly become fixed, the EUR/USD will fall to 1.05800. Cyclical analysis suggests a strengthening of the euro up until 16:30 EET. Still, it’s unclear whether or not the cycles from the hourly chart will coincide with the NFP.

Positives for the euro (+):

Fundamental:

(+) US president Donald Trump favours a weaker dollar;

(+) The threshold for acceptable US government debt of 20.1 trillion USD may be reached by March this year. This will create headaches for new US president Donald Trump. A new law on the debt ceiling will come into force on the 16th of March 2017;

(+) The Greek government has made some progress in its talks with international creditors on the second stage of their reform program;

(+) Head of the ECB, Mario Draghi, has hinted that the central bank may not need to provide any further stimulus to revitalise Europe’s economy.

Technical (short-term):

(+) According to data from 28/02/17, large speculators on the Chicago Exchange have increased their short and long positions. Long positions have grown by 10,546 to 142,762 contracts, while short positions have grown by 4,293 to 187,304 contracts. Net short positions have fallen from 50,779 to 44,542 contracts.

(+) German 10-year bond yields: 0.425% (up 15.17% from 09/03/17);

(+) EURGBP (W):  the CCI (20), AC and the Stochastic (5,3,3) are moving upwards;

(+) EURGBP (D): the AO is moving upwards. The trend line has been broken through;

(+) EURUSD (M): the Stochastic (5,3,3) is moving upwards;

(+) EURUSD (D): The AC, AO, and CCI (20) indicators are moving upwards;

Negatives for the euro (-):

Fundamental:

(-) According to CME Group’s FedWatch Tool, as of Thursday the 9th of March, the probability of a rate hike in March has remained at 90.8%. the probability of a rate hike in May has risen from 91.4% to 91.8, and in June from 95.8% to 95.9%;

(-) There’s a high level of political uncertainty in Europe (French elections and Brexit). Ex-Prime Minister Alain Juppe has ruled himself out of participation in the French presidential elections;

(-) On Wednesday the 8th of March, leading up to the release of NFP data, some very positive figures came out of the ADP report;

Technical factors (short-term):

(-) According to data from 28/02/17, small speculators have increased their short positions by 1,481 contracts and reduced their long positions by 210;

(-) US 10-year bond yields have risen to 2.613% (up 2.07% from 09/03/17). In Asia, yields have risen by 0.64% to 2.615%;

(-) Long/short ratio according to myfxbook as of 7:30 EET: 46%/53%, lots: 15330/17193 (previous day: 11000/23800), positions: (previous day: 30156/55841)

(-) EURUSD (W): The Stochastic (5,3,3), AO, AC, and CCI indicators are moving downwards;

(-) EURUSD (D):  The price is currently under the trend line. A rebound is possible after the NFP is released;

(-) EURGBP (D): the AC and CCI (20) indicators are moving downwards;

Built into the price:

(-) President of the Philadelphia Fed, Patrick Harker, has hinted at a rate hike in March;

(-) President of the Dallas Fed, Kaplan, says that it’s better to raise rates sooner rather than later;

(-) President of the San Francisco Fed, John Williams, says that March is a good time for the FOMC to seriously consider a rate hike;

(-) FOMC member Lael Brainard says that the US economy is growing, and that a rate hike would soon be appropriate;

(-) Head of the FOMC, Janet Yellen, has said that interest rates might be raised in March;

(-) Head of the Fed in Richmond, Lacker, has said that losing control over inflation could prove very costly;

(-) Vice-president of the Federal Reserve, Stanley Fischer, echoes his colleagues’ comments about rate hikes;

(+) François Bayrou, leader of the “Democratic Movement” party, has ruled out running for the presidency and thrown his weight behind independent candidate Emmanuel Macron;

(+) Marine Le Pen has had her EU parliamentary immunity from prosecution lifted for political reasons.

Is A Second OPEC Cut On The Cards?

By OilPrice.com

OPEC’s coordinated effort to curtail global supply has so far managed to put a floor under oil prices, which have been sitting modestly above US$50 since the deal was announced at the end of November last year. But resurging U.S. shale has been capping the upside, and Brent has not breached US$58 per barrel. Analysts and experts are now mostly predicting that oil prices will remain below US$60 this year.

The supply-cut deal has so far resulted in a surprisingly high OPEC compliance of more than 90 percent, thanks to the cartel’s leader and biggest producer, Saudi Arabia, which has been cutting deeper than pledged. But the market has already priced in this high compliance, and although oil prices jump for a few hours on every report of ‘extraordinary efforts’ and reassurance that members will strive for ‘full conformity’, they are stuck in a narrow band, kept in check by U.S. shale and record high inventories in America.

A key upside driver for prices would be an extension of the OPEC deal beyond its original expiry date at the end of June. Just over a month had passed since the beginning of the production cut deal when talk of extending the agreement started to intensify. OPEC is said to be prepared to extend the deal, and may also increase the cuts, if inventories fail to drop to a specified level, sources from the group told Reuters.

The cartel has always claimed that the primary goal of the cut was to draw down excessive supply and bring the market back into balance. According to its latest Monthly Oil Market Report published in February, total OECD commercial oil stocks fell in December 2016 (before the cuts took effect) to stand at 2.999 billion barrels. At this level, OECD commercial oil stocks were 299 million barrels above the five-year average, OPEC said.

The February Oil Market report by the International Energy Agency (IEA) said that OECD total oil stocks had already dropped nearly 800,000 bpd in the fourth quarter of 2016, the largest fall in three years. Inventories at end-December were below 3 billion barrels for the first time since December 2015. Global oil supplies plunged nearly 1.5 million bpd in January 2017, with both OPEC and non-OPEC countries producing less, the IEA noted. The agency also pointed out that the Brent contango narrowed in the first month of this year.

The contango has been steadily shrinking, and the futures curve suggests that the market is tightening, which could help to draw down excessive storage that has been kept for sale at a later date.

Although OPEC’s secondary goal may be to change the market structure to backwardation, the IEA said in its February report that stocks were still 286 million barrels above their five-year average and “by the end of 1H17 will remain significantly above average levels”.

So the end of the first half of 2017 may not be time enough to cause the oversupply to dwindle, and OPEC may decide at its meeting in May to further tighten the market by extending the period of the supply cut. The cartel and non-OPEC Russia have said that a possible extension is still too early to assess—a fact that will not keep them from talking up oil prices with hints and comments in the coming weeks and months.

On the flipside, a possible extension of the deal – assuming compliance is high and cheating is low – would give more confidence to the U.S. drillers to increase output at higher oil prices.

At the end of the day, OPEC may have to choose between giving rival higher-cost producers a reason to pump more, or cutting back its supply (and some market share) for the sake of higher prices and market balance. And of course, giving its own member states all the more reasons to cheat.

Link to original article: http://oilprice.com/Energy/Energy-General/Is-A-Second-OPEC-Cut-On-The-Cards.html

By Tsvetana Paraskova for Oilprice.com


EURUSD: When Price Pattern Trumps Other “Reasons”

Waves of market psychology often warn of trend changes before the news — see how

By Elliott Wave International

This was an eventful week in politics, monetary policy and the markets — and to many observers, the three seemed to be linked.

On Wednesday (March 1), the U.S. dollar did something it hadn’t done in almost two months: It got stronger. Two reasons were behind the move, said analysts: The Fed’s imminent rate hike, and, President Trump’s widely-covered address to Congress:

“The dollar hit a seven-week high on Wednesday after hawkish comments from two Federal Reserve officials late on Tuesday increased expectations that the U.S. central bank is closer to raising interest rates.” (CNBC, March 1)

“U.S. Treasury yields rose along with the U.S. dollar…as investors…gave a sigh of relief after President Donald Trump’s speech to Congress.” (Reuters, March 1)

It’s easy to attribute the dollar’s sudden strength to those two stories, yet this adds up to a classic case of what we call post-market action rationalization. Yes, these are logical and satisfying explanations, but here is a litmus test for both: Next time the Fed makes a hawkish comment or the President speaks, what will the dollar do then?

There is no way to answer this using conventional market-forecasting tools, other than to say: Let’s wait and see how the market reacts. But there is a better way.

As early as Monday (February 27), Elliott wave patterns in EURUSD, the euro-dollar exchange rate, already warned that the rally in the euro/weakness in the dollar was getting long in the tooth.

Said our forex-focused Currency Pro Service:

EURUSD
[Posted On:] February 27, 2017 03:47 PM

[Looking lower against 1.0679] (Last Price 1.0588): We are looking for a wave ‘(ii)’ double zigzag correction top to form… And with an impulsive looking pullback occurring from 1.0630, a correction top may have been set already at that 1.0630 high point.

“Double zigzag” is Elliott wave speak for a complex correction. Even if you’re not familiar with the method, the word “correction” tells you everything you need to know: It’s a countertrend move that will likely be more than fully retraced once the trend resumes.

Which it did — EURUSD fell, as expected. This March 3 Currency Pro Service chart shows you the extent of the euro decline/U.S. dollar rally (partial Elliott wave labels shown):

EURUSD
[Posted On:] March 03, 2017 03:14 PM

Now, it’s hard not to notice that since that decline, EURUSD has rebounded. But again, the move is most likely part of (you guessed it) a correction.

So, no matter what you read in the news regarding the reasons for this latest euro rally, know that when the euro/dollar trend changes again, so will the mainstream’s “reasons.”


Introduction to the Wave Principle Applied

See how Elliott waves can improve your trading

In this free 15-minute video, EWI Senior Analyst Jeffrey Kennedy explains how to take the Wave Principle and turn it into a trading methodology. You’ll learn the best waves to trade, where to set your protective stop, how to determine target levels, and more.

Get free, instant access now

This article was syndicated by Elliott Wave International and was originally published under the headline EURUSD: When Price Pattern Trumps Other “Reasons”. EWI is the world’s largest market forecasting firm. Its staff of full-time analysts led by Chartered Market Technician Robert Prechter provides 24-hour-a-day market analysis to institutional and private investors around the world.

The “Trump Bump” Was in the Cards LONG Before Trump

How to breach limitations of conventional market forecasting

By Elliott Wave International

[Editor’s Note: The text version of the story is below.]

Get the Free Elliott Wave Tutorial

Learn how you can apply the Wave Principle to improve your trading and investing in this free 10-lesson tutorial. You’ll learn:

  • What the basic Elliott wave progression looks like
  • Difference between impulsive and corrective waves
  • How to estimate the length of waves
  • How Fibonacci numbers fit into wave analysis
  • Practical application tips for the method

Get Details and Instant Access


It’s been a tough time for the stock market bears.

You just have to look at these recent headlines:

  • U.S. stock futures hit fresh highs (Marketwatch, Feb. 20)
  • Stocks post best winning streak in 25 years (CNN Money, Feb. 16)
  • Stocks Continue Record-Breaking Run (Nasdaq.com, Feb. 15)

As a result, a prominent Canadian market participant has thrown in the towel (zerohedge.com, Feb. 17):

The CEO of Fairfax Financial … announced that he is covering his firm’s equity hedges after suffering a $1.1 billion net loss on its investments in Q4, and $1.2 billion for all of 2016.

But the financial pain hardly ends there. Look at this chart with comments from the Wall Street Journal (Feb. 16):

It is the buzz of Wall Street: a five-day, 15% plunge in a U.S. mutual fund whose bearish bets were undone by the S&P 500’s latest run to fresh records.

Many market commentators say stocks have been rising because of the new administration’s policies (Yahoo Finance, Feb. 20):

Much of the post-US election rally in the stock market has been attributed to President Donald Trump’s promises for tax cuts and deregulation.

But long before the election, Elliott wave price patterns already told our subscribers to prepare for a market rally.

Our just-published February Elliott Wave Theorist reviews several charts we published early in 2016. Here’s one of those charts along with commentary from the new Elliott Wave Theorist:

The January and February 2016 issues of The Elliott Wave Theorist, written as stocks were plunging in highly volatile fashion, called for a bottom and labeled the stock indexes as having finished A, B and C of wave (4), a corrective formation dating back to the high of 2015.

In other words, our analysis revealed that the market was starting the next leg up.


Get the Free Elliott Wave Tutorial

Learn how you can apply the Wave Principle to improve your trading and investing in this free 10-lesson tutorial. You’ll learn:

  • What the basic Elliott wave progression looks like
  • Difference between impulsive and corrective waves
  • How to estimate the length of waves
  • How Fibonacci numbers fit into wave analysis
  • Practical application tips for the method

Get Details and Instant Access

This article was syndicated by Elliott Wave International and was originally published under the headline The “Trump Bump” Was in the Cards LONG Before Trump. EWI is the world’s largest market forecasting firm. Its staff of full-time analysts led by Chartered Market Technician Robert Prechter provides 24-hour-a-day market analysis to institutional and private investors around the world.

Nicola Mining 3 Juniors in 1? #Copper #Gold #Silver

By Peter Epstein, CFA, MBA   [email protected]   http://EpsteinResearch.com

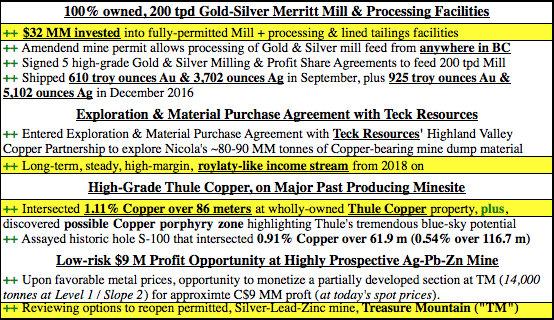
Nicola Mining Inc. (TSX-V: NIM) / (OTC: HUSIF) has three primary, potential company-making assets, two nearing high-margin, steady-state cash flow.  The third, Treasure Mountain, offers both a shovel ready, up to C$9 million profit opportunity (see below) plus, longer term, a potential company-making silver-lead-zinc mine on a past-producing mine site.  Regarding the first two assets, there’s the valuable, (virtually impossible to replicate in BC) gold-silver Merritt Mill and processing facility centrally located near Merritt, BC, and an “Exploration & Material Purchase Agreement” with Teck Resources (NYSE: TECK) / (TSX: TCK) to monetize waste rock from Nicola’s 100% owned Thule Copper project (another potential company-maker).  NOTE: {Please see March 8th Corporate presentation video}.

Valuable Cash Flowing & Exploration / Development Assets

Merritt Mill in BC, Canada

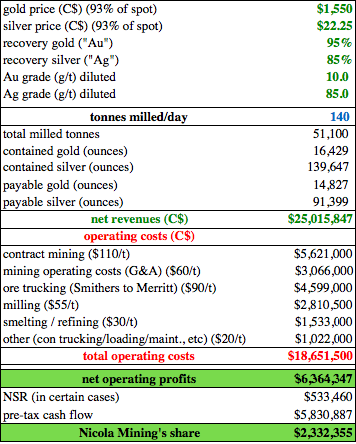
At current 200 tpd capacity, grade assumptions and precious metal prices, the Mill should be good for about ~$2.3 million in operating income this year.  NOTE:  (based on publicly available information, including data from peer toll milling operations).  Add an additional ~$2.5 million/yr from the Teck Material Purchase Agreement from 2018 on.  Combined, Nicola’s sitting on two assets that could generate ~$5 million next year, with considerable upside from higher grade ore, higher spot prices and expanded Mill capacity.

Below is an estimate of what (I think) the milling operations could look like in 2017.  This is an indicative model, a composite of various milling & profit share agreements, based on Company press releases.

All else equal, if the Company were to process 20% higher grade ore (from some of the profit sharing agreements), cash flow would grow from ~$2.3 to ~$4.2 million.  In a scenario with 10% higher spot prices, Nicola’s share of operating profits would be ~$6.0 million, with more upside from ramping up throughput.  Adding ~$2.5 million from the Teck waste material deal approaches ~$8.5 million in company-wide cash flow from 2018 on.  NOTE:  {this is not a forecast by me or the Company and does not contemplate the potential for increased throughput}.

Both earnings streams are high quality and expected to be long-lived, attributes that typically command strong market multiples.  For example, precious metal streaming companies Franco-Nevada (NYSE: FNV) and Silver Wheaton (NYSE: SLW) trade at an average 20x Enterprise Value (“EV”) to EBITDA.  Unlike FNV and SLW, Nicola has $77 million in tax credits, shielding it from paying cash taxes for years to come.  The following chart shows implied share prices across various EBITDA and market multiple scenarios.  Nicola Mining is currently at $0.22/share, (down 25% from $0.29 on February 17th).

Thule Copper Project

Nicola has achieved the elusive dream of most junior mining companies, positive cash flow to meaningfully self-fund exploration.  Even better, both exploration projects are on past producing sites.  They could be, yes I’ll say it again, company makers.  Past production on Nicola’s Thule Copper property featured Craigmont, the largest open-pit copper mine in North America at the time.  It operated at 1.28% Cu open pit, and closer to 2% Cu underground.

The Thule Copper project is located 14km northwest of Merritt, British Columbia and covers 10,084 hectares (~24,920 acres) along the southern end of the Guichon Batholith. The Company recently completed a diamond drilling program designed to test 3 distinct zones on the property, referred to as the Embayment, Titan Queen, and Eric. Total diamond drilling for the 2016 program was 1,084 meters in 5 holes through the Embayment Zone located approximately 1 km northwest of the past-producing Craigmont Mine.  A follow-up drill program will be designed to determine continuity of mineralization further west along strike and at depth.  Drill results represent an important near-term catalyst.

Craigmont produced high-grade copper in a skarn setting but never encountered what management believes is an underlying porphyry.  New evidence of possibly something Big was uncovered during the Company’s aforementioned drilling last year.  Drill results were a success, all holes hit mineralization and blockbuster hole THU-002 in the Embayment zone returned 1.11% copper over a remarkable 86 meter width.

Treasure Mountain

100% owned Treasure Mountain, a former operating mine, has a shovel ready, opportunity to mine already permitted Level 1 Stope 2 and ship mill feed to its Merritt Mill.  Treasure Mountain’s silver, lead, zinc endowment consists of 51 mineral tenures, 21 legacy claims, 100 cell units and five crown grants totaling 2,850 hectares (~7,040 acres).  The Company maintains the option of reopening Level 1 to extract silver from Stope 2 at anytime and could realize indicative economics as shown below.  Given that the Company is not starved for capital and that management believes precious and base metal prices are likely to move higher, there’s no rush to exploit this opportunity.

This indicative, up to C$ 9 million, one-time cash flow (over ~9 month mining period) would mitigate (but not necessarily nullify) the need for equity dilution.  Combined with potential cash flow outlined above, Thule Copper could be robustly explored this year and next.

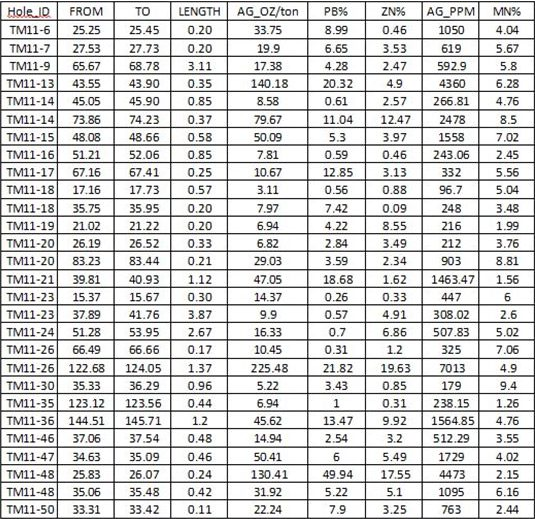
As mentioned, Treasure Mountain has tremendous blue-sky potential.  One of the best reported holes is TM11-36, with a 1.2 meter interval containing 1,565 g/t Ag (45.6 opt), 13.5% Pb & 9.9% Zn.  Below is more dill data from Treasure Mountain.

Conclusion

Nicola Mining Inc. (TSX-V: NIM) / (OTC: HUSIF) can be viewed as 3 companies in 1, it’s not a cash burning, single-asset junior mining company.  Importantly, the sum of the parts is greater than the whole because internally generated (tax-free) profits from Milling can be invested into the Company’s other highly prospective projects (Thule Copper & Treasure Mountain).  These two assets are not merely lottery tickets (like most green field projects), each is host to very significant prior mining, development & exploration activities in a world-class mining jurisdiction.

Nicola’s Merritt Mill is not just a $30 million+ (invested capital) 200 tpd processing facility, it’s the only Mill in BC allowed to accept feed from anywhere in the Province, and in many cases the ONLY place otherwise stranded mines can send ore.  Therefore, on both an operating basis (cash flow multiple) analysis (see above), and on replacement value, the Mill more than covers the entire market cap of the Company.  That means an investor today gets Thule Copper & Treasure Mountain for Free.  But wait, don’t take my word for it, check out Nicola’s website and click on the “Projects” tab, and review this March 8th Corporate presentation video.

Still not convinced?  CEO Peter Espig is happy to hear from prospective investors, please email me at [email protected] to discuss.

Disclosures:  The content of this article is for illustrative purposes only. Readers fully understand and agree that nothing contained herein, written by Peter Epstein of Epstein Research[ER] including but not limited to, commentary, opinions, views, assumptions, reported facts, estimates, calculations, etc. is to be considered, in any way whatsoever, implicit or explicit investment advice. Further, nothing contained herein is a recommendation or solicitation to buy or sell any security. The content contained herein is not directed at any individual or group. Mr. Epstein and [ER] are not responsible, under any circumstances whatsoever, for investment actions taken by the reader. Mr. Epstein and [ER] have never been, and are not currently, a registered or licensed financial advisor or broker/dealer, investment advisor, stockbroker, trader, money manager, compliance or legal officer, and they do not perform market making activities. Mr. Epstein and [ER] are not directly employed by any company, group, organization, party or person. Shares of Nicola Mining are highly speculative, not suitable for all investors. Readers understand and agree that investments in small cap stocks can result in a 100% loss of invested funds. It is assumed and agreed upon by readers that they consult with their own licensed or registered financial advisors before making investment decisions.

At the time this article was posted, Peter Epstein owned shares in Nicola Mining and the Company was a sponsor of [ER]. Readers understand and agree that they must conduct their own research, above and beyond reading this article. While the author believes he’s diligent in screening out companies that are unattractive investment opportunities, he cannot guarantee that his efforts will (or have been) successful. Mr. Epstein & [ER] are not responsible for any perceived, or actual, errors including, but not limited to, commentary, opinions, views, assumptions, reported facts & financial calculations, or for the completeness of this article or future content. Mr. Epstein & [ER] are not expected or required to subsequently follow or cover events & news, or write about any particular company or topic. Mr. Epstein and [ER] are not experts in any company, industry sector or investment topic.

Interview with Justin Seitz: Author & Creator of Hunchly Online Investigation Tool

By Zac Storella, CountingPips.com

An interview with a security specialist that created a tool to help with online security research, it can help with online investment research as well

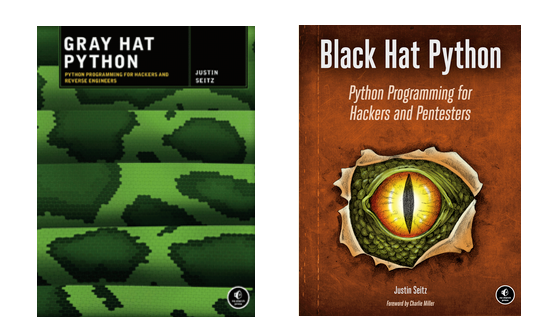
Today I am very pleased to bring you my latest interview with Justin Seitz, an online investigator, author, blogger and the creator of Hunch.ly, a software tool for online investigators. Justin is the author of the programming books (Gray Hat Python and Black Hat Python), has been written up on Motherboard (Vice) and contributes to the very popular investigation website bellingcat.com as well at his own intelligence training site automatingosint.com.

I  got to converse with Justin a little bit after discovering his Hunch.ly program when I was looking for software that would help me organize and contain my investment research ideas in one place instead of many, many hard to organize places. Hunch.ly has proven to be an enormous help in this regard and I would absolutely recommend finance professionals or other researchers to take a look at this software if they are in the same boat as me and trying to find a new way to catalog their ideas (and no, I am not getting paid to say this!).

I hope you enjoy the interview below with my questions in bold. In the interview, OSINT refers to open source intelligence.

Q: Can you give us a brief history of your background and what drove you to being an investigator?

I spent about a decade in the computer security field doing offensive work. This means we were a group of people who were focused on breaking into things, and not defending them. A big part of our penetration tests were performing reconnaissance against a target which had a significant OSINT component. As part of that, I began to get more and more interested in looking at how I could apply OSINT in a more general sense and not just in the context of a penetration test.

Q: Did you have any specific success stories or investigations that gave you an “ah-ha” moment, that maybe gave you the confidence in your skills and piqued your interest to keep going further?

There actually isn’t any one particular case that sticks out. I know that in my penetration tests there have been times where you find some really amazing pieces of information that you know you are going to be able to leverage for a successful attack. I often find with investigations that you can either find smoking guns, or very little. It’s pretty rare to get lukewarm leads in between. The cases with little information found, those are the ones that keep you up at night.

Q: Can you tell us what Hunch.ly is and what spurred you on to create this tool?

Hunchly was actually a tool that I had developed only for my own purposes. I had a big interest in counterterrorism research, and part of that was just me poking around and looking at various groups, social media profiles, forums, etc. At one point there was an event that occurred and, in my travels, I remembered seeing the folks involved with that event. When I went to go back and look at their social media profiles, the profiles were gone.

At this point I realized that I hadn’t taken any screenshots or done any data capture. A huge fail. So I vowed to never make that mistake again and decided to build a tool that would automatically take full content snapshots of every page that I viewed.  Eventually I started using this tool during my consulting gigs, and people would often ask why I always seemed to know when to take a screenshot or capture information. I had to confess that I had this little tool I had built and that it did it for me.

From there, Hunchly was born.

Q: Who do you feel are the ideal candidates to use Hunch.ly?

There are a number of good candidates for Hunchly users. Although it is a tool built for investigators there are all kinds of people using it. I have travel bloggers, financial analysts, due diligence researchers, forensics practitioners, law enforcement, journalists, and even system administrators who use it to assemble their research when they are solving technical problems.

Q: You have written two highly regarded books, Black Hat Python and Grey Hat Python, can you explain who the audience for those books is and what kind of skills one would expect to acquire reading those?

For both books they are written for hackers, reverse engineers, and pentesters. They do have a bit of a higher bar in terms of having some technical proficiency and some coding skills required to get through them.


Q: What do you feel are the most important skills one needs to become a good investigator?

Just being tenacious. Often the best investigators don’t always have the best tech or the newest tricks but they just keep chasing leads, keep reviewing evidence, and repeating this cycle until they find what they are looking for or exhaust all the possibilities.

The more tenacious you are, the better your investigations will be.

Q: With so many hacks and security issues in the news of recent years with more surely to follow, it would seem logical that the intelligence industry would be experiencing explosive growth. Do you see this as the case? What Trends do you see happening currently in security?

I think that the intelligence industry has been growing pretty steadily for the last 20 years or more and will continue to do so. There is more information, more people, and more online platforms popping up each year. I always hesitate to talk about trends or future events in security because sadly we only need to look backwards one calendar year to see the same things happening in our current times. Although IOT has been a hot topic in 2016-2017, it is really just a dead horse that was beaten a long time ago. Folks just didn’t listen.

Q: In one of your posts, you use the python library sci-kitlearn (a machine learning library) for an investigation, is machine learning becoming a big part of the security field?

I think that as the really smart people doing the ML stuff begin to make it more accessible to those of us who don’t have a math background, we are going to see more and more tools that use it. I think we also need to continually remind ourselves that humans will always be the best analysts.

Q: Can you tell us what tools or resources, in addition to hunch.ly, you use to further your research and investigations?

It really depends from investigation to investigation. A few of my regular go to sites are IntelTechniques.com for the forum, EchoSec.net for geographic profiling and hands down DomainTools.com for doing any investigations related to websites or domains. Also everyone should bookmark osintframework.com as it is full of resources.

Q: With automatingosint.com and hunch.ly being such great resources on security and investigations, are there any other online security/investgation websites out there that you would recommend for our readers?

I know I am missing a bunch of others, but Bellingcat.com is a fantastic place to see open source investigations take place by real pros.

Q: For our interested readers, what would you suggest as the best way to follow along with what you are doing? 

Twitter: @jms_dot_py
Email: [email protected]

Hunchly: https://www.hunch.ly (use discount code countingpips for 10% off)
OSINT Training: https://register.automatingosint.com

Thank you Justin for taking the time to share your story and insight with us.  

To read more from Justin and his investigations here are a few very interesting articles:


Ichimoku Cloud Analysis 09.03.2017 (GBP/USD, GOLD)

Article By RoboForex.com

GBP USD, “Great Britain Pound vs US Dollar”

GBP USD, Time Frame H4. Indicator signals: Tenkan-Sen and Kijun-Sen are still influenced by “Dead Cross” (1) and D “Dead Cross” (3). Ichimoku Cloud is still heading down (2); Chinkou Lagging Span is below the chart. Short-term forecast: we can expect resistance from Tenkan-Sen, and a further decline of the price.

GBP USD, Time Frame H1. Indicator signals: Tenkan-Sen and Kijun-Sen intersected below Kumo Cloud and formed “Dead Cross” (1). Ichimoku Cloud is going down (2); Chinkou Lagging Span is on the chart. Short-term forecast: we can expect resistance from the cloud’s downside border, and decline of the price.


XAU USD, “Gold vs US Dollar”

XAU USD, Time Frame H4. Indicator signals: Tenkan-Sen and Kijun-Sen are still influenced by “Dead Cross” (1); D Tenkan-Sen and D Kijun-Sen also intersected and formed D “Dead Cross” (3). Ichimoku Cloud is moving to the downside (2) and expanding, Chinkou Lagging Span is below the chart, and the price is on D Senkou Span A. Short‑term forecast: we can expect support from D Senkou Span A, resistance from W Tenkan-Sen, and a further decline of the price.


RoboForex Analytical Department

Article By RoboForex.com

Attention!
Forecasts presented in this section only reflect the author’s private opinion and should not be considered as guidance for trading. RoboForex LP bears no responsibility for trading results based on trading recommendations described in these analytical reviews.