The EUR/USD pair has completed the descending impulse along with the correction. Today, the price may form another descending wave to break the low of the first descending impulse. Right now, the pair is consolidating to break 1.0580. The market is expected to reach the local target at 1.0555. After that, the instrument may return to 1.0580 and then continue falling to reach 1.0523.
GBP USD, “Great Britain Pound vs US Dollar”
The GBP/USD pair is still forming the third descending wave with the target at 1.2200. After that, the instrument may consolidate, break the range to the upside, and start another correction with the target at 1.2377. Later, in our opinion, the market is expected to form the fifth structure to reach 1.2067.
USD CHF, “US Dollar vs Swiss Franc”
The USD/CHF pair is forming another ascending wave. Possibly, today the price may reach 1.0135 and then consolidate to the upside with the local target at 1.0200.
USD JPY, “US Dollar vs Japanese Yen”
The USD/JPY pair is consolidating. Possibly, today the price may fall towards 113.40. Later, in our opinion, the market may grow with the target at 115.30 and complete the correction. After that, the instrument may reverse and start falling to reach 111.10.
AUD USD, “Australian Dollar vs US Dollar”
The AUD/USD pair is forming another correction, which may soon complete. Possibly, today the price may break the ascending channel and start falling towards the local target at 0.7527.
USD RUB, “US Dollar vs Russian Ruble”
The USD/RUB pair is being corrected towards 57.64. Possibly, today the price may reach this level and start growing with the target at 58.73. In fact, the instrument is expected to start forming the third ascending wave with the local target at 60.00.
XAU USD, “Gold vs US Dollar”
Gold has completed the ascending impulse and right now is being corrected. Possibly, today the price may continue growing to reach 1235.30, break it, and then reach the local target at 1240.00.
BRENT
Brent has completed the ascending structure as a correction. Possibly, today the price may form another descending wave the local target at 54.00.
RoboForex Analytical Department Article By RoboForex.com
Attention! Forecasts presented in this section only reflect the author’s private opinion and should not be considered as guidance for trading. RoboForex LP bears no responsibility for trading results based on trading recommendations described in these analytical reviews.
On Monday, trading on the euro closed down. After an unsuccessful attempt by buyers to take the price above 1.0630, the euro fell against the dollar to 1.0575. A touch of volatility was to be found during the day yesterday as news came in from France. Ex-Prime Minister Alain Juppe ruled out taking part in the French presidential elections.
The euro fell as US 10-year bond yields rose during trading in New York. US 10-year bond yields: 2.494% (up 0.72% from 06/03/17). In Asia, bond yields rose by 0.12% to 2.496%.
Market expectations:
In Asia, the euro is in a sideways trend, staying at around the 1.0581 level. From the intraday price model on the hourly timeframe, the euro is expected to fall further to 1.0563. The euro is unlikely to be able to make any gains against the dollar in the wake of the ECB’s meeting (on Thursday).If the target is reached during the European session, then we can expect a drop to 1.0550 when trading gets underway in the US.
Although the market now puts the probability of an interest rate hike by the Fed in March at 80%, the dollar will continue to receive support until their meeting on the 15th of this month. CME Group’s FedWatch data shows that the likelihood of a rate hike has gone up from 79.7% to 86.4%, from 81.9% to 87.5%, and from 90.2% to 92.7% for March, May, and June respectively.
Disregarding the news from France, my predictions for Monday came off in full. Monday worked against Friday’s rally.
Trading on the EUR/USD pair is in a sideways trend at 1.0582. If we overlay the Fibonacci grid on the upwards movement from 1.0495 to 1.0640, then the correction was over 38%. The 50% mark is located 5 pips above the 67th degree. The trend line on the current hourly bar runs through 1.0563.
Looking at cycles and historical patterns, I’m getting the idea that we should expect a further drop in the euro. I’m leaning towards a drop to 1.0599 (22.5 degrees). The first target for the 67th degree is 1.0563 and the second is 1.0550 (61.8% of the growth from 1.0495 to 1.0640).
The Lb balance line and the trend line (average line with period 55) will act as a support for buyers. They may not be able to resist given that the ECB is meeting on Thursday. Keep an eye on the dynamics of US and German 10-year bond yields. US 10-year bond yields are set to surpass 2.52%. From there, a target of 2.55 will be made. If US 10-year bond yields rise sharply, we could see the euro fall to 1.0511 (112 degrees).
Positives for the euro (+):
Fundamental:
(+) US president Donald Trump favours a weaker dollar;
(+) The threshold for acceptable US government debt of 20.1 trillion USD may be reached by March this year. This will create headaches for new US president Donald Trump. A new law on the debt ceiling will come into force on the 16th of March 2017;
(+) Greece may need less money than the IMF had planned for;
Technical (short-term):
(+) According to data from 28/02/17, large speculators on the Chicago Exchange have increased their short and long positions. Long positions have grown by 10,546 to 142,762 contracts, while short positions have grown by 4,293 to 187,304 contracts. Net short positions have fallen from 50,779 to 44,542 contracts.
(+) EURGBP (D): the cross is in a phase of growth. The AO and AC are moving downwards;
(+) EURGBP (W): the CCI (20) and the Stochastic (5,3,3) are moving downwards;
(+) EURUSD (D): between the price and the CCI is a bullish divergence, the price rebounded from the minimum on 22/02/17, the CCI has intersected the -100 level from bottom to top, the fast line has intersected the slow line on the Stochastic (5,3,3) and the trend line from 02/02/17 has been broken through;
(+) EURUSD (W): the Stochastic (5,3,3) is trying to reverse upwards;
(+) EURUSD (M): the Stochastic (5,3,3) is moving upwards;
Negatives for the euro (-):
Fundamental:
(-) The ECB has no plans to curtail its QE program. According to the minutes of the latest meeting, most members of the Governing Council don’t believe it necessary to reduce the amount of stimulus (long-term impact);
(-) According to CME Group FedWatch Tool, the probability of a rate hike in March has grown from 79.7% to 86.4%, in May from 81.9% to 87.5%, and in June from 90.2% to 92.7%;
(-) There’s a high level of political uncertainty in Europe (French elections and Brexit). Ex-Prime Minister Alain Juppe has ruled himself out of participation in the French presidential elections;
(-) Greece is unable to reach a deal with its creditors for financial assistance;
(-) The ECB will hold a meeting on Thursday;
Technical factors (short-term):
(-) According to data from 28/02/17, small speculators have increased their short positions by 1,481 contracts and reduced their long positions by 210;
(-) German 10-year bond yields: 0.340% (down 1.16% from 06/03/17). US 10-year bond yields: 2.494% (up 0.72% from 06/03/17) In Asia, bond yields grew by 0.12% to 2.496%;
(-) Long/short ratio as of 7:30 EET: 43%/56%, lots: 14073/18231 (previous day: 15857/13262), positions: 40401/44557 (previous day: 38445/28152)
(-) EURUSD (W): AO and AC are moving downwards;
(-) EURGBP (D): the cross has reached the trend line. Buyers are attempting to induce a rebound from it. The Stochastic (5,3,3) has crossed downwards.
Built into the price:
(-) President of the Philadelphia Fed, Patrick Harker, has hinted at a rate hike in March;
(-) President of the Dallas Fed, Kaplan, says that it’s better to raise rates sooner rather than later;
(-) President of the San Francisco Fed, John Williams, says that March is a good time for the FOMC to seriously consider a rate hike;
(-) FOMC member Lael Brainard says that the US economy is growing and that a rate hike would soon be appropriate;
(-) Head of the FOMC, Janet Yellen, has said that interest rates might be raised in March;
(-) Head of the Fed in Richmond, Lacker, has said that losing control over inflation could prove very costly;
(-) Vice-president of the Federal Reserve, Stanley Fischer, echoes his colleagues’ comments about rate hikes;
(+) François Bayrou, leader of the “Democratic Movement” party, has ruled out running for the presidency and thrown his weight behind independent candidate Emmanuel Macron;
(+) Marine Le Pen has had her EU parliamentary immunity from prosecution lifted for political reasons.
Trading opportunities on the currency pair: On Friday, buyers gained a foothold under the minimum 80.45 from 23/02/16. A double top offers a good opportunity for taking a short position. The target for this forecast is ¥78.41 (61.8% from the range ¥80.45 – ¥83.81). I’m allowing for a fall in the NZD/JPY rate to the TR trend line at ¥78. This fall will not happen if the upper boundary of the A-A channel is broken through.
Background:
The previous trading idea on this currency pair was published on the 4th of May 2015. At the time of writing, the pair was trading at ¥90.51. After the trend line was broken through on the NZD/USD currency pair, a similar breakthrough was expected on the NZD/JPY pair, with a target of ¥87.27. The trend line was broken through on the 6th of May, and the target reached on the 11th of June. By the end of August, the kiwi dollar had fallen to ¥72.42.
Current situation:
As of now, a bearish signal has appeared on the daily chart; the price has broken through the ¥80.45 level. The kiwi dollar has been in a sideways trend since the middle of December. After an unsuccessful attempt at breaking through the ¥83.74 level on the 27th of January this year, bulls started closing their long positions. Finally, as the rate dropped below ¥81.20 (first confirmation), a double top formation appeared. On Friday, sellers moved the minimum of ¥80.45 on 23/12/16 to ¥80.16.
The double top provides a nice opportunity to take out some short positions. My forecasted target is ¥78.41 (61.8% from the range ¥80.45 – ¥83.81). As an intermediate target, we have ¥79.55 (27.2% from the range ¥80.45 – ¥83.81).
The Reserve Bank of New Zealand (RBNZ) took a neutral tone in their last sit-down. Their press release gave no hints about a softening of monetary policy, but neither did it say anything about tightening. The RBNZ is still concerned about a high kiwi dollar, so the central bank is unlikely to raise interest rates until the parliamentary elections to be held on the 23rd of September. Talks about a rate hike will only begin after this.
I’m allowing for a drop in the NZD/JPY rate to the trend line TR at ¥78. However, this scenario will not play out if the upper boundary of the A-A channel is broken through.
GBP USD, Time Frame Weekly. Indicator signals: Tenkan-Sen and Kijun-Sen intersected and formed “Dead Cross” (1). Ichimoku Cloud is heading down (2), Chinkou Lagging Span is getting closer to the chart, and the price is on Tenkan-Sen – Kijun-Sen. Short-term forecast: we can expect resistance from Tenkan-Sen, and decline of the price.
GBP USD, Time Frame Daily. Indicator signals: Tenkan-Sen and Kijun-Sen intersected above Kumo Cloud and formed “Dead Cross” (1). Ichimoku Cloud is going up (2), Chinkou Lagging Span is below the chart, and the price is below the lines. Short-term forecast: we can expect resistance from Senkou Span B, and decline of the price under the cloud.
XAU USD, “Gold vs US Dollar”
XAU USD, Time Frame Daily. Indicator signals: Tenkan-Sen and Kijun-Sen are still influenced by “Golden Cross” (1); Tenkan-Sen is directed downwards. Ichimoku Cloud is moving to the upside (2), Chinkou Lagging Span is close to the chart, and the price is on Kijun-Sen. Short‑term forecast: we can expect support from Kijun-Sen, resistance from Tenkan-Sen, and decline of the price towards the cloud’s upside border.
Attention! Forecasts presented in this section only reflect the author’s private opinion and should not be considered as guidance for trading. RoboForex LP bears no responsibility for trading results based on trading recommendations described in these analytical reviews.
At the daily chat, the EUR/USD pair is probably forming the descending impulse in the wave (C). Earlier, the price completed the triangle in the wave (B). Consequently, in the nearest future the market may continue moving downwards in the wave 3 of (C).
As we can see at the H4 chart, the pair probably formed the wedge in the wave [i]. As a result, during the next several days the market may form the wave [ii] in the form of the zigzag. On a shorter timeframe, after finishing the wave (a), the price may start forming the correctional wave (b).
GBP USD, “Great Britain Pound vs US Dollar”
Possibly, the GBP/USD pair completed the triangle in the wave (iv) of [iii]. In this case, the price may resume falling in the wave (v) and break the local lows. However, after finishing the wave (v), the market may start forming a long consolidation range in the wave [iv].
More detailed structure of this scenario is shown on the H4 chart. It’s highly likely that the pair is forming the descending impulse, which may be the wave i of (v). As a result, next Monday the price may reach a new local low.
USD JPY, “US Dollar vs Japanese Yen”
Probably, after finishing the impulse in the wave 1, the USD/JPY pair formed the zigzag in the wave 2. Taking into account that the bullish impulse in the wave [i] was completed as well, during the next several days the market may grow the wave [iii] of 3.
At the H4 chart, the pair completed the ascending impulse in the wave (i) and, as a result, started the current correction. Possibly, the wave (ii) is taking the form of the flat. After finishing the correction, the market may resume moving upwards in the wave (iii) of [iii].
AUD USD, “Australian Dollar vs US Dollar”
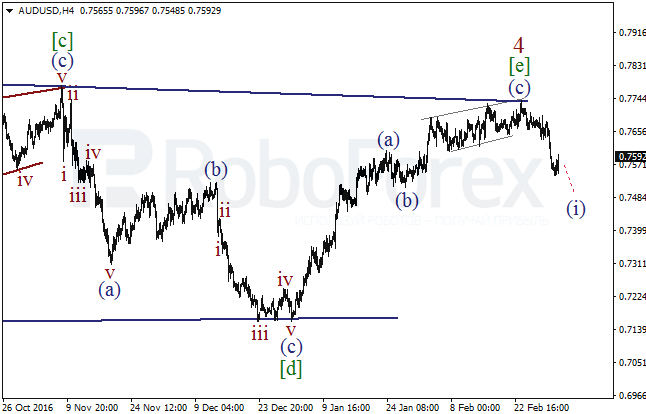
At the daily chat, the AUD/USD pair probably completed the triangle in the wave 4 and rebounded from its upside border. Consequently, during the next several weeks the price may fall while forming the wave 5 of (3).
As we can see at the H4 chart, the pair completed the zigzag[e] of 4 with the diagonal triangle(c) inside it. As a result, to confirm a new decline, later the price has to form the descending impulse in the wave (i).
Attention! Forecasts presented in this section only reflect the author’s private opinion and should not be considered as guidance for trading. RoboForex LP bears no responsibility for trading results based on trading recommendations described in these analytical reviews.
Friday’s trading on the euro closed in the green. The EUR/USD rate restored from a minimum of 1.0495 to 1.0623 (+128 pips). This began as a correctional movement against the euro’s weakening over the previous two days. In Europe, the euro strengthened against the dollar to 1.0573, and after Janet Yellen’s speech, to 1.0623.
In her Friday address, the head of the US Fed confirmed that the central bank is set to increase interest rates during their meeting on the 15th of March. Given that traders were buying dollars on the back of speeches from other Fed members, they were able to make a profit following Yellen’s speech as it brought about a sharp drop in the dollar across the whole currency market.
According to latest data from CME Group’s FedWatch, the probability of a rate hike in March has gone up from 75.3% to 79.7%, in May from 79.0% to 81.5% and in June from 89.6% to 90.2%. US 10-year bond yields have fallen by 1.14% to 2.482%.
Market expectations:
Today is Monday, correction day. The economic calendar is fairly empty. From my forecast, I’m expecting some correctional movement to 1.0572 against Friday’s rally. The trend line from 02/02/17 has been broken on the daily timeframe. The market share for buyers has surpassed that of sellers. If short positions on the euro continue to increase, the single currency will move towards 1.0650.
On Friday, the target I set was reached. I didn’t even try to predict the fluctuations that would follow Yellen’s speech. Given that FOMC members had prepared the market for a rate hike before Yellen’s speech, after she had spoken, the selling of short positions intensified.
The FOMC is set to meet on the 15th of March. Given uncertainty around Trump’s economic policies, there is a chance that interest rates won’t be raised this month, as many expect. I think this has been brought about by a sharp correction of the dollar.
If on Friday movement was all in one direction, then today I’m expecting the pair to move in the opposite direction. US bond yields are falling. Despite this, I’m expecting the euro to fall to the 45th degree (1.0572). The 45th and 67th degrees from the minimum 1.0495 coincide with the 67th and 45th degrees from the maximum 1.0623.
Positives for the euro (+):
Fundamental:
(+) US president Donald Trump favours a weaker dollar;
(+) The threshold for acceptable US government debt of 20.1 trillion USD may be reached by March this year. This will create headaches for new US president Donald Trump. A new law on the debt ceiling will come into force on the 16th of March 2017;
(+) Greece may need less money than the IMF had planned for;
(+) François Bayrou, leader of the “Democratic Movement” party, has ruled out running for the presidency and thrown his weight behind independent candidate Emmanuel Macron;
(+) Marine Le Pen has had her EU parliamentary immunity from prosecution lifted for political reasons;
Technical (short-term):
(+) According to data from 28/02/17, large speculators on the Chicago Exchange have increased their short and long positions. Long positions have grown by 10,546 to 142,762 contracts, while short positions have grown by 4,293 to 187,304 contracts. Net short positions have fallen from 50,779 to 44,542 contracts.
(+) EURGBP: On the daily timeframe, the cross is in a phase of growth. A downwards reversal is possible;
(+) EURUSD (D): between the price and the CCI is a bullish divergence, the price rebounded from the minimum on 22/02/17, the CCI has intersected the -100 level from bottom to top, the fast line has intersected the slow line on the Stochastic (5,3,3) and the trend line was broken through on 02/02/17;
(+) EURUSD (M): The monthly Stochastic indicator (5,3,3) is moving upwards;
(+) German 10-year bond yields: 0.356% (up 0.28% for 03/03/17). US 10-year bond yields: 2.482% (down 0.30% on 03/03/17) In Asia, bond yields fell by 0.71% to 2.474%;
(+) Long/short ratio as of 7:51 EET: 54%/45%, lots: 15857/13262 (previous day: 7309/26242), positions: 38445/28152 (previous day: 24247/61257)
Negatives for the euro (-):
Fundamental:
(-) The ECB has no plans to curtail its QE program. According to the minutes of the latest meeting, most members of the Governing Council don’t believe it necessary to reduce the amount of stimulus (long-term impact);
(-) According to CME Group FedWatch Tool, the probability of a rate hike in March has grown from 75.3% to 79.7%, in May from 79.0% to 81.5%, and in June from 89.6% to 90.2%;
(-) Political risks in Europe are growing (French elections and Brexit);
(-) Greece is unable to reach a deal with its creditors for financial assistance;
Technical factors (short-term):
(-) According to data from 28/02/17, small speculators have increased their short positions by 1,481 contracts and reduced their long positions by 210;
(-) EURUSD (W): AO and AC are moving downwards; the weekly Stochastic (5,3,3) is trying to reverse upwards;
(-) EURUSD (W): The Stochastic, AO, AC and CCI are moving downwards.
Built into the price:
(-) President of the Philadelphia Fed, Patrick Harker, has hinted at a rate hike in March;
(-) President of the Dallas Fed, Kaplan, says that it’s better to raise rates sooner rather than later;
(-) President of the San Francisco Fed, John Williams, says that March is a good time for the FOMC to seriously consider a rate hike;
(-) FOMC member Lael Brainard says that the US economy is growing, and that a rate hike would soon be appropriate;
(-) Head of the FOMC, Janet Yellen, has said that interest rates might be raised in March;
(-) Head of the Fed in Richmond, Lacker, has said that losing control over inflation could prove very costly;
(-) Vice-president of the Federal Reserve, Stanley Fischer, echoes his colleagues’ comments about rate hikes.
Here is a short summary and this week’s links (below) to the latest Commitment of Traders changes.
This week’s COT results showed that speculators dropped their bets for the US dollar last week (as of Tuesday) for the 7th out of the past 8 weeks and to about a 4 month low.
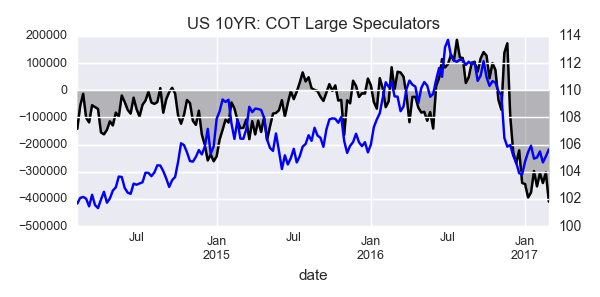
In the other major markets, the 10-year note speculators sharply boosted their net bearish positions to a new record high short position of over -400,000 contracts.
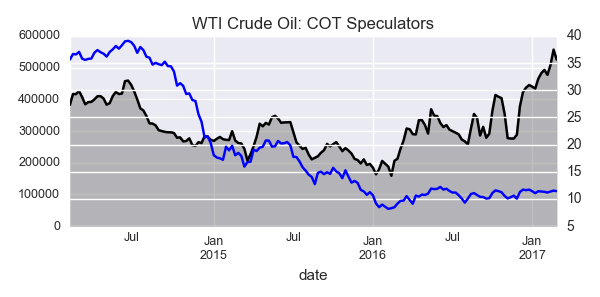
WTI Crude speculator reduced their bullish bets after setting a record high bullish position the week before.
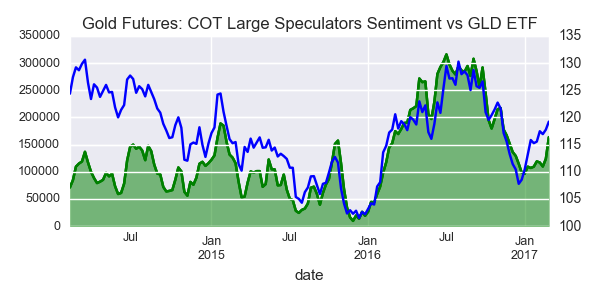
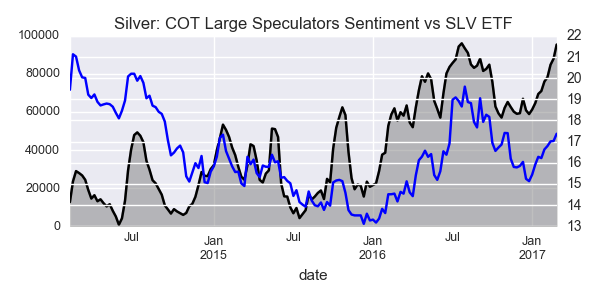
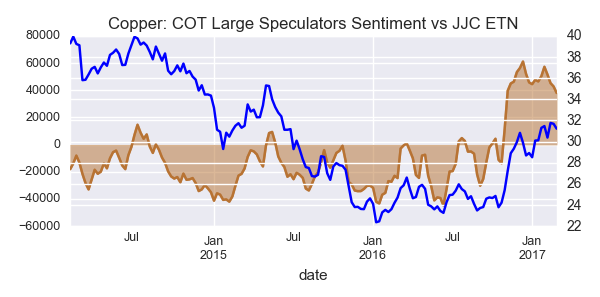
In metals, gold speculators sharply raised (+40,035 contracts) their bullish bets for a second straight week while silver specs continued to raise bullish bets for an 9th week and copper bets fell for the fourth straight week.
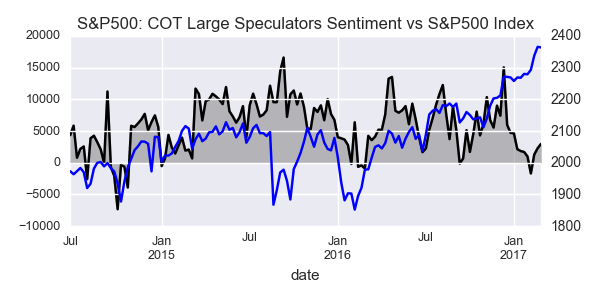
Finally, S&P500 speculators slightly added to their bullish bets in S&P500 futures for a third straight week.
US Dollar net speculator positions leveled at $13.01 billion last week
The latest data for the weekly Commitment of Traders (COT) report, released by the Commodity Futures Trading Commission (CFTC) on Friday, showed that large traders and forex (FX) speculators reduced their bullish bets for the US dollar last week for the seventh time out of the past eight weeks.
The non-commercial contracts of WTI crude futures totaled a net position of 525,254 contracts, according to data from last week. This was a decline of -31,353 contracts from the previous weekly total.
The large speculator contracts of gold futures advanced to a total net position of 163,798 contracts. This was a weekly jump of 40,035 contracts from the previous week.
The large speculator contracts of 10-year treasury note futures totaled a net bearish position of -409,659 contracts. This was a weekly change of -107,360 contracts from the previous week.
The large speculator contracts of S&P 500 futures totaled a net position of 2,972 contracts. This was a rise of 687 contracts from the reported data of the previous week.
The non-commercial contracts of silver futures totaled a net position of 95,423 contracts, according to data from last week. This was a weekly gain of 7,406 contracts from the previous totals.
The large speculator contracts of copper futures fell to a net position of 37,998 contracts. This was a weekly change of -4,796 contracts from the data of the previous week.
The Commitment of Traders report data is published in raw form every Friday by the Commodity Futures Trading Commission (CFTC) and shows the futures positions of market participants as of the previous Tuesday (data is reported 3 days behind).
The unprecedented rise in the consumption of digital media on mobile over the past few years has generated a variety of new ways in which to share information, from video to social to podcasts. The latter, though not a new phenomenon, has seen a surge during the last 2 or 3 years. According to a report by comScore and Wondery, almost 20% of adults in the United States between the ages of 18 and 49 listen to podcasts at least once a month.
For Forex traders, who now with the availability of mobile trading apps are no longer tied to their desks to perform their trading, getting their FX education while on the go is a very appealing proposition.
Getting a forex education is a crucial component of a successful trading strategy, therefore we have curated a list of the best podcasts for FX traders.
Forex Answers. Listened to in more than 27 countries, a total of 1800 times, Forex Answers provides insight to the forex market daily, proving to be a superb resource to newbie FX traders.
Michael Covel podcast. Honest insight and opinions from some of the sharpest people in the markets. This podcast has been embraced by more than 2.5 million listeners through over 300 episodes.
Power Trading Radio. Seasoned trader Merlin Rothfield brings expert analysis on stocks, forex and futures. Aimed at helping the average investor acquire the necessary skills to achieve success.
Desire to Trade. Etienne Crete brings aspiring FX traders a space in which they can learn trading processes that promise to get results. Through engaging interviews, he discusses techniques with some of the most prominent figures in the world of trading.
Online Forex Trading Course. An excellent resource for beginner forex traders, this podcast by Andrew Mitchem is a no-nonsense forex talk, packed with useful insights.
Whether you are a newbie trader looking to get some basic tools and training resources to give your trading career a headstart, or a seasoned trader looking to give your trading a boost, make the most of your commute and listen to these remarkable podcasters share their knowledge and expertise.
About the Author:
Adinah Brown is a professional writer who has worked in a wide range of industry settings, including corporate industry, government and non-government organizations. Within many of these positions, Adinah has provided skilled marketing and advertising services and is currently the Content Manager at Leverate.
As of March 2nd, 2017, one bitcoin is now worth more than one ounce of gold. The price of bitcoin recently made a new all-time high at $1,295, having doubled in just over 4 months!
We had anticipated that one bitcoin would be worth more than one ounce of gold at some point in 2017. However, the point of crossing parity occurred much earlier in the year than expected. Gold dipped below $1,240 yesterday while bitcoin spiked above $1,250. The gold price has continued to slip to the current price of $1,235, while the bitcoin price has risen to $1,290.
I remain very bullish on gold, silver and mining stocks. They make up the largest portion of my overall portfolio allocation and I expect spectacular gains from this sector over the next few years. I like junior mining stocks in particular as they can generate amazing returns if you buy quality companies before the market takes notice.
That being said, bitcoin has undeniably been the better performer. Gold is up 7% year to date in 2017, while bitcoin is up 32%. Over the past year, gold is down 3% and bitcoin is up 225%. Over the past five years, gold is down 30%, while Bitcoin is up over 25,000%. That is not a misprint – the price of bitcoin has soared from $4.92 to $1,280 over the past five years. This equates to a gain of more than 26X!
5-Year Price Charts for Gold and Bitcoin
Below are the 5-year charts for gold and bitcoin for comparison purposes. Gold went through a 4-year correction and appears to have bottomed during December of 2015, right around the time of the FED’s first rate hike in years. It corrected in the back half of 2016, but importantly it was able to establish a higher low on the chart. This was a bullish sign for gold and preceded another major rally to start 2017. Again, gold began its rally shortly after the FED raised interest rates by another 25 basis points. The 2017 gold rally is currently taking a breather and will likely continue to consolidate and correct in the near term. But we project much higher prices by year end and heading into 2018.
The bitcoin price chart shows an exponential move during late 2013 and early 2014, when the price rocketed from single digits to over $1,000. It went too far, too fast, and this move was followed by a sharp correction and consolidation that lasted roughly two years. As with gold, it is important to note that bitcoin established a higher low during 2015 and has since rallied to a new all-time high in 2017. Higher lows and higher highs on the technical charts are a bullish sign. Bitcoin is very volatile and we can’t rule out another major correction in the short term. But I believe that prior resistance around $1,000 will turn into support and that the price will head much higher over the next few years.
Winklevoss Bitcoin ETF Likely to Be Approved by March 11th
Do you remember these guys? The twin brothers are olympic rowers known for co-founding HarvardConnection (later renamed ConnectU). In 2004, the Winklevoss brothers sued Facebook founder Mark Zuckerberg, claiming he stole their ConnectU idea to create Facebook, and ultimately received $65 million. They were featured in the movie “The Social Network.”
The twins are now venture capitalists and huge investors of Bitcoin, claiming to own around 1% of all the bitcoin in existence. They are launching a Bitcoin ETF that may potentially be approved by the SEC next week, with a decision due by March 11th, 2017.
Traders appear to be positioning themselves ahead of the decision in expectation of approval. If approved, the ETF will open up bitcoin to a whole new class of investors. The flow of funds into the relatively tight market could send the price soaring and this is a major reason why so many buyers have entered the market lately. Of course, if the SEC rejects the ETF, a correction in the bitcoin price is all but guaranteed. I am a long-term holder that will buy any dip on this news and have bought nearly every dip over the past several years. I believe the price of bitcoin could eclipse $5,000 over the next few years.
Gold vs Bitcoin: A False Argument
I constantly see “gold vs bitcoin” article and arguments, which always pits the two forms of money as competitors. Like a football game, analysts then choose and a side and defend their position to the death. While I’m always game for some good competition, I submit to you that gold and bitcoin are complimentary investments that work well together in any portfolio allocation. Investors should consider owning both, with bitcoin at roughly half of your precious metals allocation.
Owning both allows you to better diversify your investments. Bitcoin gives you exposure to the incredible gains of bitcoin and allows you to easily transfer funds around the world for free. Gold provides a hedge against economic uncertainty, a safe haven that has been trusted money for thousands of years and gives you physical wealth in your hand with no counter-party risk.
Together, gold and bitcoin provide investors a way to move their wealth outside of the corrupt banking system, and government control. They provide a hedge against rampant inflation of fiat currencies, largely anonymous ownership and spectacular returns at a time when stocks, bonds and real estate all look very overvalued.
Ethereum Hits New Record High, Outpacing Gains of Bitcoin
While the gains generated from bitcoin are enough to make any investor’s mouth water, they are dwarfed by the emergence of a few other cryptocurrencies. Second in volume behind bitcoin is ethereum, which features faster transaction times and introduces smart contracts embedded within their blockchain technology.
Ethereum is often referred to as bitcoin 2.0. The software platform that enables not only Smart Contracts, but Distributed Applications (ĐApps) to be built and run without any downtime, fraud, control or interference from a third party. Ethereum is not just a platform but also a programming language (Turing complete) running on a blockchain, helping developers to build and publish distributed applications. Microsoft and other tech giants are embracing ethereum, investing millions of dollars and building projects using the ethereum platform.
The price for one ether, the ethereum coin, has moonshot from $7.98 to $19.50 year to date in 2017. That is a gain of 244% in just over two months, vastly outpacing bitcoin’s gain of 32%. Since the start of 2016, ethereum is up 2,150%, compared to bitcoin’s gain of 300%.
Lastly, the top performer amongst the major cryptocurrencies lately has been Dash. It has doubled in the past week alone. The price of dash started the year at $2.87 and is currently trading at $48 for a gain of over 1,600% or 17X in two months. These are perhaps once-in-a-generation wealth-making opportunities. While most investors would be happy with an annual return of 10%, cryptocurrencies are generating returns in the hundreds or thousands of percent.
How to Acquire Bitcoin and Ethereum
I believe the simplest way to buy Bitcoin and Ethereum in the United States is via coinbase.com. They are based in San Francisco, regulated by multiple states, include the New York Stock Exchange and USAA amongst its investors and they allow you to deposit and withdrawal funds to/from your bank via ACH just like any brokerage account. Use this link when opening an account and we both get $10 in free bitcoin!
Coinbase does not have Dash on their platform yet, but you can easily exchange bitcoin or ethereum for dash on other exchanges such as Poloniex or Kraken.
Investors can also get exposure via the Bitcoin Investment Trust (GBTC). It is up over 140% in the past year, but has once again climbed into overbought territory. The premium has been declining in anticipation of the new Winklevoss Bitcoin ETF. This new ETF should provide greater liquidity and lower fees if it is approved, so you may want to wait for the SEC decision.
The Bitcoin ETF will also trade on the major exchanges, whereas GBTC trades on the pink sheets. The bottom line is that approval of the Bitcoin ETF should open the doors to new investors and increase demand, but like the SPDR Gold Trust ETF (GLD) did when it came out in late 2004. The share price of GLD quadrupled in the six years following its launch.
No matter how you decide to get exposure, keep in mind that prices are very volatile. You might want to consider waiting for a dip or buying in tranches over time to ensure that you don’t go “all in” at the wrong moment. I know that digital currencies are not for everyone and long-time gold bugs have a hard time getting onboard with a currency that you can’t touch or feel. But these currencies have real utility, are revolutionizing the financial technology sector and are strictly limited in supply similar to gold. If adoption continues to grow and new supplies slow towards zero, economic fundamentals dictate much higher prices on the horizon.
Consider the Risks
Of course, higher levels of return are almost always accompanied by higher levels of risk. But in this case, I believe the potential returns far outweigh the risks. Digital currencies have suffered setbacks from hackers, but have usually found ways to remedy those issues. There has been fraud on various exchanges and theft from hackers, but you can limit that risk by storing the coins on your computer or better yet in a hardware wallet or cold storage.
There are also horrific stories of people that lost millions of bitcoin stored on their computers when the hard drive crashes, but that risk is simply mitigated via backing up your drive. Lastly, various governments have attempted to control or limit access to cryptocurrencies, including China, Russia and the U.S. But they are always one step behind, as tech-savvy free-market investors find ways around government controls.
I would personally never invest more than I could afford to lose without devastating my financial future. If you double your money, which you could have done in the past few weeks with Dash or the past few months with Bitcoin or Ethereum, you can always take a “free ride.” This means that you sell half of your holdings to recoup your original investment and then allow the remaining 50% to ride risk free.
Gold and Bitcoin Research in One Newsletter
You will not find many investment newsletters that cover both gold and Bitcoin like we do. We first brought Bitcoin to the attention of our subscribers when the price was around $100. We also cover energy, agriculture, technology stocks, cannabis stocks and any other sector where we believe high levels of return can be found for our subscribers.
Our highly-rated newsletter, The Contrarian Report, comes out monthly and includes macro market analysis, technical analysis, updates on all the sectors that we cover and all of the individual stocks in our portfolio. We also share our watch list and highlight top gainers each month. Our model portfolio returned 69.7% last year and is up double digits so far in 2017. We send trade alerts whenever we buy or sell and do not accept compensation from companies to eliminate conflict of interest. We have also created a “Guide to Investing in Bitcoin” for subscribers. You can get it all for less than $1 per day by clicking here.
You can use the coupon code PARITY to take 10% off the yearly membership during signup. This code is only good for the first 10 new subscribers to sign up. At the very least, sign up for our free email alerts here. Otherwise, click the button below for instant access to the portfolio and newsletter.
Jason Hamlin is the founder of Gold Stock Bull and has been investing in precious metals for over 20 years. Jason spent nearly a decade in analytics for the world’s largest market research firm, before finding success investing full time. He launched Gold Stock Bull in 2005 and turned his focus from helping fortune 500 companies to helping individual investors that were struggling to achieve strong gains in the stock market.
US Dollar net speculator positions fell to $13.01 billion last week
The latest data for the weekly Commitment of Traders (COT) report, released by the Commodity Futures Trading Commission (CFTC) on Friday, showed that large traders and forex (FX) speculators reduced their bullish bets for the US dollar last week for the seventh time out of the past eight weeks.
Non-commercial large futures traders, including hedge funds and large speculators, had an overall US dollar long position totaling $13.01 billion as of Tuesday February 28th, according to the latest data from the CFTC and dollar amount calculations by Reuters. This was a weekly decline of $-2.01 billion from the $15.02 billion total long position that was registered the previous week, according to the Reuters calculation (totals of the US dollar contracts against the combined contracts of the euro, British pound, Japanese yen, Australian dollar, Canadian dollar and the Swiss franc).
Speculative aggregate US dollar positions are now at their lowest level since October 4th when net positions totaled $10.52 billion and positions have fallen by approximately $12 billion over the past eight weeks.
Weekly Speculator Contract Changes:
The individual major currency contracts that improved against the US dollar last week were the euro (7,087 weekly change in contracts), Japanese yen (145 contracts), Canadian dollar (5,506 contracts), Australian dollar (18,393 contracts) and the Mexican peso (10,698 contracts).
The currencies whose speculative bets declined last week versus the dollar were the British pound sterling (-4,319 weekly change in contracts), Swiss franc (-2,878 contracts) and the New Zealand dollar (-221 contracts).
Table of Weekly Commercial Traders and Speculators Levels & Changes:
Currency
Net Commercials
Comms Weekly Chg
Net Speculators
Specs Weekly Chg
EuroFx
58524
-5725
-51164
7087
GBP
79822
4970
-70671
-4319
JPY
73260
-881
-50017
145
CHF
20506
2168
-11814
-2878
CAD
-37625
-5105
30090
5506
AUD
-58061
-16425
51915
18393
NZD
-5341
-470
2937
-221
MXN
43555
-11754
-45783
10698
This latest COT data is through Tuesday and shows a quick view of how large speculators or non-commercials (for-profit traders) as well as the commercial traders (hedgers & traders for business purposes) were positioned in the futures markets. All currency positions are in direct relation to the US dollar where, for example, a bet for the euro is a bet that the euro will rise versus the dollar while a bet against the euro will be a bet that the dollar will gain versus the euro.
Weekly Charts: Large Trader Weekly Positions vs Price of Major Currencies
EuroFX:
British Pound Sterling:
Japanese Yen:
Swiss Franc:
Canadian Dollar:
Australian Dollar:
New Zealand Dollar:
Mexican Peso:
*COT Report: The weekly commitment of traders report summarizes the total trader positions for open contracts in the futures trading markets. The CFTC categorizes trader positions according to commercial hedgers (traders who use futures contracts for hedging as part of the business), non-commercials (large traders who speculate to realize trading profits) and nonreportable traders (usually small traders/speculators). Find CFTC criteria here: (http://www.cftc.gov/MarketReports/CommitmentsofTraders/ExplanatoryNotes/index.htm).
The Commitment of Traders report is published every Friday by the Commodity Futures Trading Commission (CFTC) and shows futures positions data that was reported as of the previous Tuesday (3 days behind).
Each currency contract is a quote for that currency directly against the U.S. dollar, a net short amount of contracts means that more speculators are betting that currency to fall against the dollar and a net long position expect that currency to rise versus the dollar.
(The charts overlay the forex closing price of each Tuesday when COT trader positions are reported for each corresponding spot currency pair.) See more information and explanation on the weekly COT report from the CFTC website.