Author Archive for InvestMacro – Page 580

EUR/USD: Bullish bias remains intact

By GrowthAces.com

Macroeconomic overview

The USD has been on the retreat since the U.S. Federal Reserve raised interest rates on Wednesday but stopped short of predicting a sharper acceleration in monetary tightening over the next two years.

For currency markets, the meetings of Group of 20 financial leaders added up to a renewed expression of concern about the United States’ global trade relations and by implication the Trump White House’s concern over the strong dollar.

The post-meeting communique retained language on avoiding currency manipulation which has previously seemed aimed chiefly at Japan and China, but it omitted a call for free trade seen as opening the door to more overt efforts by Washington to shift the balance of its international relationships.

The Federal Reserve said on Friday manufacturing production rose 0.5% last month. January’s output was revised up to show a 0.5% gain instead of the previously reported 0.2% increase.

Despite the increase in manufacturing output overall industrial production was unchanged in February because of a 5.7% weather-driven plunge in utilities generation. Industrial production fell 0.1% in January.

Manufacturing is regaining ground as the prolonged drag from lower oil prices, a strong dollar and an inventory overhang fades. The sector is also benefiting from a surge in sentiment amid promises by the Trump administration to pursue business-friendly policies, including tax cuts and deregulation.

Overall industrial capacity utilization fell 0.1 percentage point to 75.4%. It is 4.5 percentage points below its long-run average. Officials at the Fed tend to look at capacity use as a signal of how much “slack” remains in the economy and how much room there is for growth to accelerate before it becomes inflationary.

Technical analysis

The EUR/USD is up on the day, but below Friday’s 1.0782 peak. A close above 76.4% fibo of February drop (1.0748) will keep bullish momentum intact. The next support is 1.0728 low on March 17.

EURUSD Daily Forex Signals Chart

Trading strategy

We stay long for 1.0820. There are no macroeconomic data scheduled for this week that could significantly change the market direction. Investors will be focused on speeches from Fed policymakers: Evans (today), Dudley (on Tuesday), Yellen and Kashkari (on Thursday).


USD/CAD: Loonie under pressure of falling oil prices

Macroeconomic overview

The CAD weakened slightly against the USD on Friday and remains near Friday’s close today, despite stronger-than-expected domestic manufacturing data.

Canadian manufacturing sales unexpectedly rose in January for the third month in a row, driven by a gain in sales of non-durable goods, including petroleum and coal products, data from Statistics Canada showed.  The 0.6% gain beat expectations for a 0.2% decline, while sales volumes were also solid, rising 0.7%. The data supported prospects of the Bank of Canada dropping its cautious stance.

Falls of crude oil prices are worrying for CAD bulls. Oil prices fell more than 1% on Monday as investors made record cuts to bets on rising prices after strong drilling data from the United States fed concerns about the effectiveness of OPEC-led production cuts to curb a supply glut.

The prospect of higher output from Libya, which is exempt from the output cut deal, is adding further bearish sentiment. Libya’s National Oil Corporation said it was confident of regaining control of two key oil ports, Es Sider and Ras Lanuf, which have a combined capacity to export 600,000 barrels per day.

Reacting to the oil glut, financial oil traders cut their net long U.S. crude futures and options positions in the week to March 14, the third consecutive reduction, the U.S. Commodity Futures Trading Commission said on Friday.

Technical analysis

The loonie recoverved against the USD on less-hawkish Fed last week and the USD/CAD fall was stopped near 38.2% fibo level of January-March rise. The CAD has been fluctuating slightly above this level, but still below 7-day exponential moving average, which is negatively aligned now. A further drop is likely in the coming days.

USDCAD Daily Forex Signals Chart

Trading strategy

We stay short for 1.3150.


TRADING STRATEGIES SUMMARY:

FOREX – MAJOR PAIRS:

Please enable images to upload to view this email properly

FOREX – MAJOR CROSSES:

Please enable images to upload to view this email properly

PRECIOUS METALS:

Please enable images to upload to view this email properly

It is usually reasonable to divide your portfolio into two parts: the core investment part and the satellite speculative part. The core part is the one you would want to make profit with in the long term thanks to the long-term trend in price changes. Such an approach is a clear investment as you are bound to keep your position opened for a considerable amount of time in order to realize the profit. The speculative part is quite the contrary. You would open a speculative position with short-term gains in your mind and with the awareness that even though potentially more profitable than investments, speculation is also way more risky. In typical circumstances investments should account for 60-90% of your portfolio, the rest being speculative positions. This way, you may enjoy a possibly higher rate of return than in the case of putting all of your money into investment positions and at the same time you may not have to be afraid of severe losses in the short-term.

How to read these tables?

1. Support/Resistance – three closest important support/resistance levels
2. Position/Trading Idea:
BUY/SELL – It means we are looking to open LONG/SHORT position at the Entry Price. If the order is filled we will set the suggested Target and Stop-loss level.
LONG/SHORT – It means we have already taken this position at the Entry Price and expect the rate to go up/down to the Target level.
3. Stop-Loss/Profit Locked In – Sometimes we move the stop-loss level above (in case of LONG) or below (in case of SHORT) the Entry price. This means that we have locked in profit on this position.
4. Risk Factor – green “*” means high level of confidence (low level of uncertainty), grey “**” means medium level of confidence, red “***” means low level of confidence (high level of uncertainty)
5. Position Size (forex)– position size suggested for a USD 10,000 trading account in mini lots. You can calculate your position size as follows: (your account size in USD / USD 10,000) * (our position size). You should always round the result down. For example, if the result was 2.671, your position size should be 2 mini lots. This would be a great tool for your risk management!
Position size (precious metals) – position size suggested for a USD 10,000 trading account in units. You can calculate your position size as follows: (your account size in USD / USD 10,000) * (our position size).
6. Profit/Loss on recently closed position (forex) – is the amount of pips we have earned/lost on recently closed position. The amount in USD is calculated on the assumption of suggested position size for USD 10,000 trading account.
Profit/Loss on recently closed position (precious metals) – is profit/loss we have earned/lost per unit on recently closed position. The amount in USD is calculated on the assumption of suggested position size for USD 10,000 trading account.
About the Author:

By GrowthAces.com – Daily Forex Trading Strategies
 

Japanese Candlesticks Analysis 20.03.2017 (EUR/USD, USD/JPY)

Article By RoboForex.com

EUR USD, “Euro vs. US Dollar”

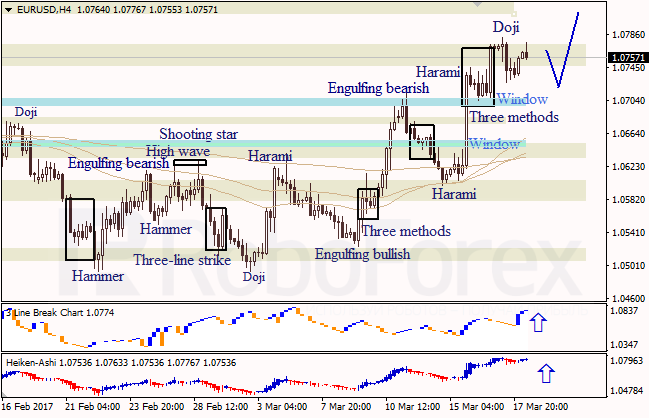
At the H4 chart of EUR USD, bearish Doji pattern indicated a descending correction. Three Line Break chart and Heiken Ashi candlesticks shows a bullish direction to confirm that the ascending tendency continues.

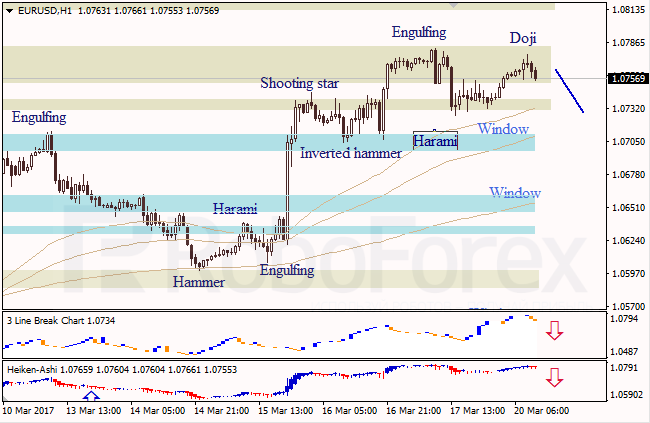
At the H1 chart of EUR USD, Engulfing Bearish and Doji patterns indicate that the descending correction continues. Three Line Break chart and Heiken Ashi candlesticks confirm a bearish direction.


USD JPY, “US Dollar vs. Japanese Yen”

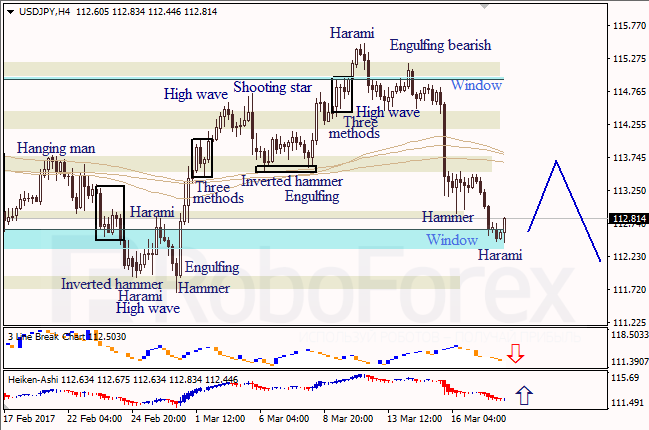
At the H4 chart of USD JPY, bullish Harami pattern indicates an ascending correction. The downside Window is a support level. Three Line Break chart shows a bearish direction; Heiken Ashi candlesticks confirm the ascending movement.


RoboForex Analytical Department

Article By RoboForex.com

Attention!
Forecasts presented in this section only reflect the author’s private opinion and should not be considered as guidance for trading. RoboForex LP bears no responsibility for trading results based on trading recommendations described in these analytical reviews.

How to keep a Trading Journal

By Adinah Brown

Hindsight is 20/20. You’ve heard that haven’t you? Well, did you know that having a solid trading system can help you get as close to 20/20 vision in foresight as possible? In order to achieve sustained successful trading, you must constantly review your trading performance and activity so you can improve upon them. Keeping a record of every one of your trades, including the details of why you decided to go in, what were the conditions of the market at that moment, how did you get out of the trade and why it turned out the way it did, is a great way to monitor how your trading strategy is performing as well as your ability to stick to the plan. How then, do you keep a trading journal? Here are some tips from the pros:

1. One way to keep your trading journal organized is to keep a daily journal as a file in your computer and name it mm-dd-yy, but each day should be separated into individual trades.

2. At the very least, a journal should include the following details:

· Day ____________

· Date____________

· Time Open: ____________Close: ____________

· Currency Pair: _____________

· Entry Price: _____________

· Stop Price:_____________

· Limit Price:_____________

· Lots Traded:_____________

· P/L:_____________


3. A picture says a thousand words, so use screenshots to tell the story of your trades, but in order to make the most of the picture, words are still necessary. Make notes on the margin of the photo including additional details and mark your charts to be able to reference them in the future.

4. Include additional photos of intraday action.

5. If you notice any patterns, make a note of them. After a while, you’ll begin to see if these patterns emerge in real time.

6. Include some price action information to provide context to your trades. What was happening an hour or two before you opened a trade?

7. Add information about your emotions as those can often impact your decisions.

8. If you miss a trade, write about the reasons why you missed them. Missed trades are just as important as trades gone wrong.

9. Make notes about market tendencies you notice and make comments on the conditions of the market throughout the day.

10. Better err on the side of too much than not enough details. So, if something has caught your attention, write it down.

About the Author:

Adinah Brown is a professional writer who has worked in a wide range of industry settings, including corporate industry, government and non-government organizations. Within many of these positions, Adinah has provided skilled marketing and advertising services and is currently the Content Manager at Leverate.


Forex Technical Analysis & Forecast 20.03.2017 (EUR/USD, GBP/USD, USD/CHF, USD/JPY, AUD/USD, USD/RUB, GOLD, BRENT)

Article By RoboForex.com

EUR USD, “Euro vs US Dollar”

The EUR/USD pair has completed the first descending impulse and right now is being corrected with the target at 1.0769. After that, the instrument may fall to break the low of the first impulse. The market is expected to continue forming the descending wave towards 1.0660.


GBP USD, “Great Britain Pound vs US Dollar”

The GBP/USD pair is consolidating. Possibly, today the price may reach 1.2419. Later, in our opinion, the market may start moving downwards with the target at 1.2243.


USD CHF, “US Dollar vs Swiss Franc”

The USD/CHF pair has completed the ascending impulse and right now is being corrected. Possibly, today the price may reach 0.9951. After that, the instrument may grow to break the high of the first impulse. The market is expected to continue forming the ascending wave with the target at 1.0070.


USD JPY, “US Dollar vs Japanese Yen”

The USD/JPY pair has broken its consolidation range to the downside. Possibly, the price may reach 112.25. Later, in our opinion, the market may start growing with the target at 113.89.


AUD USD, “Australian Dollar vs US Dollar”

The AUD/USD pair is trading to break the consolidation range to the upside. Possibly, the price may reach 0.7732. After that, the instrument may start another decline towards 0.7610.


USD RUB, “US Dollar vs Russian Ruble”

The USD/RUB pair is consolidating around 57.64. Possibly, today the price may grow to reach 58.81. Later, in our opinion, the market may fall towards he local target at 56.61.


XAU USD, “Gold vs US Dollar”

Being under pressure, Gold is still moving upwards. Possibly, the price may reach 1236.40. Later, in our opinion, the market may form another descending structure to reach 1205.00. The instrument is expected to continue forming the wave with the target at 1100.00.


BRENT

Brent has completed the descending correctional structure. Possibly, today the price may grow to break 52.11. The first target is at 52.83.


RoboForex Analytical Department

Article By RoboForex.com

Attention!
Forecasts presented in this section only reflect the author’s private opinion and should not be considered as guidance for trading. RoboForex LP bears no responsibility for trading results based on trading recommendations described in these analytical reviews.

EUR/USD: Monday v Friday

By Gabriel Ojimadu, Alpari

Previous:

On Friday the 17th of March, trading on the euro closed down. The EUR/USD rate fell to the 1.0727 level, after which the currency pair went into a correctional phase. Before trading closed, the price consolidated under the 1.0727 – 1.0748 range.

US statistics weren’t enough to bring the price out of this range. The industrial manufacturing index came out flat. At the same time, the leading indicators index and the University of Michigan’s consumer sentiment index exceeded expectations.

US statistics:

  • The index of leading indicators in the US for February came to 0.6% (forecast: 0.4%, previous figure: 0.6%).
  • The final reading of the University of Michigan’s Consumer Sentiment Index has come in at 97.6 (forecast: 97.0, preliminary figure: 95.7).
  • The US industrial manufacturing index for February has come in at 0.0% (forecast: +0.2%, previous figure revised from -0.3% to -0.1%).

Market expectations:

During trading in Asia, the rate restored by 30 points to 1.0764. Today is Monday, correction day. I’m not paying attention to the news in my forecast, in which I’m expecting the single currency to strengthen against the US dollar to 1.0789.

Given that the Stochastic oscillator is currently in the sell zone for the euro, I think there is no prospect of the rate growing to 1.0805.

Day’s news (GMT+3):

  • 10:00 Germany: PPI (Feb);
  • 14:00 Germany: Bundesbank monthly report;
  • 15:30 Canada: wholesale sales (Jan);
  • 17:30 Australia: CB leading indicator (Jan);
  • 19:45 Germany: Bundesbank president Wiedmann’s speech;
  • 20:10 USA: Fed’s Evans speech;
  • 21:20 UK: MPC member Haldane’s speech.

EURUSD rate on the hourly. Source: TradingView

Intraday forecast: low: 1.0732 (current in Asia), high: 1.0790, close: 1.0778.

On Friday, the euro/dollar corrected from the 157th degree to 45 degrees. Through consolidation, the price met with the balance line towards the end of trading. The euro began to strengthen as markets opened and restored to 1.0765.

Given that the euro rate closed down on Friday, I’m expecting the euro to strengthen today, against Friday’s movement. According to my calculations, the euro should correct from 1.0772 (10:00) to 1.0754 (14:00). From there, I’m expecting a new session impulse to 1.0790 (20:00). After trading closes in Europe, we should see a rebound to 1.0778.

On the older timeframes for the EUR/GBP and EUR/USD pairs, we have a mixed picture. Because of this, I’m expecting some turbulence at our current level (possible sharp fluctuations in both directions). Before considering long positions, we first need to look at the EUR/GBP cross. At the moment, on the hourly timeframe, the Stochastic oscillator is forming a bearish signal. Taking out long positions on the euro with a falling cross is risky given that this could create some unwanted drawdown.

Positives for the euro (+):

Fundamental:

(+) US president Donald Trump favours a weaker dollar;

(+) The threshold for acceptable US government debt of 20.1 trillion USD may be reached by March this year. This will create headaches for new US president Donald Trump. A new law on the debt ceiling came into force on the 16th of March 2017;

(+) The Greek government has made some progress in its talks with international creditors on the second stage of their reform program;

(+) Head of the ECB, Mario Draghi, has hinted that the central bank may not need to provide any further stimulus to revitalise Europe’s economy. From April to December 2017, the ECB will reduce their monthly assets purchases to 80 to 60 billion EUR;

(+) ECB bosses have discussed the possibility of raising interest rates before the QE program comes to an end;

(+) Ewald Nowotny, a member of the ECB’s governing council, has said that the bank could raise the deposit rate before the main refinancing rate;

Technical (short-term):

(+) According to data from 14/03/17, small and large speculators on the Chicago Exchange have increased their long and short positions. Long positions have grown by 11,151 to 148,509 contracts, while short positions have grown by 8,909 to 187,216 contracts. Net short positions have fallen from 58,766 to 38,707 contracts. Small speculators have reduced their short positions by 11,095 to 58,313 contracts. Net long positions have risen by 3,158 contracts.

(+) Long/short ratio according to myfxbook as of 7:01 EET: 74%/25%, lots: 21726/7542 (previous day: 28751/6966), positions: 54996/21436 (previous day: 72135/23227);

(+) US 10-year bond yields: 2.501% (down 1.61% from 17/03/17);

(+) EURGBP (W):  the CCI (20), AO, AC and the Stochastic (5,3,3) are moving upwards. The trend line has been broken through;

(+) EURUSD (M): the Stochastic (5,3,3) is moving upwards;

(+) EURUSD (W): The Stochastic (5,3,3), AO, AC, and CCI (20) are moving upwards;

(+) EURUSD (D): the AO and Stochastic (5,3,3) indicators are moving upwards;

Negatives for the euro (-):

Fundamental:

(-) According to CME Group’s FedWatch Tool on Friday the 17th of March, the probability of a rate hike in May remains 6.4%. The probability in June has gone up from 54.0% to 58.3%, and in July from 62.0% to 64.5%;

(-) Political uncertainty in Europe (French elections and Brexit);

Technical factors (short-term):

(-) German 10-year bond yields: 0.436% (down 2.89% from 17/03/17);

(-) EURUSD (M): the AO and AC indicators are moving downwards;

(-) EURUSD (D): the AC and CCI (20) are moving downwards;

(-) EURGBP (D): the AO, AC, CCI (20), and Stochastic (5,3,3) indicators are moving downwards;

Built into the price:

(-)  The Ex-Prime Minister of France, Alain Juppe, has ruled himself out of participating in the presidential election;

(+) François Bayrou, leader of the “Democratic Movement” party, has ruled out running for the presidency and thrown his weight behind independent candidate Emmanuel Macron;

(+) Marine Le Pen has had her EU parliamentary immunity from prosecution lifted for political reasons.

COT Report: USD bets go higher for 2nd week. WTI bets drop sharply. 10-Yr Specs cut shorts

By CountingPips.com

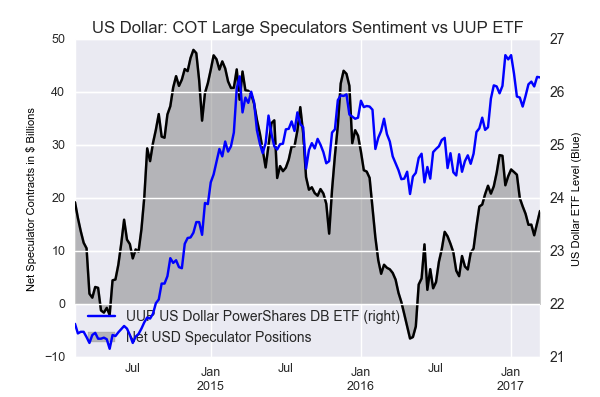
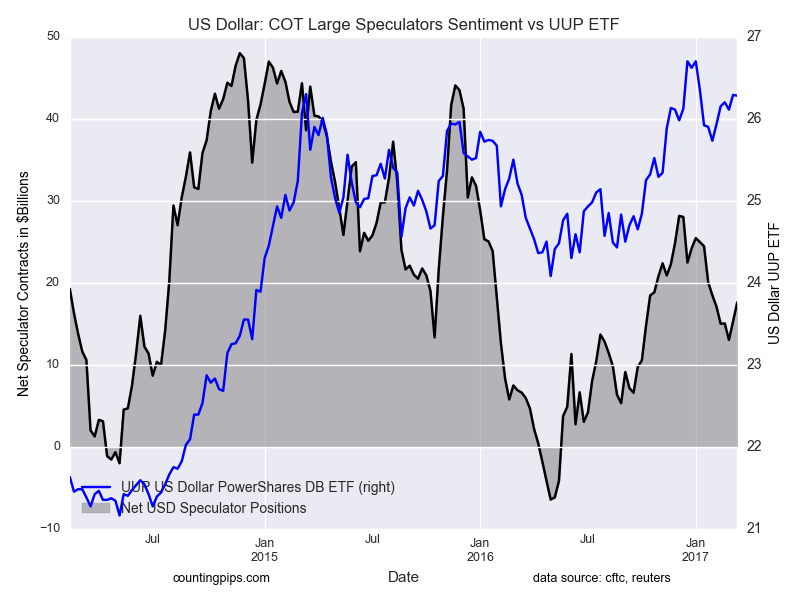
This week’s COT results showed that speculators raised their bets for the US dollar last week (as of Tuesday), for a second week and to the highest level in six weeks (+$17 billion).

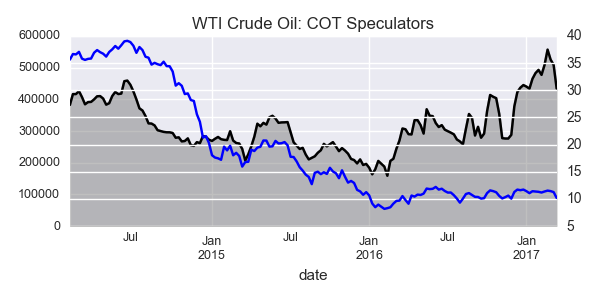
In the other major markets, WTI Crude speculators sharply cut back on their bullish bets (-74,725 contracts) for a third week after setting a record high bullish position on February 21st.

The 10-year note speculators, for a second straight week, sharply reduced their bearish bets after reaching a record high short position of over -400,000 contracts three weeks ago.

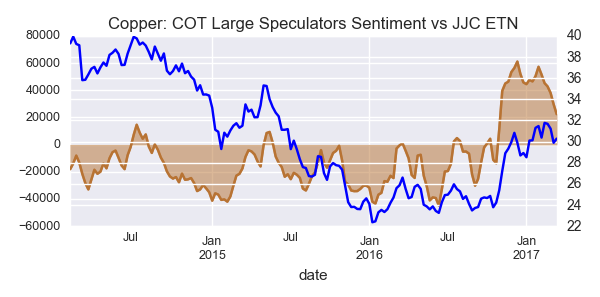
In metals, gold speculators decreased their bullish bets for a second week while silver speculators also trimmed bullish bets for a second week. Copper bets continued to decline for the sixth straight week.

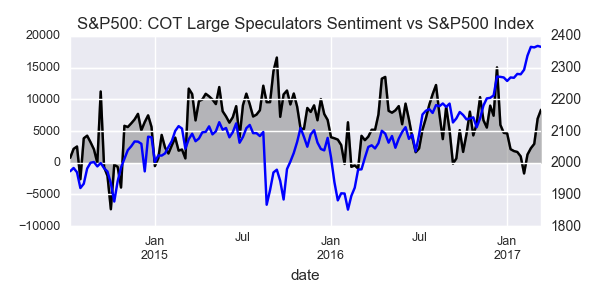
Finally, S&P500 speculators raised their bullish bets higher in S&P500 futures for a fifth straight week and to the highest level since mid-December.


Forex Speculators boosted US Dollar bullish positions for 2nd week

US Dollar net speculator positions leveled at $17.59 billion last week

The latest data for the weekly Commitment of Traders (COT) report, released by the Commodity Futures Trading Commission (CFTC) on Friday, showed that large traders and currency speculators raised their bullish bets for the US dollar last week to the highest level in six weeks.

See full article


WTI Crude Oil Speculators fell their positions last week

The non-commercial contracts of WTI crude futures totaled a net position of 433,800 contracts, according to data from last week. This was a drop of -74,725 contracts from the previous weekly total.

See full article


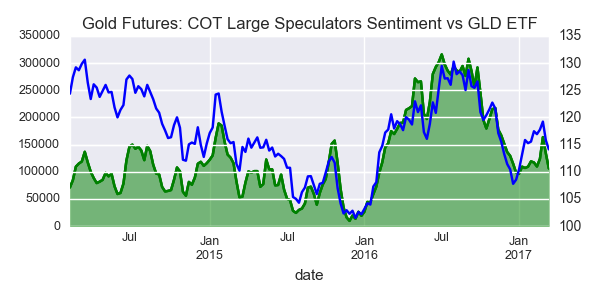
Gold Speculators declined their positions last week

The large speculator contracts of gold futures declined to a total net position of 106,038 contracts. This was a weekly change of -27,647 contracts from the previous week.

See full article


10 Year Treasury Note Speculators increased their positions last week

The large speculator contracts of 10-year treasury note futures totaled a net position of -194,392 contracts. This was a weekly change of 104,122 contracts from the previous week.

See full article


S&P 500 Speculators increased their positions last week

The large speculator contracts of S&P 500 futures totaled a net position of 8,350 contracts. This was a change of 1,404 contracts from the reported data of the previous week.

See full article


Silver Speculators decreased their positions last week

The non-commercial contracts of silver futures totaled a net position of 82,878 contracts, according to data from last week. This was a weekly change of -10,575 contracts from the previous totals.

See full article


Copper Speculators decreased their positions last week

The large speculator contracts of copper futures totaled a net position of 22,439 contracts. This was a weekly change of -7,280 contracts from the data of the previous week.

See full article


Article by CountingPips.com

The Commitment of Traders report data is published in raw form every Friday by the Commodity Futures Trading Commission (CFTC) and shows the futures positions of market participants as of the previous Tuesday (data is reported 3 days behind).

To learn more about this data please visit the CFTC website at http://www.cftc.gov/MarketReports/CommitmentsofTraders/index.htm


Forex Speculators boosted US Dollar bullish positions for 2nd week

By CountingPips.comGet our weekly COT Reports by Email

US Dollar net speculator positions leveled at $17.59 billion last week

The latest data for the weekly Commitment of Traders (COT) report, released by the Commodity Futures Trading Commission (CFTC) on Friday, showed that large traders and currency speculators raised their bullish bets for the US dollar last week to the highest level in six weeks.

Non-commercial large futures traders, including hedge funds and large speculators, had an overall US dollar long position totaling $17.59 billion as of Tuesday March 14th, according to the latest data from the CFTC and dollar amount calculations by Reuters. This was a weekly rise of $2.33 billion from the $15.26 billion total long position that was registered the previous week, according to the Reuters calculation (totals of the US dollar contracts against the combined contracts of the euro, British pound, Japanese yen, Australian dollar, Canadian dollar and the Swiss franc).

Speculative dollar positions have gained by over $2 billion each of the past two weeks and are now at the highest level since January 31st when bets totaled $18.47 billion.

Weekly Speculator Contract Changes:

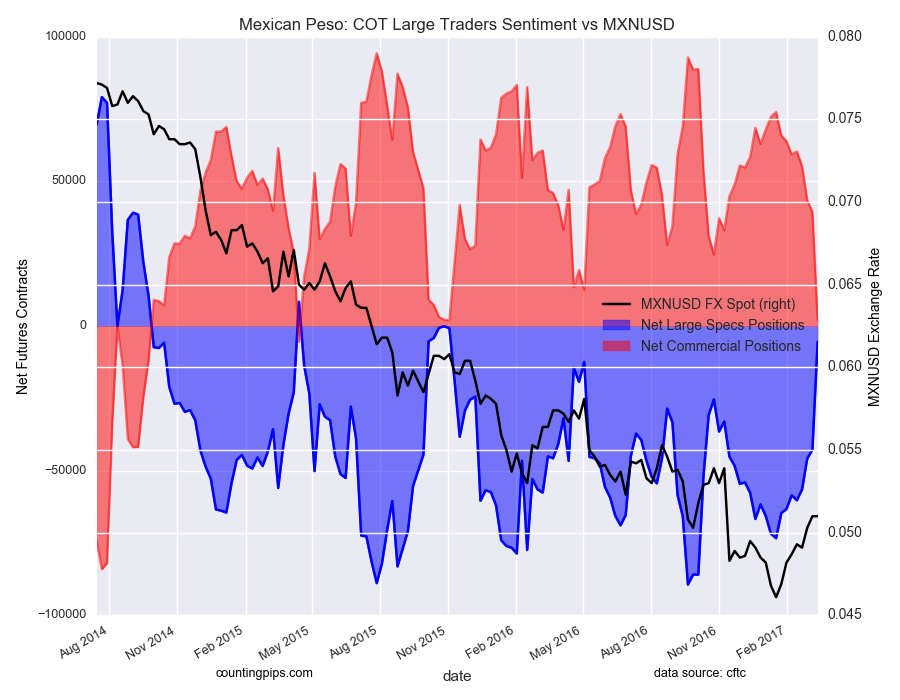
The individual major currencies that improved against the US dollar last week were the euro (18,474 weekly change in contracts), Swiss franc (1,019 contracts) and the Mexican peso (37,291 contracts).

The currencies whose speculative bets declined last week versus the dollar were the British pound sterling (-25,680 weekly change in contracts), Japanese yen (-16,597 contracts), Canadian dollar (-7,762 contracts), Australian dollar (-7,713 contracts) and the New Zealand dollar (-1,180 contracts).


Table of Weekly Commercial Traders and Speculators Levels & Changes:

CurrencyNet CommercialsComms Weekly ChgNet SpeculatorsSpecs Weekly Chg
EuroFx37613-29158-4102718474
GBP12211929782-107117-25680
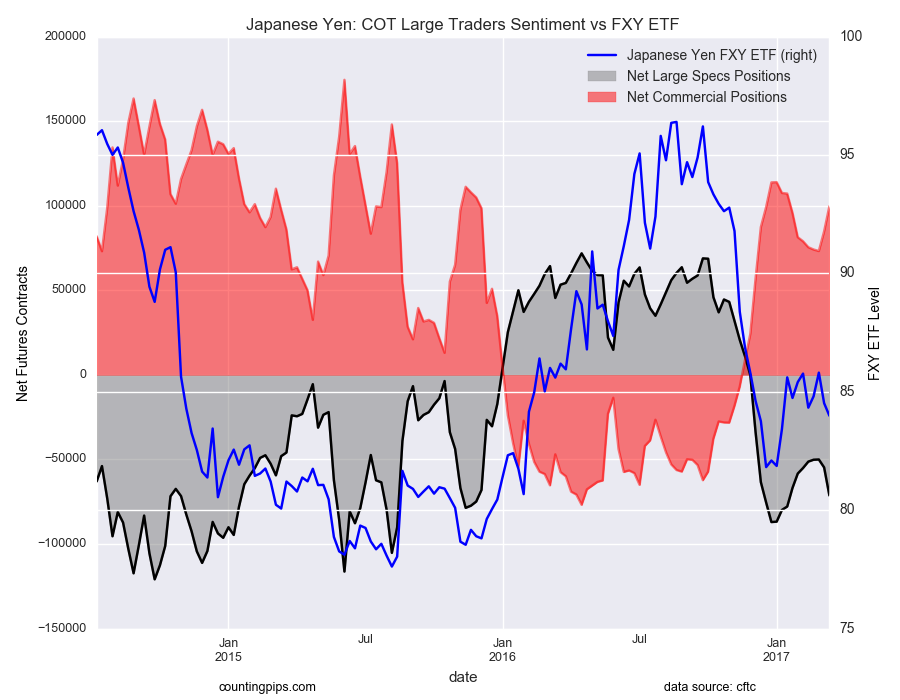
JPY9974214895-71297-16597
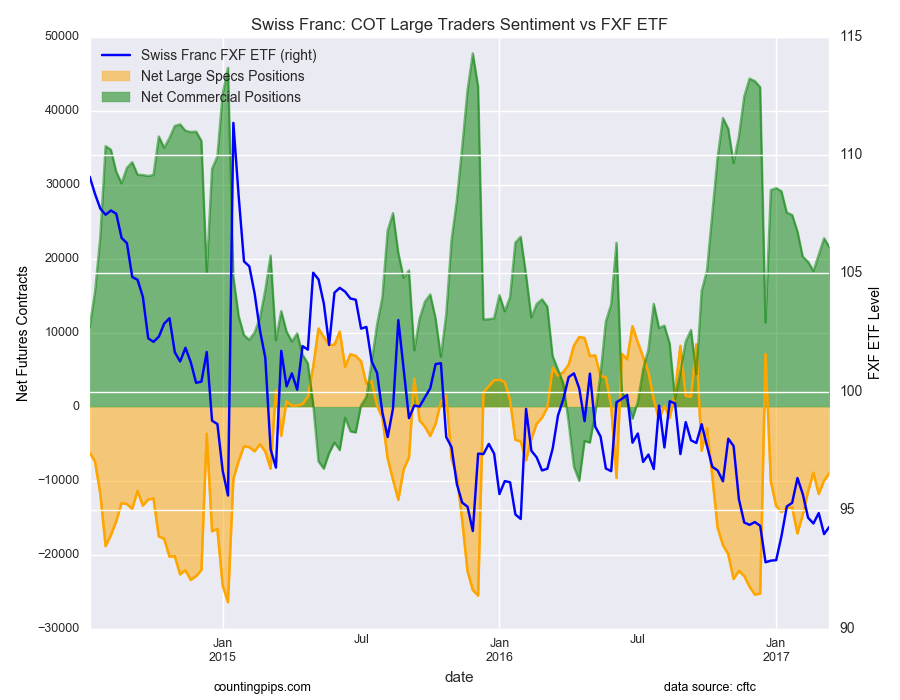
CHF21568-1187-89971019
CAD-127861567321458-7762
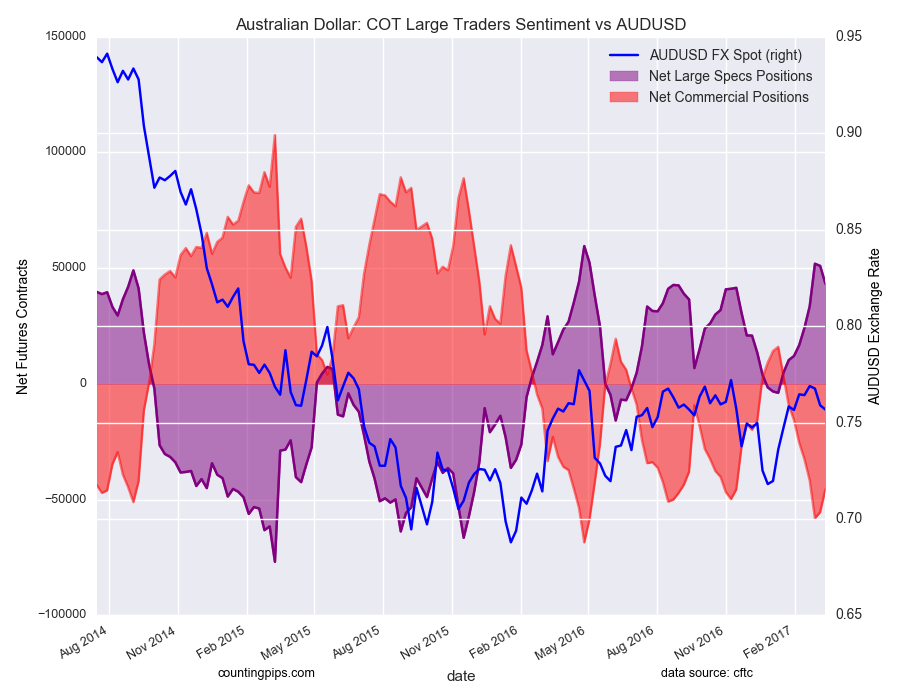
AUD-45488988643265-7713
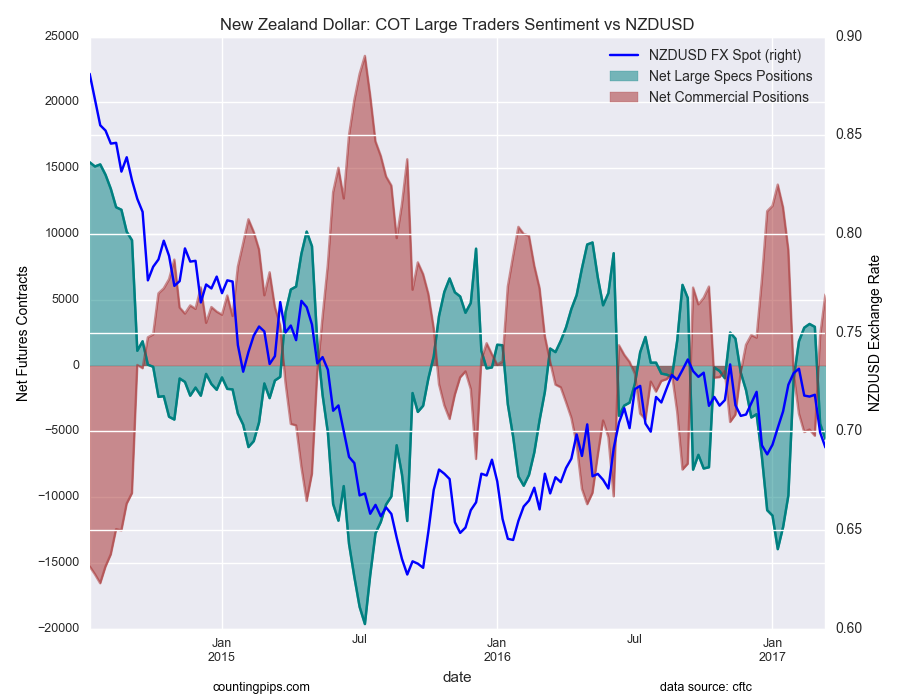
NZD54033151-5605-1180
MXN2146-37324-546737291

This latest COT data is through Tuesday and shows a quick view of how large speculators or non-commercials (for-profit traders) as well as the commercial traders (hedgers & traders for business purposes) were positioned in the futures markets. All currency positions are in direct relation to the US dollar where, for example, a bet for the euro is a bet that the euro will rise versus the dollar while a bet against the euro will be a bet that the dollar will gain versus the euro.


Weekly Charts: Large Trader Weekly Positions vs Price

EuroFX:


British Pound Sterling:


Japanese Yen:


Swiss Franc:


Canadian Dollar:


Australian Dollar:


New Zealand Dollar:


Mexican Peso:

*COT Report: The weekly commitment of traders report summarizes the total trader positions for open contracts in the futures trading markets. The CFTC categorizes trader positions according to commercial hedgers (traders who use futures contracts for hedging as part of the business), non-commercials (large traders who speculate to realize trading profits) and nonreportable traders (usually small traders/speculators). Find CFTC criteria here: (http://www.cftc.gov/MarketReports/CommitmentsofTraders/ExplanatoryNotes/index.htm).

The Commitment of Traders report is published every Friday by the Commodity Futures Trading Commission (CFTC) and shows futures positions data that was reported as of the previous Tuesday (3 days behind).

Each currency contract is a quote for that currency directly against the U.S. dollar, a net short amount of contracts means that more speculators are betting that currency to fall against the dollar and a net long position expect that currency to rise versus the dollar.

(The charts overlay the forex closing price of each Tuesday when COT trader positions are reported for each corresponding spot currency pair.) See more information and explanation on the weekly COT report from the CFTC website.

Article by CountingPips.com


Gold Speculators sharply cut bullish net positions for 2nd week

By CountingPips.comGet our weekly COT Reports by Email

Gold Non-Commercial Positions:

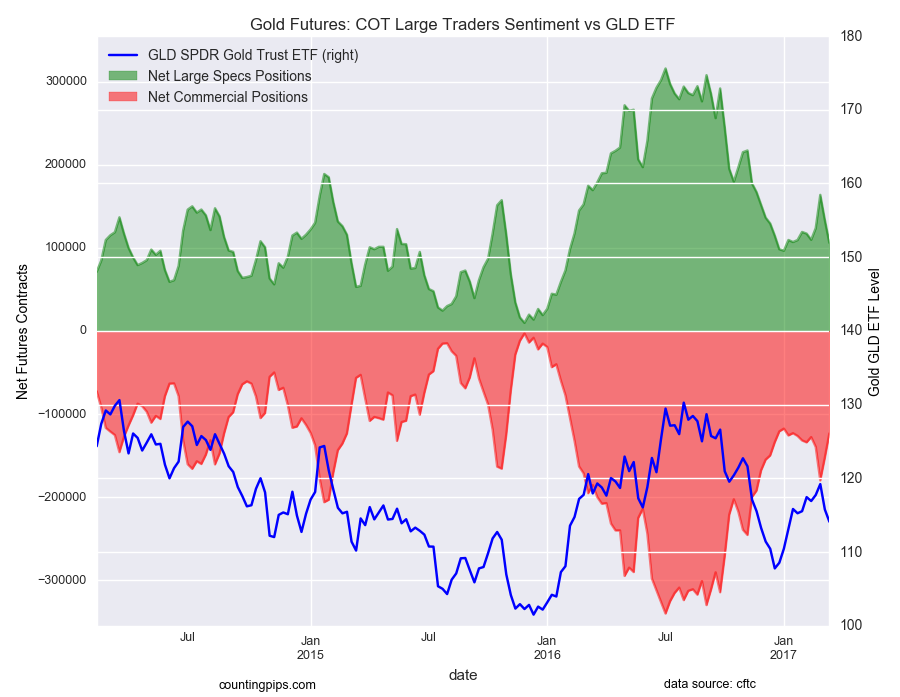
Large speculators reduced their net bullish positions in the gold futures markets last week for a second consecutive week, according to the latest Commitment of Traders (COT) data released by the Commodity Futures Trading Commission (CFTC) on Friday.

The non-commercial futures contracts of Comex gold futures, traded by large speculators and hedge funds, totaled a net position of 106,038 contracts in the data reported through March 14th. This was a weekly drop of -27,647 contracts from the previous week which had a total of 133,685 net contracts.

Gold speculative positions have declined by over 27,000 contracts in each of the past two weeks and have now fallen to the lowest level since February 14th when net positions totaled 109,752 contracts.

Gold Commercial Positions:

The commercial traders position, categorized by the CFTC as hedgers or traders engaged in buying and selling for business purposes, totaled a net position of -123,287 contracts last week. This is a weekly gain of 29,361 contracts from the total net of -152,648 contracts reported the previous week.

Gold ETF:

Over the same weekly reporting time-frame, from Tuesday to Tuesday, the GLD ETF, which tracks the price of gold, closed at approximately $114.12 which was a decline of $-1.66 from the previous close of $115.78, according to ETF financial market data.

*COT Report: The COT data, released weekly to the public each Friday, is updated through the previous Tuesday (data is 3 days old) and shows a quick view of how large speculators or non-commercials (for-profit traders) as well as the commercial traders (hedgers & traders for business purposes) were positioned in the futures markets. The CFTC categorizes trader positions according to commercial hedgers (traders who use futures contracts for hedging as part of the business), non-commercials (large traders who speculate to realize trading profits) and nonreportable traders (usually small traders/speculators). Find CFTC criteria here: (http://www.cftc.gov/MarketReports/CommitmentsofTraders/ExplanatoryNotes/index.htm).

Article by CountingPips.com


10 Year Treasury Note Speculators sharply reduced bearish net positions for 2nd week

By CountingPips.comGet our weekly COT Reports by Email

10 Year Treasury Note Non-Commercial Positions:

Large speculators and traders sharply decreased their bearish net positions in the 10-year treasury note futures markets last week, according to the latest Commitment of Traders (COT) data released by the Commodity Futures Trading Commission (CFTC) on Friday.

The non-commercial futures contracts of 10-year treasury note futures, traded by large speculators and hedge funds, totaled a net position of -194,392 contracts in the data reported through March 14th. This was a weekly change of 104,122 contracts from the previous week which had a total of -298,514 net contracts.

Speculators have cut their bearish positions by over +100,000 contracts for two straight weeks after marking a record high bearish position on February 28th with a total of -409,659 net contracts.

10 Year Treasury Note Commercial Positions:

The commercial traders position, categorized by the CFTC as hedgers or traders engaged in buying and selling for business purposes, totaled a net position of 411,989 contracts last week. This is a weekly decline of -113,320 contracts from the total net of 525,309 contracts reported the previous week.

IEF 7-10 Year Bond ETF:

Over the same weekly reporting time-frame, from Tuesday to Tuesday, the 7-10 Year Treasury Bond ETF (IEF) closed at approximately $103.83 which was a decline of $-0.57 from the previous close of $104.4, according to ETF market data.

*COT Report: The COT data, released weekly to the public each Friday, is updated through the previous Tuesday (data is 3 days old) and shows a quick view of how large speculators or non-commercials (for-profit traders) as well as the commercial traders (hedgers & traders for business purposes) were positioned in the futures markets. The CFTC categorizes trader positions according to commercial hedgers (traders who use futures contracts for hedging as part of the business), non-commercials (large traders who speculate to realize trading profits) and nonreportable traders (usually small traders/speculators). Find CFTC criteria here: (http://www.cftc.gov/MarketReports/CommitmentsofTraders/ExplanatoryNotes/index.htm).

Article by CountingPips.com


WTI Crude Oil Speculators sharply cut their bullish net positions last week

By CountingPips.comGet our weekly COT Reports by Email

WTI Crude Oil Non-Commercial Positions:

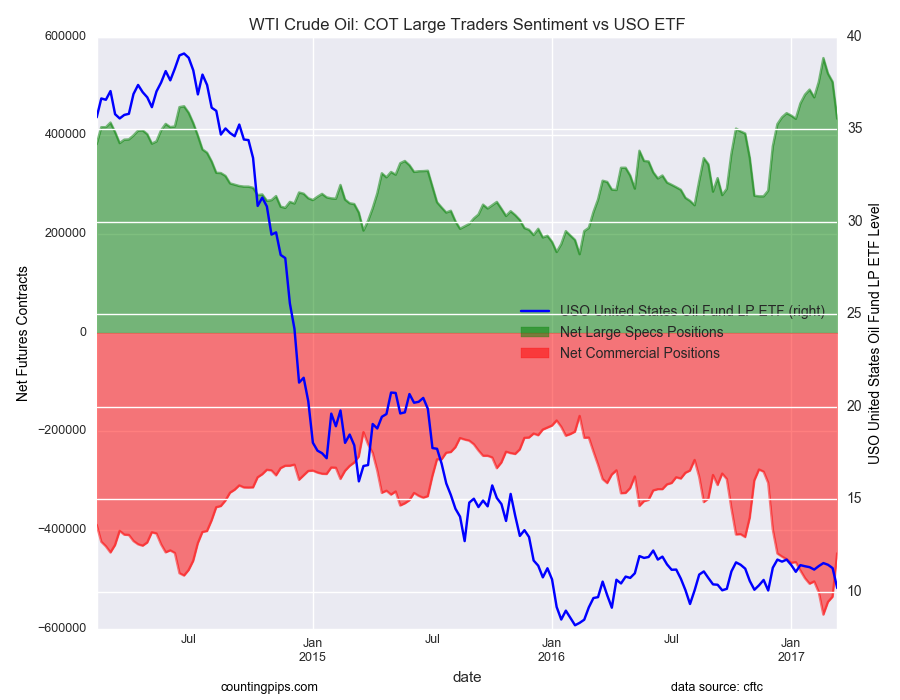
Large speculators and traders sharply cut back on their bullish net positions in the WTI crude oil futures markets last week, according to the latest Commitment of Traders (COT) data released by the Commodity Futures Trading Commission (CFTC) on Friday.

The non-commercial contracts of WTI crude futures, traded by large speculators and hedge funds, totaled a net position of 433,800 contracts in the data reported through March 14th. This was a weekly drop of -74,725 contracts from the previous week which had a total of 508,525 net contracts.

Speculators have now decreased their bullish net positions for three straight weeks after reaching a record high bullish position on February 21st. Last week’s decline marked the largest weekly drop since November 8th 2016 when net positions fell by -76,860 contracts.

WTI Crude Oil Commercial Positions:

The commercial traders position, categorized by the CFTC as hedgers or traders engaged in buying and selling for business purposes, totaled a net position of -447,406 contracts last week. This is a weekly change of 88,093 contracts from the total net of -535,499 contracts reported the previous week.

USO Crude Oil ETF:

Over the same weekly reporting time-frame, from Tuesday to Tuesday, the USO Crude Oil ETF, which tracks the price of WTI crude oil, closed at approximately $10.19 which was a decline of $-1.08 from the previous close of $11.27, according to ETF market data.

*COT Report: The COT data, released weekly to the public each Friday, is updated through the previous Tuesday (data is 3 days old) and shows a quick view of how large speculators or non-commercials (for-profit traders) as well as the commercial traders (hedgers & traders for business purposes) were positioned in the futures markets. The CFTC categorizes trader positions according to commercial hedgers (traders who use futures contracts for hedging as part of the business), non-commercials (large traders who speculate to realize trading profits) and nonreportable traders (usually small traders/speculators). Find CFTC criteria here: (http://www.cftc.gov/MarketReports/CommitmentsofTraders/ExplanatoryNotes/index.htm).

Article by CountingPips.com