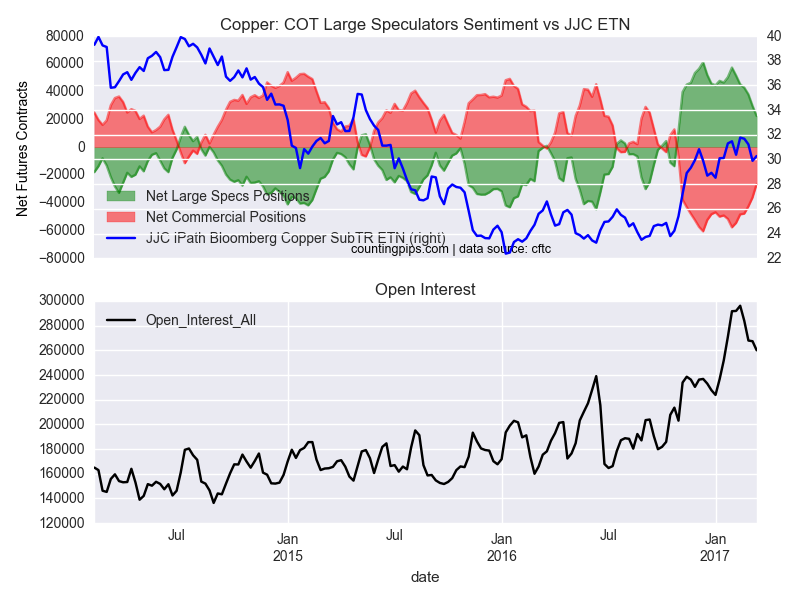
Large speculators and traders continued to decrease their net positions in the copper futures markets last week for a sixth consecutive week, according to the latest Commitment of Traders (COT) data released by the Commodity Futures Trading Commission (CFTC) on Friday.
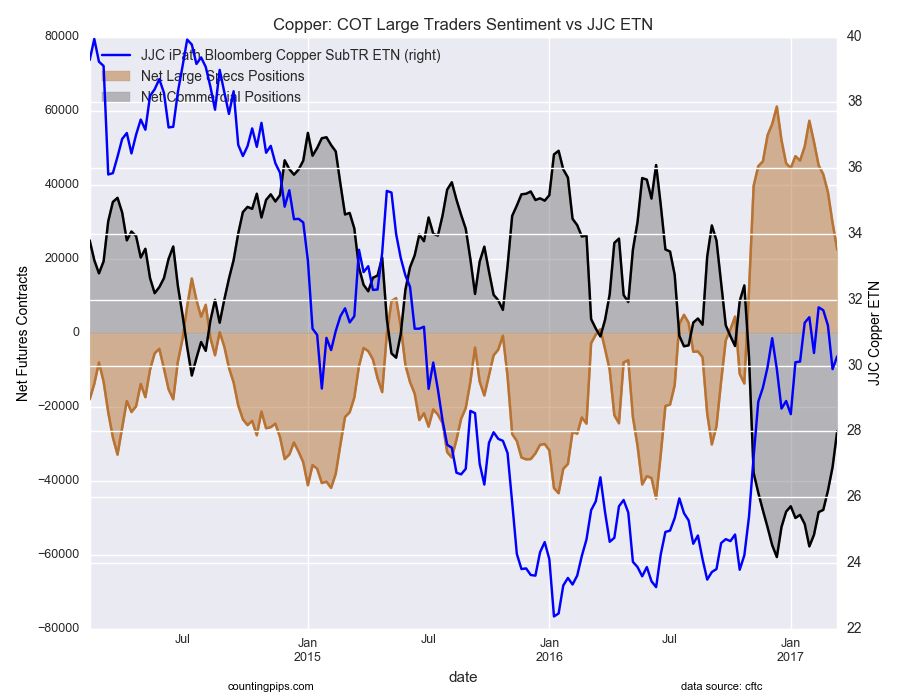
The non-commercial futures contracts of copper futures, traded by large speculators and hedge funds, totaled a net position of 22,439 contracts in the data reported through March 14th. This was a weekly fall of -7,280 contracts from the previous week which had a total of 29,719 net contracts.
Copper speculative positions have fallen by a total of -34,837 contracts over the past six weeks and have reached a new low since November 1st.
Copper Commercial Positions:
The commercial traders position, categorized by the CFTC as hedgers or traders engaged in buying and selling for business purposes, totaled a net position of -26,618 contracts last week. This is a weekly rise of 9,751 contracts from the total net of -36,369 contracts reported the previous week.
Copper ETN:
Over the same weekly reporting time-frame, from Tuesday to Tuesday, the JJC iPath Bloomber Copper ETN, which tracks the price of copper, closed at approximately $30.28 which was a gain of $0.39 from the previous close of $29.89, according to financial market data.
*COT Report: The COT data, released weekly to the public each Friday, is updated through the previous Tuesday (data is 3 days old) and shows a quick view of how large speculators or non-commercials (for-profit traders) as well as the commercial traders (hedgers & traders for business purposes) were positioned in the futures markets. The CFTC categorizes trader positions according to commercial hedgers (traders who use futures contracts for hedging as part of the business), non-commercials (large traders who speculate to realize trading profits) and nonreportable traders (usually small traders/speculators). Find CFTC criteria here: (http://www.cftc.gov/MarketReports/CommitmentsofTraders/ExplanatoryNotes/index.htm).
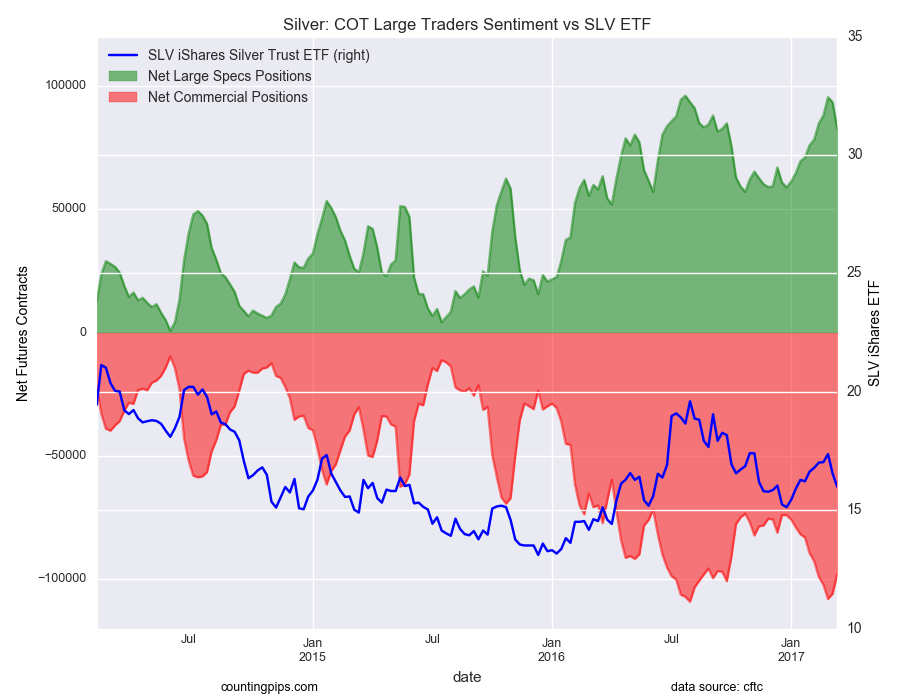
Large speculators decreased their bullish net positions in the silver futures markets for a second week last week following a run of nine straight weekly gains, according to the latest Commitment of Traders (COT) data released by the Commodity Futures Trading Commission (CFTC) on Friday.
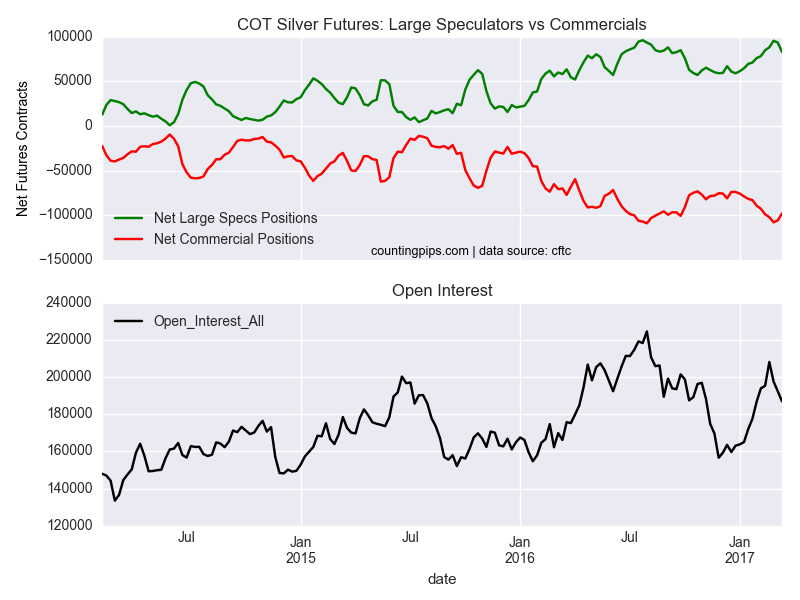
The non-commercial futures contracts of Comex silver futures, traded by large speculators and hedge funds, totaled a net position of 82,878 contracts in the data reported through March 14th. This was a weekly shortfall of -10,575 contracts from the previous week which had a total of 93,453 net contracts.
Silver speculators had pushed their bullish net positions up to their highest level since July 26th 2016 when net positions totaled 96,077 contracts before reducing their bets the past two weeks.
Silver Commercial Positions:
The commercial traders position, categorized by the CFTC as hedgers or traders engaged in buying and selling for business purposes, totaled a net position of -97,999 contracts last week. This is a weekly change of 7,863 contracts from the total net of -105,862 contracts reported the previous week.
Silver ETF:
Over the same weekly reporting time-frame, from Tuesday to Tuesday, the SLV ishares ETF, which tracks the price of silver, closed at approximately $15.99 which was a decline of $-0.56 from the previous close of $16.55, according to ETF financial market data.
*COT Report: The weekly commitment of traders report summarizes the total trader positions for open contracts in the futures trading markets. The CFTC categorizes trader positions according to commercial hedgers (traders who use futures contracts for hedging as part of the business), non-commercials (large traders who speculate to realize trading profits) and nonreportable traders (usually small traders/speculators). Find CFTC criteria here: (http://www.cftc.gov/MarketReports/CommitmentsofTraders/ExplanatoryNotes/index.htm).
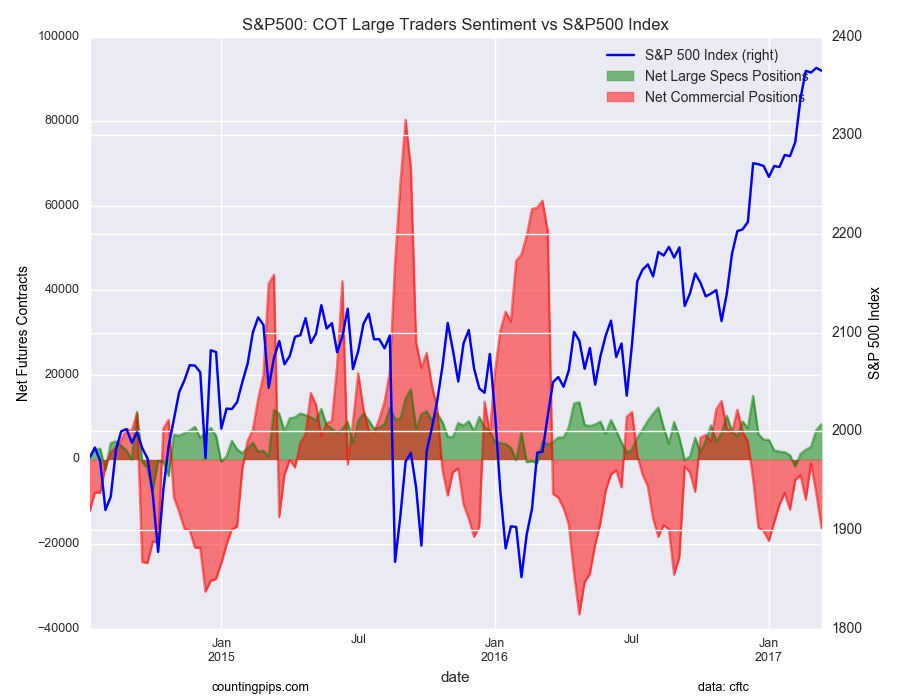
Large speculators and traders increased their net positions in the S&P500 stock futures markets last week for a fifth straight week, according to the latest Commitment of Traders (COT) data released by the Commodity Futures Trading Commission (CFTC) on Friday.
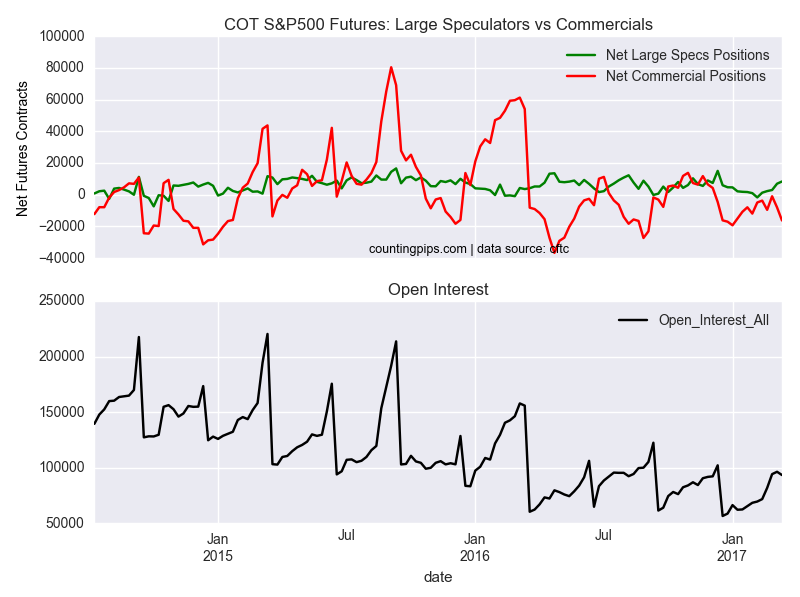
The non-commercial futures contracts of S&P500 futures, traded by large speculators and hedge funds, totaled a net position of 8,350 contracts in the data reported through March 14th. This was a weekly gain of 1,404 contracts from the previous week which had a total of 6,946 net contracts.
Following gains over the last five weeks, speculators have now pushed their bullish bets up to their highest level since December 13th when total bullish net positions equaled 15,031 contracts.
S&P500 Commercial Positions:
The commercial traders position, categorized by the CFTC as hedgers or traders engaged in buying and selling for business purposes, totaled a net position of -16,241 contracts last week. This is a weekly change of -8,253 contracts from the total net of -7,988 contracts reported the previous week.
S&P500 Stock Market Index:
Over the same weekly reporting time-frame, from Tuesday to Tuesday, the S&P500 index closed at approximately 2365.45 which was a dip of -2.93 from the previous close of 2368.38, according to market data.
*COT Report: The COT data, released weekly to the public each Friday, is updated through the previous Tuesday (data is 3 days old) and shows a quick view of how large speculators or non-commercials (for-profit traders) as well as the commercial traders (hedgers & traders for business purposes) were positioned in the futures markets. The CFTC categorizes trader positions according to commercial hedgers (traders who use futures contracts for hedging as part of the business), non-commercials (large traders who speculate to realize trading profits) and nonreportable traders (usually small traders/speculators). Find CFTC criteria here: (http://www.cftc.gov/MarketReports/CommitmentsofTraders/ExplanatoryNotes/index.htm).
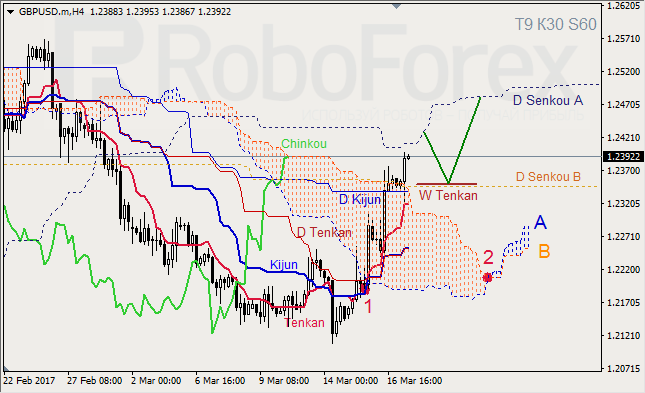
GBP USD, Time Frame H4. Indicator signals: Tenkan-Sen and Kijun-Sen intersected near Kumo’s downside border and formed “Golden Cross” (1). Ichimoku Cloud is heading up (2), Chinkou Lagging Span is above the chart, and the price is inside the daily cloud. Short-term forecast: we can expect resistance from D Senkou Span A, support from W Tenkan-Sen, and growth of the price.
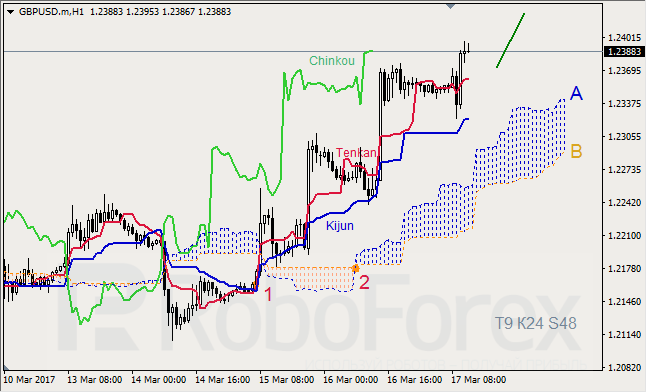
GBP USD, Time Frame H1. Indicator signals: Tenkan-Sen and Kijun-Sen are influenced by “Golden Cross” (1). Ichimoku Cloud is going up (2), Chinkou Lagging Span is above the chart, and the price is above the lines. Short-term forecast: we can expect support from Tenkan-Sen, and growth of the price.
XAU USD, “Gold vs US Dollar”
XAU USD, Time Frame H4. Indicator signals: Tenkan-Sen and Kijun-Sen intersected below Kumo Cloud and formed “Golden Cross” (1); Tenkan-Sen is directed to the upside. Ichimoku Cloud is moving upwards (2), Chinkou Lagging Span is above the chart, and the price is near Kumo’s upside border. Short‑term forecast: we can expect resistance from Senkou Span B, support from W Kijun-Sen, and growth of the price towards W Kijun-Sen.
Attention! Forecasts presented in this section only reflect the author’s private opinion and should not be considered as guidance for trading. RoboForex LP bears no responsibility for trading results based on trading recommendations described in these analytical reviews.
The euro/dollar closed up on Thursday. Before trading closed in Europe, the rate was trading within a 40 point range of 1.0706 to 1.0746. In the first half of the day, the euro’s growth was constrained by the dynamics of the EUR/GBP cross, which started falling after the minutes from the Bank of England’s meeting were published. Just as trading in Europe closed, the EUR/GBP rate closed the gap on the GBP/USD as the EUR/GBP cross grew.
Market expectations:
After reaching the 1.0774 level, the currency pair entered a correctional phase. In Asia, the pair is currently trading within a narrow range. Despite the fact that the buyers’ share of the market is 80%, my forecast for today is looking south. The euro won’t strengthen without a rebound from the balance line. Yesterday, my target wasn’t reached. Perhaps today, before the weekend, we could see the rate reach the 45th degree.
Day’s news (GMT+3):
13:00 Eurozone: trade balance (Jan);
14:00 Eurozone: construction output (Jan);
15:00 UK: BoE quarterly bulletin;
15:30 Canada: manufacturing shipments (Jan);
16:15 USA: industrial production (Feb), capacity utilization (Feb);
17:00 USA: Michigan Consumer Sentiment Index (Mar), CB leading indicator (Feb);
17:00 Belgium: CCI (Mar);
20:00 USA: Baker Hughes US oil rig count.
EURUSD rate on the hourly. Source: TradingView
Intraday forecast: low: 1.0724, high: 1.0774 (current in Asia, possible growth to 1.0790), close: 1.0720.
Buyers twice tried and failed to break through the level at 1.0694. A sharp reversal on the cross after trading closed in Europe brought about a strengthening of the single currency to 1.0774. This growth slowed at around the 157th degree.
Cyclical and graphical analyses indicate that the euro will weaken today. At the moment, I can’t see any technical factors that would provide support to buyers around the MA line U3. I’ve written above that before any growth can happen, we need to see a correction towards the balance line. In the case of strong movement, it’s better if the rate doesn’t go higher than the U2 line because the stronger the growth, the sharper the subsequent rebound will be.
I’m not ruling out the formation of an ending diagonal triangle. Only in this case will the rate quickly return to 1.0706. The maximum on it should be around 1.0785/90. For Friday, I’m expecting some correctional movement to the 45th degree at 1.0724. Levels at 1.0748 (22 degrees) and 1.0739 (channel from 1.0746) will act as supports. In making my predictions, there was one thing that gave me cause for concern. According to myfxbook, short positions currently have 80% of the market share. The faster the rate reaches the level at 1.0748, the likelier my target will be reached. Some bearish divergences have formed on the AO and CCI (20) indicators.
Positives for the euro (+):
Fundamental:
(+) US president Donald Trump favours a weaker dollar;
(+) The threshold for acceptable US government debt of 20.1 trillion USD may be reached by March this year. This will create headaches for new US president Donald Trump. A new law on the debt ceiling will come into force on the 16th of March 2017;
(+) The Greek government has made some progress in its talks with international creditors on the second stage of their reform program;
(+) Head of the ECB, Mario Draghi, has hinted that the central bank may not need to provide any further stimulus to revitalise Europe’s economy. From April to December 2017, the ECB will reduce their monthly assets purchases to 80 to 60 billion EUR;
(+) ECB bosses have discussed the possibility of raising interest rates before the QE program comes to an end;
(+) Ewald Nowotny, a member of the ECB’s governing council, has said that the bank could raise the deposit rate before the main refinancing rate;
Technical (short-term):
(+) Long/short ratio according to myfxbook as of 7:11 EET: 80%/19%, lots: 28751/6966 (previous day: 24304/11716), positions: 72135/23227 (previous day: 62780/33193);
(+) German 10-year bond yields: 0.447% (up 7.9% from 16/03/17);
(+) EURGBP (W): the CCI (20), AO, AC and the Stochastic (5,3,3) are moving upwards. the trend line has been broken through;
(+) EURUSD (M): the Stochastic (5,3,3) is moving upwards;
(+) EURUSD (W): The Stochastic (5,3,3), AO, AC, and CCI (20) are moving upwards;
(+) EURUSD (D): the AO, AC and Stochastic (5,3,3) indicators are moving upwards;
Negatives for the euro (-):
Fundamental:
(-) According to CME Group’s FedWatch Tool, as of Thursday the 16th of March, the probability of a rate hike in May has fallen from 93.5% to 6.4%. The probability in June has gone up from 49.6% to 54.0%, and in July from 58.3% to 62%;
(-) Political uncertainty in Europe (French elections and Brexit);
Technical factors (short-term):
(-) According to data from 07/03/17, large speculators on the Chicago Exchange have increased their long and decreased their short positions. Long positions have fallen by 5,404 to 137,358 contracts, while short positions have grown by 8,820 to 196,124 contracts. Net short positions have grown from 44,542 to 58,766 contracts.
(-) US 10-year bond yields: 2.542% (up 1.68% from 16/03/17). In Asia, US 10Y bond yields have grown by 0.44% to 2.535%;
(-) EURUSD (M): the AO and AC indicators are moving downwards;
(-) EURUSD (D): the CCI (20) is moving downwards;
(-) EURGBP (D): the AO, AC, CCI (20), and Stochastic (5,3,3) indicators are moving downwards;
Built into the price:
(-) The Ex-Prime Minister of France, Alain Juppe, has ruled himself out of participating in the presidential election;
(+) François Bayrou, leader of the “Democratic Movement” party, has ruled out running for the presidency and thrown his weight behind independent candidate Emmanuel Macron;
(+) Marine Le Pen has had her EU parliamentary immunity from prosecution lifted for political reasons.
The EUR/USD pair has formed another consolidation range in the form of the Triangle pattern and broken it to the upside. Possibly, the price may grow to reach 1.0782. After that, the instrument may fall to expand the range to the downside. The target is at 1.0650.
GBP USD, “Great Britain Pound vs US Dollar”
The GBP/USD pair has broken its consolidation range upwards. Possibly, the price may reach 1.2383. Later, in our opinion, the market may form the fifth descending wave with the target at 1.2072.
USD CHF, “US Dollar vs Swiss Franc”
The USD/CHF pair has broken its consolidation range downwards. Possibly, the price may expand it towards 0.9950. After that, the instrument may break the range to the downside and grow to reach the first target at 1.0070.
USD JPY, “US Dollar vs Japanese Yen”
The USD/JPY pair is consolidating near its lows. Possibly, today the price may fall towards 112.32. Later, in our opinion, the market may start growing with the target at 113.92.
AUD USD, “Australian Dollar vs US Dollar”
The AUD/USD pair is consolidating. If later the market breaks this consolidation range to the downside, it may be corrected to reach 0.7612; if to the upside – grow with the target at 0.7732. After that, the instrument may start another decline towards 0.7620.
USD RUB, “US Dollar vs Russian Ruble”
The USD/RUB pair is still consolidating; it has completed the descending correctional structure. Possibly, today the price may grow to reach 58.81.
XAU USD, “Gold vs US Dollar”
Gold is still consolidating as well. Possibly, today the price may expand the range towards 1236. Later, in our opinion, the market may form another descending structure to reach 1205.
BRENT
Brent has completed the ascending impulse. Possibly, today the price may be corrected towards 51.28. After that, the instrument may break the top of this impulse. The target is at 54.50.
Attention! Forecasts presented in this section only reflect the author’s private opinion and should not be considered as guidance for trading. RoboForex LP bears no responsibility for trading results based on trading recommendations described in these analytical reviews.
Bitcoin has climbed to a new record high in 2017 above $1,250. Notably, the price of bitcoin is now higher than the price of one ounce of gold. But the cryptocurrency Dash is the stealing the spotlight. While bitcoin is up 200% year to date in 2017, the price of dash is up 2,500% from less than $4 to over $100!
Dash stands for digital cash and was rebranded from Darkcoin back in March of 2015. It is a digital cryptographic currency much like bitcoin, but it has some key advantages that have led to people dubbing it “Bitcoin 2.0.” While bitcoin takes at least 10 minutes to confirm a transaction and can take hours if the fee isn’t high enough, dash features InstantSend payments that confirm is less than a second.
Dash also features much greater privacy than bitcoin. PrivateSend ensures that your activity history and balances are private. Perhaps the move innovative part of the dash network is their use of masternodes. This makes dash a unique fully-incentivized peer-to-peer network. Miners are rewarded for securing the blockchain and masternodes are rewarded for validating, storing and serving the blockchain to users. Masternodes represent a new layer of network servers that work in highly secure clusters called quorums to provide a variety of decentralized services, like instant transactions, privacy and governance, while eliminating the threat of low-cost network attacks.
Dash is the fastest growing cryptocurrency at the moment and has quickly risen to the #3 spot by market capitalization. At $729 million, it has surpassed Ripple, Monero and Litecoin. While it is a distant third place behind Ethereum, the market cap is now nearly 3X Monero and Ripple. Dash has also become the most active altcoin community on BitcoinTalk reaching more than 6300 pages, 127k replies, 7.7M reads.
Another cool features of dash is that is offers the first self governing, self funding protocol of its kind. In Dash, everyone has a voice and the ability to propose projects directly to the network. Anything you can do – from marketing to development – that helps Dash grow and improve can be funded. This means Dash funds its own growth and adoption, consensus is guaranteed, and everyone is accountable to the network. Just submit a treasury proposal and present your idea to the network for funding and make your case, or if you operate a Masternode, you can vote. This is known as a decentralized autonomous organization (DAO).
In order to run a masternode, a user must put up 1000 DASH as something akin to collateral, though unlike traditional collateral, the Dash never leaves the user’s possession. It can be moved or spent at any time by the user – doing so simply removes the masternode from service and makes it ineligible to receive rewards. In return for providing these services, one Masternode is selected by the network to receive a part of the reward of each mined block. 45% of the block reward is dedicated to this Masternode which at its current rate works out to be 1.94 dash ($200 at current rates).
Think of a masternode as a savings account with a minimum deposit of 1,000 DASH. A traditional savings account pays interest, and a masternode pays rewards which are very much like interest. In the case of a masternode, the reward (or interest) comes from performing services for the network. Not from lending. The big difference between a traditional savings account and a masternode is that your initial deposit never leaves your possession.
Dash Criticisms
1.9 million coins were mined in 48 hours, or approximately 27% of the current supply (as of March 2017) of approximately 7.1 million, generating controversy regarding the initial distribution of coins. According to core developer Evan Duffield, the so-called “instamine” was the result of an error in the code “which incorrectly converted the difficulty, then tried using a corrupt value to calculate the subsidy, causing the instamine.”
Some have speculated that this “instamine” was intentional and designed to enrich the coin’s creator, Evan Duffield. Others have pointed out that Duffield had the opportunity to quit the project and cash out any of his “instamined” coins during the major price bubble of May 2014, yet he still works full time as a Dash developer, as of March 2017.
Summary
Many believe that as bitcoin grapples with infighting over how to reduce confirmation times and fees, another digital currency will step in to fill the void. Dash may very well be that currency or bitcoin 2.0. There is no doubt that it offers competitive advantages to bitcoin and that people are flocking to dash in a way they haven’t to any other alt coins. Those that bought dash just a few months ago have seen their investment increase by 25X. If you invested $40,000 into dash at the beginning of 2017, you would be sitting on $1 million right now!
While our focus at Gold Stock Bull is on precious metals, we were early adopters of bitcoin and first recommended the cryptocurrency to subscribers back in 2013 when it was around $100. It is currently trading for $1,250. We alerted subscribers to the potential of dash recently and the price has more than doubled from our entry point in a very short time period. We continue to monitor and track upcoming digital currencies, while providing an update in our monthly newsletter.
Gold investors are skeptical of cryptocurrencies that are not physical objects that can be held in your hand. There are countless articles comparing bitcoin to gold, now that the bitcoin price has eclipsed the gold price. Analysts and commentators fight about which is better and why, but I believe they are complimentary currencies. Investors stand to benefit from owning both, as they serve different purposes. Yet, they do have some things in common, such as the fact that their supply is stricly limited and it takes a good deal of energy to mine both. They are outside of the traditional banking system and not controlled by central bankers.
We created a “Guide to Investment in Bitcoin” for our subscribers and send regular updates on not only precious metals, energy, cannabis and emerging technology stocks, but also the cryptocurrency space and our view on the best investments. Click here to sign up!
EUR/USD: Less hawkish Fed and Dutch election supported EUR/USD
Macroeconomic overview
The Fed delivered its first rate hike of the year – and the third increase since late 2015, when it began to normalize its policy stance. Yesterday’s move was universally expected and completely priced in by financial markets, after the most influential Fed members had all but preannounced the move at the beginning of the month, and last week’s strong employment report removed the last faint shadow of doubt.
Given that the Fed had raised rates only once per year in both 2015 and 2016, it is now only one hike away to fulfill Chair Yellen’s recent pledge that “the process of scaling back accommodation likely will not be as slow as it was in 2015 and 2016.” But the question remains, how much the pace of rate hikes is going to accelerate. Accordingly, the main focus yesterday was on the medium term policy outlook. And the latter has completely been left unchanged. First, the statement reiterated that “The Committee expects that economic conditions will evolve in a manner that will warrant gradual increases in the federal funds rate.” Second, the FOMC members’ median interest projections (the “dots”) continue to signal three rate hikes for 2017 (including yesterday’s move) followed by another three in 2018. The unchanged policy outlook went hand-in-hand with an unchanged economic outlook. The updated GDP, unemployment and inflation forecast were essentially the same as in December.
The only notable changes in the statement were all related to inflation. Here, the FOMC acknowledged twice that the 2% target has basically been met. At the same time, however, the statement highlighted that the inflation target is symmetric, which means that the Committee is willing to tolerate a temporary overshoot, and that the Fed wants to see a “sustained” return to 2% inflation. This clearly helped to avoid sending a too hawkish message. Overall, the Fed now seems to be happy with its own outlook for three hikes per year, and the fact that financial markets agree with this projection.
The EUR/USD was supported not-only by less hawkish Fed, but also by Dutch election exit polls that pointed to a comfortable win by the prime minister over his far-right rival.
Dutch centre-right Prime Minister Mark Rutte scored a resounding victory over anti-Islam and anti-EU Geert Wilders in an election on Wednesday, offering huge relief to other governments across Europe facing a wave of nationalism. Rutte declared it an “evening in which the Netherlands, after Brexit, after the American elections, said ‘stop’ to the wrong kind of populism.” With around 95% of votes counted, Rutte’s VVD Party won 33 of parliament’s 150 seats, down from 41 at the last vote in 2012. Wilders was second with 20, the CDA and centrist Democrats 66 tied for third with 19 each.
Technical analysis
The EUR/USD jumped yesterday after the Fed decision, pretty in line with our expectations. It broke and closed above the 1.0714 resistance (high on March 13). The rally was stopped near 1.0748, 76.4% fibo of February drop, but the momentum remains bullish.
Trading strategy
We stay EUR/USD long for 1.0820.
USD/JPY: BoJ kept its policy unchanged, as widely expected
Macroeconomic overview
The Bank of Japan maintained its short-term interest rate target of minus 0.1 and a pledge to guide the 10-year government bond yield at around zero percent. It also kept intact a loose pledge to maintain the pace of its annual increase in Japanese government bond holdings, which is JPY 80 trillion.
The move was in stark contrast to the U.S. Federal Reserve’s decision hours earlier to hike interest rates for the second time in three months in an effort to return policy to a more normal footing.
Bank of Japan Governor Haruhiko Kuroda made clear the BOJ would not follow the Fed’s footsteps any time soon, saying that Japan still needed massive monetary support with inflation distant from the bank’s 2% target and risks to growth skewed to the downside. He shrugged off market speculation the BOJ may raise its target on bond yields later this year, when consumer inflation is expected to approach 1% due mostly to a rebound in fuel costs and rising import prices from a weak yen. Instead of looking at a single price data point, the BOJ will take into account various factors like the health of the economy and long-term inflation expectations, he said.
Japan’s long-stagnant economy has shown signs of life in recent months, with exports and factory output benefitting from a recovery in global demand. Core consumer prices rose for the first time in over a year in January and analysts expect them to continue to pick up slowly but steadily. That has led to a dramatic shift in market expectations, with the market predicting the BOJ’s next move would be to start scaling back its ultra-easy policy. The BOJ may be forced to raise its yield target to avoid ramping up bond purchases if Japanese long-term interest rates track global bond yield rises, which are being driven by expectations of higher U.S. interest rates. Kuroda rebuffed such a view, saying that he does not see the need to raise the yield target just because the Fed is doing so.
U.S. President Donald Trump has accused Japan for using “money supply” to weaken the yen and give its exports an unfair trade advantage. Kuroda stressed the BOJ’s easing was aimed at beating deflation, and that interest rate differentials between Japan and the United States alone would not determine currency moves.
Technical analysis
The USD/JPY dropped after yesterday’s Fed statement, as we expected. It broke below 113.11 support (61.8% retrace of the February-March rise). 112.59 (76.4% retrace) is now unmasked for a retest.
Trading strategy
We have lowered the target on the USD/JPY short to 112.90.
AUD/USD: Fed offsets underwhelming Australian jobs data
Macroeconomic overview
Australia’s employment fell 6.4k in February against a forecast rise of 16k, while the jobless rate ticked up to 5.9% from 5.7%.
But the structure of the employment report was not that bad. The employment fall was made up of a rise of 27.1k in full-time employment, while part-time employment fell 33.5k.
The AUD/USD gained 2% on Wednesday trading in New York, after the Fed disappointed USD bulls with a less aggressive rate hike projection than they had wagered on. The AUD/USD briefly touched a three-week peak of 0.7720 where it ran into heavy resistance. It dipped nearly a quarter of a U.S. cent after a disappointing jobs report.
Technical analysis
The AUD/USD rally off the March low extends to a new high. RSIs are biased up and a long lower wick forms on the monthly candle so further gains look likely. The 7-day exponential moving average exceeded 14-day ema and both averages are positively aligned, which highlights the overall bullish structure.
Trading strategy
Our AUD/USD long is well in black now. We expect further gains in the coming sessions and keep our target at 0.7730.
NZD/USD: New Zealand’s GDP data below expectations on weaker exports
Macroeconomic overview
Statistics New Zealand said GDP rose 0.4% in October-December from the previous three months. That was below market forecast of 0.7% and the slowest growth since the quarter ended in June 2015. The miss was mostly due to heavy spring rain that cut pivotal dairy production and exports.
In October-December, exports were hit hard by a 7.5% fall in production from the previous quarter for dairy, New Zealand’s top commodity. Traditionally volatile manufacturing, mining and forestry exports also fell.
On an annual basis, fourth-quarter growth was 2.7%, lower than the market forecast of 3.1% and notably below the Reserve Bank of New Zealand’s prediction for annual expansion of 3.7% in the current quarter.
New Zealand’s economy is likely to be growing at a slower rate compared to the central bank’s forecasts over 2017. Recent GDP reading reinforces the view that interest rate hikes are quite some way away.
On March 23, the RBNZ hold a policy meeting, at which it is expected to keep the key rate at a record low 1.75%.
Technical analysis
The NZD/USD broke above 23.6% fibo of February-March drop and 14-day exponential moving average yesterday. A close above these levels today will be a strong bullish signal. The next resistance levels are: 38.2% fibo at 0.7076 and 50% fibo at 0.7133.
Trading strategy
Our NZD/USD long is still in play after yesterday’s recovery. Near-term outlook remains bullish.
EUR/CHF: SNB kept negative rates on hold
Macroeconomic overview
The Swiss National Bank kept its target range for three-month Swiss franc Libor at -1.25% to -0.25% and the rate it charges on sight deposits at -0.75%.
The SNB reiterated its vow to intervene on currency markets when needed to rein in the franc, which it said remained “significantly overvalued”. The SNB kept its forecast for the export-led Swiss economy to grow around 1.5% in 2017, but lifted its inflation forecast to 0.3% from 0.1%.
The SNB has been stepping up attempts to weaken the franc as the currency has attracted safe-haven flows from investors concerned by the potential break-up of the Eurozone. The French election starting next month has been driving demand for the Swiss currency, with anti-EU candidate Marine Le Pen leading polls ahead of the first round, although she is not expected to win the French presidency. The success of Dutch Prime Minister Mark Rutte over anti-EU candidate Geert Wilders in Wednesday’s Dutch election offered some relief to governments across Europe facing a wave of nationalism.
Technical analysis
The neutral SNB statement supported the Swiss franc and the EUR/CHF has lost all it gained after yesterday’s Fed decision. The EUR/CHF remains above 14-day exponential moving average, which is still positively aligned. On the other hand, the rejection of upward trend on March 13 weighs on the market. The nearest support levels are 1.0691 low on March 9 and 1.0688 low on March 8. A close below these levels may open the way to full retracement of February-March rise.
Trading strategy
We stay EUR/CHF long at 1.0710. We think that latest data from the Swiss economy do not allow for thinking about removing of the monetary accommodation. On the other hand, the speculations on interest rate hikes in the Eurozone are likely to strengthen.
TRADING STRATEGIES SUMMARY:
FOREX – MAJOR PAIRS:
FOREX – MAJOR CROSSES:
PRECIOUS METALS:
It is usually reasonable to divide your portfolio into two parts: the core investment part and the satellite speculative part. The core part is the one you would want to make profit with in the long term thanks to the long-term trend in price changes. Such an approach is a clear investment as you are bound to keep your position opened for a considerable amount of time in order to realize the profit. The speculative part is quite the contrary. You would open a speculative position with short-term gains in your mind and with the awareness that even though potentially more profitable than investments, speculation is also way more risky. In typical circumstances investments should account for 60-90% of your portfolio, the rest being speculative positions. This way, you may enjoy a possibly higher rate of return than in the case of putting all of your money into investment positions and at the same time you may not have to be afraid of severe losses in the short-term.
How to read these tables?
1.Support/Resistance – three closest important support/resistance levels 2. Position/Trading Idea: BUY/SELL – It means we are looking to open LONG/SHORT position at the Entry Price. If the order is filled we will set the suggested Target and Stop-loss level. LONG/SHORT – It means we have already taken this position at the Entry Price and expect the rate to go up/down to the Target level. 3. Stop-Loss/Profit Locked In – Sometimes we move the stop-loss level above (in case of LONG) or below (in case of SHORT) the Entry price. This means that we have locked in profit on this position. 4. Risk Factor – green “*” means high level of confidence (low level of uncertainty), grey “**” means medium level of confidence, red “***” means low level of confidence (high level of uncertainty) 5. Position Size (forex)– position size suggested for a USD 10,000 trading account in mini lots. You can calculate your position size as follows: (your account size in USD / USD 10,000) * (our position size). You should always round the result down. For example, if the result was 2.671, your position size should be 2 mini lots. This would be a great tool for your risk management! Position size (precious metals) – position size suggested for a USD 10,000 trading account in units. You can calculate your position size as follows: (your account size in USD / USD 10,000) * (our position size). 6. Profit/Loss on recently closed position(forex) – is the amount of pips we have earned/lost on recently closed position. The amount in USD is calculated on the assumption of suggested position size for USD 10,000 trading account. Profit/Loss on recently closed position (precious metals) – is profit/loss we have earned/lost per unit on recently closed position. The amount in USD is calculated on the assumption of suggested position size for USD 10,000 trading account. About the Author:
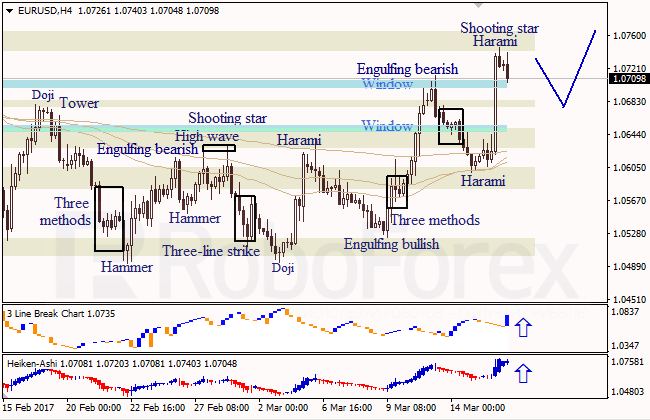
At the H4 chart of EUR USD, bearish Shooting Star and Harami patterns indicate a descending correction. Three Line Break chart and Heiken Ashi candlesticks confirm a bullish direction.
At the H1 chart of EUR USD, bearish Shooting Star pattern indicated a descending movement. Three Line Break chart shows a bullish direction; Heiken Ashi candlesticks confirm a descending pullback. The upside Window is a support level.
USD JPY, “US Dollar vs. Japanese Yen”
At the H4 chart of USD JPY, bullish Hammer pattern indicates an ascending correction. Three Line Break chart and Heiken Ashi candlesticks confirm a bearish direction.
Attention! Forecasts presented in this section only reflect the author’s private opinion and should not be considered as guidance for trading. RoboForex LP bears no responsibility for trading results based on trading recommendations described in these analytical reviews.
Being influenced by the news, the EUR/USD pair has completed the fifth wave of the correction and reached 1.0740. At the moment, the market is consolidating at the top. Possibly, the price may form a reversal pattern. After breaking the channel of the fifth wave, the instrument may start falling to reach 1.0620.
GBP USD, “Great Britain Pound vs US Dollar”
The GBP/USD pair has completed another structure and returned to 1.2300. Later, in our opinion, the market may break the channel of this ascending wave and start falling with the target at 1.2095.
USD CHF, “US Dollar vs Swiss Franc”
Being under pressure, the USD/CHF pair is still moving downwards. Possibly, the price may form another consolidation range. After breaking the range to the upside, the instrument may complete the descending wave. The upside target is at 1.0100.
USD JPY, “US Dollar vs Japanese Yen”
The USD/JPY pair continues moving downwards. At the moment, the market is consolidating. Possibly, the price may expand this range towards 112.85. After that, the instrument may grow with the target at 114.00.
AUD USD, “Australian Dollar vs US Dollar”
The AUD/USD pair has reached the local target and right now is moving upwards. Possibly, the price may fall towards 0.7600 and then start another ascending structure to reach 0.7700.
USD RUB, “US Dollar vs Russian Ruble”
The USD/RUB pair is still trading above 58.60 and may grow to reach 59.70. Later, in our opinion, the market may fall to reach 58.26 and then start growing with the target at 60.70.
XAU USD, “Gold vs US Dollar”
Gold has broken its consolidation range to the upside and reached the local target. Possibly, today the price may fall towards 1212. After that, the instrument may form another ascending structure to reach 1230.
BRENT
The market has opened with a gap up and Brent has broken 52.00. In fact, the instrument is growing towards 54.50. Possibly, today the price may consolidate around 52.00. After breaking the range to the upside, the instrument may grow to reach the first target. Later, in our opinion, the market may be corrected to return to 52.00.
Attention! Forecasts presented in this section only reflect the author’s private opinion and should not be considered as guidance for trading. RoboForex LP bears no responsibility for trading results based on trading recommendations described in these analytical reviews.
 By CountingPips.com – Get our weekly COT Reports by Email