Start simple, with the basic 5 “core” Elliott wave chart patterns
By Elliott Wave International
Jeffrey Kennedy, a recognized expert in Elliott wave analysis and forecasting, explains why the Wave Principle is such a reliable and powerful way to forecast the financial markets.
Jeffrey stresses that if you understand — and practice — the basics of the Wave Principle, you’ll be surprised how much it can impact your analysis and trading results.
Spend March 20-24 getting free trading lessons that you can apply to your trading immediately — from one of the world’s foremost market technicians, Jeffrey Kennedy. You’ll learn about Elliott waves, Fibonacci analysis, indicators and oscillators, Japanese candlesticks and more! Register now for your FREE week of trading lessons and get immediate access.
This article was syndicated by Elliott Wave International and was originally published under the headline Trading with Elliott Waves Doesn’t Have to Be Complicated. EWI is the world’s largest market forecasting firm. Its staff of full-time analysts led by Chartered Market Technician Robert Prechter provides 24-hour-a-day market analysis to institutional and private investors around the world.
Even if Marine Le Pen would win the first round of French presidential election, she would face great odds in the second. Yet, in one sense, she has already won. In France, the political future belongs to her agenda.
After Prime Minister Mark Rutte was able to deter the surge of radical-right Geert Wilders in the recent Dutch elections, the EU leaders sighed for relief. In international media, the center-right Rutte’s win was reported as triumph for “democracy.” In reality, it was boosted by his appeal to Dutch ethnocentrism.
After months behind Wilders in polls, Rutte stated that he shared feelings of those who thought that people who “refuse to adapt and criticize our values should “behave normally, or go away.” The pre-election clash between the Netherlands and Turkey allowed Rutte also to play the same card internationally. The tacit signal was: Why would you want to vote for Wildeers, if I can deliver the same goods?
By the same token, the real story of the French election is not whether the winner is Macron, but that the winning agenda has been re-defined by the rise of Marine Le Pen.
Less integrated Europe, ah oui!
Domestically, the new president will struggle to push for (subdued) structural reforms with or without the consent of the unions, while taking a stricter view of immigration and a tougher stance against Islamic fundamentalism.
France will have a more critical stance toward further EU integration, and the euro, which the French voters now share from center-right to center-left. In practice, that means a “multi-speed Europe,” in which one size will not fit all, while uneven development will increase. Integration will make room for fragmentation, which will be called “differentiation” because the latter sounds better.
As Hollande himself recently acknowledged: “For a long time, the idea of a differentiated Europe, with different speeds and distinct paces to progress, has provoked a lot of resistance. But today this idea is necessary. Otherwise, Europe will explode.”
In Brussels, Macron is seen as a potential savior of France and the EU. The greatest fear of the EU leaders involves Le Pen’s quest to unilaterally take France out of the Euro in 6 months, which would be followed by the effective redenomination of €1.7 trillion of French public debt into francs. Since 80 percent of this debt is not under international law, FN would have the right to change the currency.
Unsurprisingly, the international ratings agencies, which are headquartered in the US and the (about to Brexit) UK, have already warned that the net effect would be the largest sovereign default on record, nearly 10 times larger than the €200bn Greek debt restructuring in 2012.
Like biblical prophets, Le Pen’s adversaries have warned that her victory would mean a French Armageddon, the plunge of euro, and chaos in the world financial system. In contrast, Le Pen’s economic advisers argue that reintroducing a national currency would allow French franc to fall in value against the euro. That, in turn, would lower France’s total debt burden and permit Paris to begin competitive devaluation.
After all, Le Pen might say, isn’t that something Americans have excelled for decades? The franc served the French well for centuries, while the euro has caused the French and many other European economies one nightmare after another after just one decade, she might add,
If Le Pen wins, Paris will also start a process that could ultimately result in a ‘Frexit.’ That’s something that would be unthinkable to the Europhile Macron.
More independence in foreign policy
Like her supporters in right and left, Le Pen believes in French patriotism that relies on a sovereign state that is not reliant on conservative capital, socialist class struggle or Washington’s neoconservative tutelage. That’s classic Gaullism, which stresses national sovereignty and unity. Macron would not use the same terms, but he does emphasize French national interest, along with EU federalism.
Neither De Gaulle nor the Gaullists supported Europe as a supranational entity. However, they favored European integration as a confederation of sovereign states engaged in common policy, and autonomous from the superpowers, such as the United States and the bygone Soviet Union. That project failed as other European powers chose to remain closely allied to Washington. While all French candidates see France among the West, none advocate Sarkozy-like reliance on Washington any more.
In foreign policy, the new president will be more cooperative with Russia and President Putin, from the Middle East to Ukraine and energy issues. While France may actually invest more in defense spending, Gaullism is predicated on greater skepticism toward the NATO and harder push for French national priorities.
In foreign policy, Macron is closest to Washington and his team has suggested that Russia may be intervening in the French election. Other candidates do not share his view and France is not as vulnerable to Russophobia as the United States. Furthermore, recent Wikileaks disclosures suggest that it is not so much Moscow that Paris should be concerned about – but Washington.
US efforts to shape French elections
In the 2012 French presidential election – as classified CIA “tasking orders” indicate – the agency engaged in a spying campaign ahead of the election. The documents reveal that all major French political parties were targeted for infiltration by the CIA’s human and electronic spies in the seven months leading up to France’s 2012 presidential election. According to the most recent WikiLeaks documents, televisions, smartphones and even anti-virus software are all vulnerable to CIA hacking, which makes any effort to shape the outcome of the impending elections and referendums in Europe relatively easy.
There is no reason to presume that these practices have changed. Washington and Pentagon favor pro-NATO candidates and will walk the talk. However, the two also tend to like candidates, who portray themselves as “beyond left and right,” as Macron has done, but who understand the US interests. That’s what he proved
already in 2012 when he joined the pro-US French-American Foundation (FAF). It is a think-tank that was launched by the US-based Council on Foreign Affairs in the 1970s to counter anti-French sentiment in the US and anti-Americanism among the French elite.
As a FAF “Young Leader,” Macron is walking in the footprints of Bill and Hillary Clinton in the US, and president Hollande and former prime minister Alain Juppé in France. Unlike Le Pen who wants more independence, or Fillon who believes in realpolitik, not to speak of anti-NATO socialists, only Macron is seen as a proven quantity in Washington.
About the Author:
Dr Steinbock is the founder of DifferenceGroup. He has served as Research Director of International Business at India China and America Institute (USA) and Visiting Fellow at Shanghai Institutes for International Studies (China) and the EU Center (Singapore). For more, see www.differencegroup.net
The original commentary was published by The World Financial Review on March 21, 2017
The EUR/USD held under 1.0800 for a second day on Thursday as investors awaited a vote on Republican healthcare plans seen as a litmus test of President Donald Trump’s ability to legislate in Congress.
Dallas Federal Reserve Bank President Robert Kaplan said the Federal Reserve should raise interest rates two more times this year and continue work on a plan to gradually trim its massive balance sheet. “We are still accommodative and I think it’s very appropriate for us to be accommodative,” he said. If inflation rises above the Fed’s 2% target for a brief period, it is not going trigger faster rate hikes as long as it is not a persistent trend, he said.
Kaplan also said he is “mindful” that some of the policies expected under President Donald Trump’s new administration, including changes to immigration and trade policies and changes to health insurance, could slow economic growth or hurt consumer spending. He and his staff have been trying to figure out why some of the latest readings on consumer spending already suggest some sluggishness, and will keep a close eye on those figures going forward.
But, he said, he will not be factoring in impacts from Trump’s new policies, including those like tax reform that may boost growth, until he is pretty sure they will be enacted.
The final of the ECB’s TLTRO2 operations will be conducted today and while the consensus sits around EUR 110-125 billion. Theoretically demand can be above EUR 1 trillion. There are two factors which suggest an above consensus outcome. First, it is the final opportunity to secure cheap 4-year funding, and second, the backdrop of rate ECB hike/exit expectations. This suggests to us that demand will be higher than consensus, and we are looking for an allocation of around EUR 150 billion. Clearly the bigger market impact will come from an above consensus outcome for TLTRO2 as this will increase the overall thrust of monetary stimulus and thus act as an added encouragement to exit what is currently an emergency policy setting.
We are likely to see the first stage of this exit plan in action at the June meeting when we expect the ECB to drop the reference to “or lower” on its rate guidance. It won’t be until after the September German election that we see phase two of the exit with a signal at the October meeting that QE will be tapered starting from the beginning of 2018.
We look for QE to be tapered at a rate of EUR 15 billion at every meeting. The risk is that QE will be tapered at a much slower pace and a rate hike will be delivered during this time.
Technical analysis
The EUR/USD remains above positively-aligned 7-day exponential moving average, which highlights the bullish structure. The EUR/USD has already tried twice to break above the 38.2% fibo of 1.1616-1.0340 move – in February and yesterday, but the resistance is still too strong. A close above this level would open the way to 1.0976, 50% fibo of that move.
On Wednesday, trading on the euro closed down and the British pound closed slightly up. There were some fluctuations in both directions on the pairs at 17:40 EET when an act of terrorism was committed in London. A car on Westminster bridge drove onto the pavement, hitting a number of pedestrians as it made its way to the parliament building. 5 people have been confirmed dead, including the assailant, who was shot by police, and another 40 were injured.
The pound slid to 1.2423 in the aftermath of the attack, while the EUR/GBP cross rose to 0.8700. On the back of euro purchases on the cross, the EUR/USD rate was able to renew the daily maximum at 1.0825. When the assailant was killed, the EUR/GBP cross fell, bringing the EUR/USD pair with it, which slid to 1.0790. The GBP/USD restored to 1.2490.
Market expectations:
The euro/dollar has returned to the balance line. At the time of writing, the euro is trading at 1.0793. On the hourly timeframe, the technical picture is bullish, so in the first half of the day, I’m expecting to see the price restore to around 1.0820.
At the beginning of the European session, the ECB bulletin could affect the dynamics of the currency pair.
At 15:45 EET, Janet Yellen is set to speak. It’s currently unclear whether or not she plans to aid the weakening dollar after raising interest rates. She usually strikes a neutral tone, giving markets little sign of what is to come.
After renewing the maximum on Wednesday, the EUR/USD rate returned to the balance line lb. Euro-bulls came under pressure from the EUR/GBP cross after the terrorist attack in London. The general technical picture on the hourly timeframe suggests a strengthening euro. My forecast goes up to 17:00 EET. I’ll make a forecast for the rest of the day this evening. The price failed yesterday to correct by 45 degrees. Today, the 45th degree is below the trend line. Although my forecast is expecting the price to restore to 1.0820, the 1.0777 level could be tested during the Asian session.
If the price doesn’t rebound upwards from 1.0777, there is a high probability of it moving towards the 1.0747 level (67th degree). Looking at the indicators on the daily and weekly timeframes, the situation is ambiguous. It will be a bad sign for buyers if the hour closes lower than 1.0780. Traders are unsure what can be used as a driving force behind price changes.
Positives for the euro (+):
Fundamental:
(+) US president Donald Trump favours a weaker dollar;
(+) The threshold for acceptable US government debt of 20.1 trillion USD may be reached by March this year. This will create headaches for new US president Donald Trump. A new law on the debt ceiling came into force on the 16th of March 2017;
(+) The Greek government has made some progress in its talks with international creditors on the second stage of their reform program;
(+) Head of the ECB, Mario Draghi, has hinted that the central bank may not need to provide any further stimulus to revitalise Europe’s economy. From April to December 2017, the ECB will reduce their monthly assets purchases to 80 to 60 billion EUR;
(+) ECB bosses have discussed the possibility of raising interest rates before the QE program comes to an end;
(+) Ewald Nowotny, a member of the ECB’s governing council, has said that the bank could raise the deposit rate before the main refinancing rate;
Technical (short-term):
(+) According to data from 14/03/17, small and large speculators on the Chicago Exchange have increased their long and short positions. Long positions have grown by 11,151 to 148,509 contracts, while short positions have grown by 8,909 to 187,216 contracts. Net short positions have fallen from 58,766 to 38,707 contracts. Small speculators have reduced their short positions by 11,095 to 58,313 contracts. Net long positions have risen by 3,158 contracts.
(+) Short/long ratio according to myfxbook as of 07:02 EET: 81%/18%, lots: 31371/7227 (previous day: 39575/6876), positions: 73834/28068 (previous day: 90115/21436);
(+) US 10-year bond yields: 2.410% (down 0.25% from 22/03/17);
(+) EURGBP (W): the CCI (20), AO, AC and the Stochastic (5,3,3) are moving upwards. The trend line has been broken through;
(+) EURUSD (M): the Stochastic (5,3,3) is moving upwards;
(+) EURUSD (W): The Stochastic (5,3,3), AO, AC, and CCI (20) are moving upwards;
(+) EURUSD (D): the AO and AC indicators are moving upwards;
Negatives for the euro (-):
Fundamental:
(-) According to CME Group’s FedWatch Tool on Wednesday the 22nd of March, the probability of a rate hike in May remains 6.4%. The probability in June has fallen from 54% to 49.6% and in July from 60.8% to 57.1%;
(-) Political uncertainty in Europe (French elections and Brexit);
(-) Fed member Evans is expecting 2-3 rate hikes in 2017. The Federal Reserve will make a decision about the next hike in June;
(-) President of the Philadelphia Fed, Harker, announced that the Federal Reserve will continue to gradually increase interest rates throughout 2017;
Technical factors (short-term):
(-) German 10-year bond yields: 0.407% (down 11.32% from 22/03/17);
(-) In Asia, US 10Y bond yields have risen by 0.53% to 2.409%;
(-) EURUSD (M): the AO and AC indicators are moving downwards;
(-) EURUSD (D): the Stochastic (5,3,3) and CCI (20) are moving downwards;
(-) EURGBP (D): the AO, AC, CCI (20), and Stochastic (5,3,3) indicators are moving downwards;
Built into the price:
(-) The Ex-Prime Minister of France, Alain Juppe, has ruled himself out of participating in the presidential election;
(+) François Bayrou, leader of the “Democratic Movement” party, has ruled out running for the presidency and thrown his weight behind independent candidate Emmanuel Macron;
(+) Marine Le Pen has had her EU parliamentary immunity from prosecution lifted for political reasons.
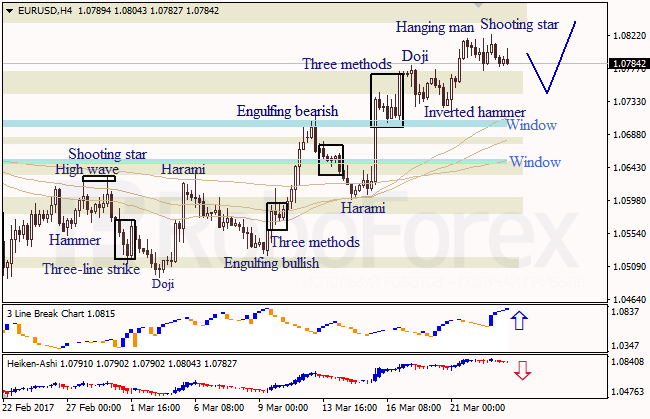
At the H4 chart of EUR USD, the sideways correction continues. Bearish Hanging Man and Shooting Star patterns indicate that the descending correction continues. Three Line Break chart shows a bullish direction; Heiken Ashi candlesticks confirm the descending correction.
At the H1 chart of EUR USD, Engulfing Bearish, Harami, and Tweezers patterns indicate that the descending correction continues. Three Line Break chart and Heiken Ashi candlesticks confirm a bearish direction.
USD JPY, “US Dollar vs. Japanese Yen”
At the H4 chart of USD JPY, Engulfing Bullish and Inverted Hammer patterns indicate an ascending correction. Three Line Break chart and Heiken Ashi candlesticks confirm a bearish direction; bearish Harami pattern shows a possible pullback to the downside.
Attention! Forecasts presented in this section only reflect the author’s private opinion and should not be considered as guidance for trading. RoboForex LP bears no responsibility for trading results based on trading recommendations described in these analytical reviews.
It’s been six months now that oil prices have been reacting to OPEC, first to the possibility of an agreement, and then to the production cut deal itself, forged by OPEC to rebalance the market. The deal–initially aired as ‘an agreement to agree on a deal’ in September and signed at the end of November—will likely impact the market for at least the next six months.
The agreement clearly states that it is production that OPEC producers are vowing to cut, but Iraqi oil minister Jabbar al-Luaibi has recently claimed—rather emphatically—that it is exports, not production, that serve as the baseline for the cuts. And according to Iraq, the agreed-upon cuts have been all about exports all along.
Of course, exports are the logical ‘by-product’ of production of oil exporting nations, but each of those producers feels the weight of production cuts differently. Each OPEC nation has a specific domestic demand for oil based on population numbers and the share of oil and petroleum products in the energy mix and electricity generation. Each member has unique buyers of their crude, along with differing agendas in keeping and/or growing market shares in various corners of the world.
To cut exports rather than production would hit hard the bottom lines of those who are heavy exporters, so it’s quite clear why an oil cartel whose self-proclaimed mission is to secure “a steady income to producers” chose to cut “production” instead of “exports” in its latest supply-cut agreement.
OPEC producers—especially Saudi Arabia, which shoulders the biggest share of cuts-are desperately trying to maintain their most important market shares such as those in Asia, while measuring exports bound for other destinations in its attempt to comply with the production cuts.
The cartel would have never used the language ‘exports’ in a deal to cut supply, because cutting their exports would mean they would hold a smaller market share. Having a smaller footprint globally would, in turn, mean that OPEC would wield less influence over the price of oil. It’s doubtful OPEC would ever agree to such an unappealing scenario.
But Iraq is uniquely positioned. First, Iraq must contend with the Kurds, as well as international companies, with which it has production agreements that come with penalties for breeching. For this reason, Iraq does not have as much control over production as, say, Saudi Arabia, who deals only with state-run oil. So using export figures rather than production figures may show that Iraq is complying at a higher rate, even though exports are not entirely under their control either. The mere perception of compliance, regardless of the validity, is important as far as the market is concerned.
Another reason why Iraq may prefer to cite exports is because exports are a bit trickier to nail down. There is always conflicting loading data and shipping schedules to contend with, and it’s hard to pinpoint precisely how much oil each OPEC nation has heading out the door.
Production, on the other hand, has concise figures (two figures each, we might add) published in OPEC’s Monthly Oil Market Report—one direct reported figure and one secondary source figure. Exports are even less transparent, especially for Iraq, who has export figures for both the north and the south.
Data compiled by Bloomberg showed that Iraq’s February exports of 3.85 million barrels per day were, in fact, 39,000 barrels per day higher than January levels, which doesn’t seem so compliant.
In October 2016, Iraq’s oil exports were estimated to be 3.89 million barrels per day. So even if the “reference basket” that OPEC used to craft the deal was based on exports, it doesn’t look like Iraq’s compliance is particularly noteworthy—it’s just more difficult to pin down exactly how noncompliant Iraq is.
So, for OPEC, it’s about production cuts, but beyond the wording of the agreement, it’s the message – we are the ones finally doing something to bring the huge oversupply back to balance. The fine print, of course, is – we wanted the price of oil higher and stable, so that we could plug the gaps in our oil-revenue-dependent budgets.
The market bought the ‘balance’ message, and oil prices steadied at above $50 for three months. The initial surprisingly high compliance at more than 90 percent, due to Saudi Arabia going the extra mile, instilled further confidence that OPEC was following through its promised cuts. Almost every cartel producer is boasting near full or overcompliance, and those who don’t comply, notably Iraq, are claiming the deal’s baseline is about exports.
The price gains from the OPEC deal have been capped by resurging U.S. shale output at the higher oil prices. But the recent drop in the price of oil wiped out almost all the price increase that the cartel’s deal has managed to achieve.
The message to OPEC was that it may have underestimated U.S. shale resilience once again, and the cartel’s previous plans for higher prices may prove ill-conceived.
OPEC’s playbook currently is 1) urging full compliance from all signatories to the deal, 2) using Saudis to signal they may be fed up with doing the extra heavy lifting for rogue members, and 3) talking prices up from time to time with messages that the supply-cut deal may need to be extended.
Last week, Saudi Energy Minister Khalid Al-Falih told Bloomberg Television that OPEC would extend the deal beyond June if stockpiles were “still above the five-year average.”
According to OPEC’s own estimates from earlier this month, OECD commercial oil stocks in January were 278 million barrels above the five-year average.
OPEC’s deal now is trying to send a unified message that the members are making every effort to rebalance the market, so it’s unlikely that OPEC will correct Iraq’s insistence that the deal was forged over export figures rather than production figures.
The cartel is a diverse group of nations with various bilateral, trilateral and bloc relations among them. OPEC members rarely act in full concert, and seldom keep production-cut pledges. Their game now is playing the market with the possible extension of the cuts beyond June, and they have time until May to try to talk prices up.
If the cartel doesn’t extend the deal, the glut may not clear soon, further depressing oil prices and straining the already stretched OPEC producers’ budgets. If they decide to extend the deal, they risk losing market share and part of their power to sway oil markets and prices.
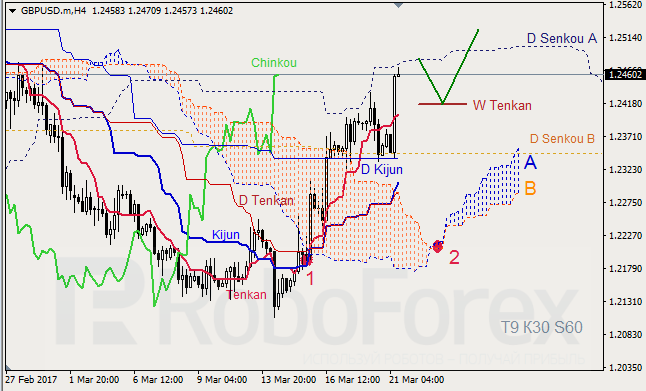
GBP USD, Time Frame H4. Indicator signals: Tenkan-Sen and Kijun-Sen are influenced by “Golden Cross” (1); all lines are directed upwards. Ichimoku Cloud is heading up (2); Chinkou Lagging Span is still above the chart. Short-term forecast: we can expect support from W Tenkan-Sen, and growth of the price.
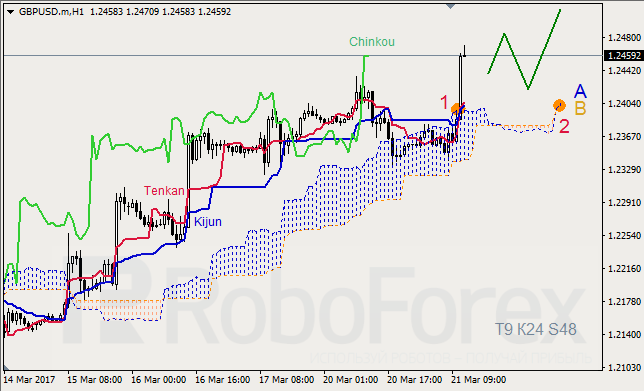
GBP USD, Time Frame H1. Indicator signals: Tenkan-Sen and Kijun-Sen ran into one another inside Kumo Cloud; all lines are directed upwards (1). Ichimoku Cloud is closed (2), Chinkou Lagging Span is above the chart, and the price is above the lines. Short-term forecast: we can expect support from Kijun-Sen, and growth of the price.
XAU USD, “Gold vs US Dollar”
XAU USD, Time Frame H4. Indicator signals: Tenkan-Sen and Kijun-Sen are still influenced by “Golden Cross” (1). Ichimoku Cloud is moving upwards (2), Chinkou Lagging Span is above the chart, and the price is on Tenkan-Sen. Short‑term forecast: we can expect resistance from W Kijun-Sen, and growth of the price.
Attention! Forecasts presented in this section only reflect the author’s private opinion and should not be considered as guidance for trading. RoboForex LP bears no responsibility for trading results based on trading recommendations described in these analytical reviews.
The EUR/USD pair is still moving upwards, which means that it may yet continue forming the wave 2. As we can see at the daily chart, earlier the price completed the descending impulse in the wave 1. To confirm a new decline, the market has to form the descending impulse in the wave 3 of (C).
At the H4 chart, the pair is forming the double zigzag in the wave 2. On a shorter timeframe, the price is forming the bullish impulse in the wave (c) of [y]. As a result, in the nearest future the market may continue moving upwards.
GBP USD, “Great Britain Pound vs US Dollar”
In case of the GBP/USD pair, the chart structure was changed. Possibly, the price is still forming the horizontal triangle in the wave (iv). During the next several days, the market may complete the wave e and test the pattern’s upside border.
More detailed structure is shown on the H1 chart. the wave e is taking the form of the zigzag. Consequently, on Tuesday the pair may continue forming the bullish impulse in the wave [C].
USD JPY, “US Dollar vs Japanese Yen”
In case of the USD/JPY pair, the current correction is taking the form of the double zigzag. Right now, the price is forming the descending zigzag in the wave [y] of 2. On a shorter timeframe, the market may form the wave (b), which may later be followed by a new descending movement.
As we can see at the H1 chart, the pair completed the bearish impulse in the wave (a). Consequently, in the nearest future the market may start forming the ascending correctional wave (b), which may take the form of the zigzag.
AUD USD, “Australian Dollar vs US Dollar”
The AUD/USD pair reached a new high again. The price probably formed the zigzag[e] of 4 inside the horizontal triangle. As a result, during the next several days the market may form the bearish impulse in the wave (i).
More detailed structure is shown on the H1 chart. It’s highly likely that the pair is about to complete the wave v of (c). Consequently, in the nearest future the market may resume moving downwards.
Attention! Forecasts presented in this section only reflect the author’s private opinion and should not be considered as guidance for trading. RoboForex LP bears no responsibility for trading results based on trading recommendations described in these analytical reviews.
The euro/dollar pair closed up on Tuesday. The single currency found some support from Le Pen’s lacklustre performance in the French presidential debate as well as from the British pound, which strengthened after the release of inflation figures in the UK.
During the European session, the EUR/USD pair shot past the daily resistance at 1.0790 on its way to 1.0819. From there, the pair entered a correctional phase.
Market expectations:
In Asia, the price has corrected to 1.0789. During this correctional phase, the hourly indicators offloaded. The resistance at 1.0789 became a support. A rebound from this level would be a bullish signal.
At the time of writing, the euro is trading at 1.0802. The economic calendar for Wednesday is relatively empty. Buyers currently have a market share of 85%, which is why today I’m expecting the euro to strengthen against the dollar to 1.0849. This growth may stop at 1.0835 (projection from the tops).
Day’s news (GMT+3):
12:00 Eurozone: current account (Jan);
16:00 USA: housing price index from Fannie Mae and Freddie Mac (Jan);
17:00 Switzerland: SNB quarterly bulletin;
17:00 USA: existing home sales (Feb);
17:30 USA: EIA crude oil stocks change (Mar 17);
22:45 Canada: Lawrence Schembri, deputy governor of the Bank of Canada, to speak;
Euro-bulls broke the resistance at 1.0790 on Tuesday. After a rebound from 1.0789, this turned into a support level for buyers. The reversal zone is located at the 112th degree. Cyclical analysis and patterns suggest that the euro will weaken over the next couple of days. Given that short positions on the euro make up 85% of the market, and that the Stochastic indicator is in the buy zone, I’m going to take a risk and say that the euro will strengthen against the dollar to 1.0849.
This year’s maximum of 1.0829 was reached in January. If buyers renew this maximum today, it will pave the way for weekly trend line to go up to 1.1021. The potential for growth will disappear if the hourly candlestick closes below 1.0782.
Positives for the euro (+):
Fundamental:
(+) US president Donald Trump favours a weaker dollar;
(+) The threshold for acceptable US government debt of 20.1 trillion USD may be reached by March this year. This will create headaches for new US president Donald Trump. A new law on the debt ceiling came into force on the 16th of March 2017;
(+) The Greek government has made some progress in its talks with international creditors on the second stage of their reform program;
(+) Head of the ECB, Mario Draghi, has hinted that the central bank may not need to provide any further stimulus to revitalise Europe’s economy. From April to December 2017, the ECB will reduce their monthly assets purchases to 80 to 60 billion EUR;
(+) ECB bosses have discussed the possibility of raising interest rates before the QE program comes to an end;
(+) Ewald Nowotny, a member of the ECB’s governing council, has said that the bank could raise the deposit rate before the main refinancing rate;
Technical (short-term):
(+) According to data from 14/03/17, small and large speculators on the Chicago Exchange have increased their long and short positions. Long positions have grown by 11,151 to 148,509 contracts, while short positions have grown by 8,909 to 187,216 contracts. Net short positions have fallen from 58,766 to 38,707 contracts. Small speculators have reduced their short positions by 11,095 to 58,313 contracts. Net long positions have risen by 3,158 contracts.
(+) Short/long ratio according to myfxbook as of 07:28 EET: 85%/14%, lots: 39575/6876 (previous day: 21726/7542), positions: 90115/21436 (previous day: 54996/21436);
(+) US 10-year bond yields: 2.464% (down 2.11% from 21/03/17). In Asia, bond yields have fallen by 0.68% to 2.417%;
(+) German 10-year bond yields: 0.459% (up 4.31% from 21/03/17);
(+) EURGBP (W): the CCI (20), AO, AC and the Stochastic (5,3,3) are moving upwards. The trend line has been broken through;
(+) EURUSD (M): the Stochastic (5,3,3) is moving upwards;
(+) EURUSD (W): The Stochastic (5,3,3), AO, AC, and CCI (20) are moving upwards;
(+) EURUSD (D): the AO indicator is moving upwards;
Negatives for the euro (-):
Fundamental:
(-) According to CME Group’s FedWatch Tool on Tuesday the 21st of March, the probability of a rate hike in May remains at 6.4%. The probability in June has fallen from 58.3% to 54% and in July from 64.5% to 60.8%;
(-) Political uncertainty in Europe (French elections and Brexit);
(-) Fed member Evans is expecting 2-3 rate hikes in 2017. The Federal Reserve will make a decision about the next hike in June;
(-) President of the Philadelphia Fed, Harker, announced that the Federal Reserve will continue to gradually increase interest rates throughout 2017;
Technical factors (short-term):
(-) EURUSD (M): the AO and AC indicators are moving downwards;
(-) EURUSD (D): the Stochastic (5,3,3) and CCI (20) are moving downwards;
(-) EURGBP (D): the AO, AC, CCI (20), and Stochastic (5,3,3) indicators are moving downwards;
Built into the price:
(-) The Ex-Prime Minister of France, Alain Juppe, has ruled himself out of participating in the presidential election;
(+) François Bayrou, leader of the “Democratic Movement” party, has ruled out running for the presidency and thrown his weight behind independent candidate Emmanuel Macron;
(+) Marine Le Pen has had her EU parliamentary immunity from prosecution lifted for political reasons.
After massive moves in Lithium (“Li”) juniors last year, will history repeat? Who knows, there will be big winners in 2017, but far fewer. Investors learned a lot about which stories have a chance and which likely don’t. For example, if one is invested in an Esmeralda County, Nevada (host of the Clayton Valley basin) Li play, it might be time to take a closer look. Why? The superpower in the area, Albemarle Corp., [NYSE: ALB] believes it has a senior claim on ALL water rights in the basin.
Water rights and/or lack of scale will be the downfall of dozens of hopefuls in western States. This is also true (for the same and other reasons) in many jurisdictions of Canada, Australia & Argentina (“ARG”). Investors looking for good ideas should pay particular attention to ARG. For some, that might mean development-stage companies like Lithium Americas [TSX: LAC]which owns 45.75% of a very strong project, Cauchari–Olaroz, (along with 45.75% partner SQM [NYSE: SQM]) in Jujuy Province. Or, ASX-listed Galaxy Resources [ASX: GXY], owner of the very promising Sal de Vida project on the western side of the Salardel Hombre Muerto.
Cheap valuation, world-class team, sizable Li brine option in Argentina
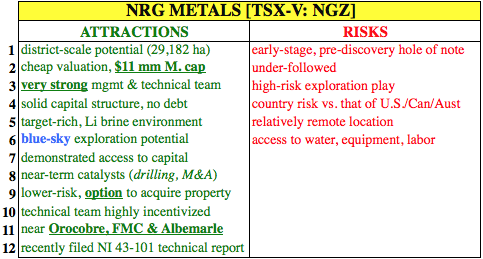
I’m looking for juniors with cheap valuations PLUS 1) strong management, 2) access to capital and 3) potential projects of scale. NRG Metals Inc. [TSX-V: NGZ] [OTC: GPOFF] stands out for its valuation (2nd lowest market cap of 15 ARG Li juniors I track) Note: {Valuation is more important than ever. Dozens of Li stocks are up hundreds or thousand(s) of percent, even after meaningful pullbacks from 52-week highs}. NRG has a world-class management / technical team, and has gained control (through a low-cost option) of nearly 30,000 ha in the SalardeCarachiPampa.
I asked the following questions of President, CEO & Director Adrian Hobkrik.
There are ~20 junior lithium companies with property or project interests in Argentina. Why should readers care about NRG Metals?
That’s a great question. Since there are many juniors competing for scarce resources, we strongly believe that controlling a basin will be critical. We have optioned 29,182 hectares (~72,100 acres) in the CarachiPampa basin (in the SalardeCatamarca), a position we consider district-scale. Size matters, but even more important, vitally important, is having a strong technical team including people with direct Li brine experience in South America. We’re funded through our upcoming drill program and believe our ability to raise capital is strong.
You spoke of the vital importance of management, how does your team compare to that of peers that have larger market caps?
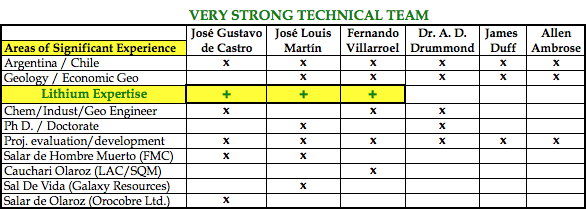
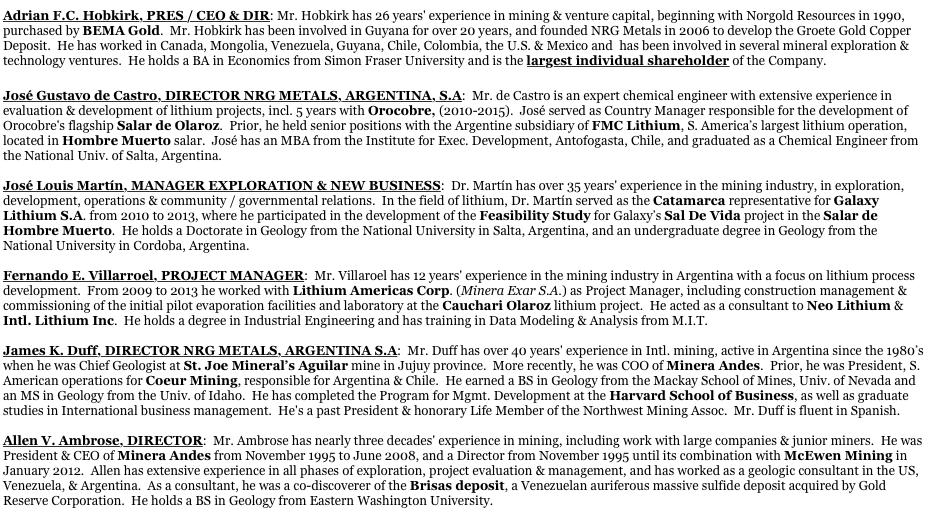
In a country like Argentina, boots on the ground is a pre-requisite for success. Six team members have mining experience in S. America, (4 fluent or native speaking, 3 with direct Li experience) offering a range of valuable skills. José Gustavo de Castro is a chemical engineer, an expert in evaluating and advancing of projects, including 5 years as Country Manager at producer Orocobre Ltd., responsible for the development of the SalardeOlaroz project. José also held senior positions with the Argentine subsidiary of FMCLithium [NYSE: FMC], operator of S. America’s largest lithium operation. Note: {Avg. market cap of 15 ARG-focused Li juniors = ~C$50 million, ~5x that of NRG’s C$ 9 million market cap 3/22/17}.
Fernando Villarroel has 12 years’ experience in the mining industry in Argentina focusing on lithium process development. From 2009 to 2013 he worked with Lithium Americas as Project Manager responsible for construction management & commissioning of the initial pilot evaporation facilities and lab at CauchariOlaroz. José Louis Martín is a Phd in Geology with 35 years’ experience. Dr. Martín served as the Catamarca representative for Galaxy Lithium from 2010 to 2013, and participated in the development of the Feasibility Study for Galaxy’s Sal De Vida. Note: {See more detailed bios below}
How did you find the Carachi property, and how were you able to quadruple NRG’s initial land position to 29,182 hectares (72,100 acres)?
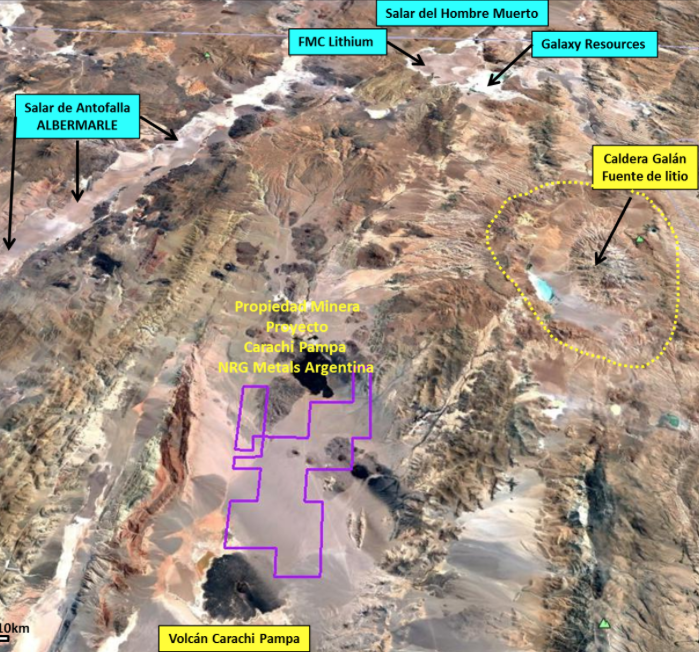
Initially we had 3,004 ha, (~7,420 acres), then we optioned an additional 3,383 ha (~8,360 acres) and announced the transaction. After a successful VES survey, which formed the basis of the NI 43-101 report (done by Novaldo Rojas, the QP for Milllennial Lithium (TSX-V: ML), we decided to go after a dominant position in the basin. So, we re-negotiated with five parties and came up with a deal requiring a cash payment of only US$173k, for an option on, as you said, 29,182 ha (~72,100 acres). No further payments are due unless we like upcoming drill results. We believe, consultants believe, salars in this area are related to the Galan Caldera. Given the depth of the basin, if we hit decent Li values without chemical issues, we could be off to the races.
Please explain why you think your CarachiPampa property is an attractive prospect.
Based on a recent geophysical survey, there’s a zone of very low resistivity / high conductivity that looks like it could be a zone of saturated brines. It begins at 70 m depth, dips to 300 m, is about 150 m thick, and is open at depth and in all directions. At low cost, we can drill a few holes and see what we find. Our technical team can explore multiple targets at once until we find project(s) we like. Access to capital is key, we’re in good shape on that front.
Might NRG be interested in other technology metals? In other provinces or other countries?
Our clear focus is on CarachiPampa. That said, we’re in discussions about Li brine properties/projects in nearby salars. Our in-house expertise allows us to review multiple prospects brought to our attention. We’re in no rush, CarachiPampa will keep us busy as we contemplate exercising that option. Regarding other metals, other countries, we would possibly look in Chile, but our skill set is geared towards Li brine deposits.
Management team bios
Conclusion
Readers be warned (or reminded), Li juniors are highly speculative, all of them. NRG Metals Inc. [TSX-V: NGZ] [OTC: GPOFF] is no different, but at least its valuation is much lower than that of (the average) Li junior with property/project(s) in Argentina. Less downside risk may be found in the shares of giant companies like Tianqi Lithium Industries [China-listed: 002466.SZ], JiangxiGanfeng Lithium [China-listed: 002460.SZ], FMC, Albemarle and SQM, or with development / producing companies like Galaxy, Lithium Americas and Orocobre Ltd. [ASX: ORE]. But, to have a possibility of out-sized returns, one has to accept incremental risk.
NRG has a very experienced Li team and is actively looking to diversity its portfolio with assets from neighboring salars. The Company prudently locked down dominant position of nearly 30,000 ha for under US$200k to take a shot at a potentially significant discovery. Make no mistake, this is an educated guess, not a sure thing. However, a technical team of this caliber would serve investors well by making as many low-cost educated guesses as they possibly can.
Disclosures: The content of this article is for illustrative and informational purposes only. Readers fully understand and agree that nothing contained herein, written by Peter Epstein of Epstein Research, [ER]including but not limited to, commentary, opinions, views, assumptions, reported facts, estimates, calculations, etc. is to be considered, in any way whatsoever, implicit or explicit investment advice. Further, nothing contained herein is a recommendation or solicitation to buy or sell any security. The content contained herein is not directed at any individual or group. Mr. Epstein and [ER] are not responsible, under any circumstances whatsoever, for investment actions taken by the reader. Mr. Epstein and [ER] have never been, and are not currently, a registered or licensed financial advisor or broker/dealer, investment advisor, stockbroker, trader, money manager, compliance or legal officer, and they do not perform market making activities. Mr. Epstein and [ER] are not directly employed by any company, group, organization, party or person. Shares of NRG Metals are highly speculative, not suitable for all investors. Readers understand and agree that investments in small cap stocks can result in a 100% loss of invested funds. It is assumed and agreed upon by readers that they consult with their own licensed or registered financial advisorsbefore making investment decisions.
At the time this article was posted, Peter Epstein owned shares in NRG Metalsand the Company was a sponsor of [ER]. Readers understand and agree that they must conduct their own research, above and beyond reading this article. While the author believes he’s diligent in screening out companies that are unattractive investment opportunities, he cannot guarantee that his efforts will (or have been) successful. Mr. Epstein & [ER] are not responsible for any perceived, or actual, errors including, but not limited to, commentary, opinions, views, assumptions, reported facts & financial calculations, or for the completeness of this article or future content. Mr. Epstein & [ER] are not expected or required to subsequently follow or cover events & news, or write about any particular company or topic. Mr. Epstein and [ER] are not experts in any company, industry sector or investment topic.