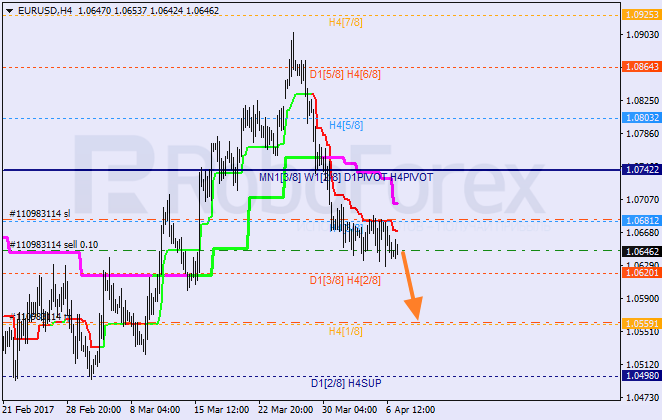
The EUR/USD pair is still consolidating below the H4 Super Trend. In addition to that, the price rebounded from the 5/8 level several times, which means that the pair may resume moving downwards to reach the 1/8 one.
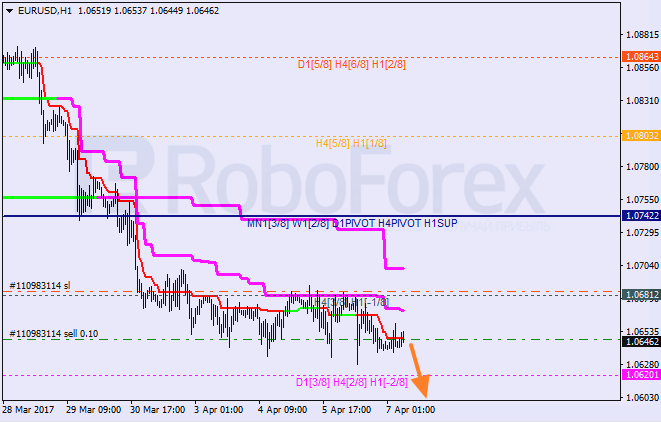
At the H1 chart, the -1/8 level provided resistance. Super Trends are still influenced by “bearish cross”. Later, the price is expected to break the -2/8 level, in this case, the lines at the chart will be redrawn.
USD CHF, “US Dollar vs Swiss Franc”
The USD/CHF pair is consolidating between the H4 Super Trend and the 5/8 level. In the nearest future, the price may start a new ascending movement. The closest target for bulls is at the 6/8 level.
At the H1 chart, the pair is consolidating between the 5/8 and 6/8 levels. If the price is able to stay above the 5/8level, later the market mat resume moving upwards to reach the 8/8 one.
Attention! Forecasts presented in this section only reflect the author’s private opinion and should not be considered as guidance for trading. RoboForex LP bears no responsibility for trading results based on trading recommendations described in these analytical reviews.
On Thursday, the EUR/USD closed down. The pair is still in a sideways trend, trading within a 50 pip range from 1.0630 to 1.0680. Movement is limited but very impulsive. Market volatility increases while statements from central bank representatives are being made.
On Thursday, Mario Draghi said in a statement that there is currently no need for a revision of the ECB’s monetary policy. In this, he expressed the bank’s readiness to continue with their quantitative easing program. Sellers tried to use Draghi’s speech to bring the price down below 1.0630 but were met with a large volume of buy orders. By the time markets had opened in the US, the price had restored to 1.0676. By the day’s close, the Euro had lost all its gains.
Market expectations
Since trading has got underway in Asia, the rate has risen to 1.0660 as the US dollar is falling across the board following a military attack by the US on Syria. Pentagon chief, James Mattis, reportedly presented president Trump with incontrovertible evidence of Bashar al Assad’s guilt in using chemical weapons, collected from social media. Let’s wait and see how other countries will react to the USA’s actions.
Trader attention today is going to be focused on the US jobs report for March as well as any news from the meeting between the USA’s and China’s presidents.
The market is likely to remain volatile throughout the day. We’re expecting the Euro exchange rate to leave the 1.0630 – 1.0680 range.
Day’s news (GMT+3):
09:00 Germany: industrial production (Feb), trade balance s.a. (Feb);
Over the last 4 trading days, a 50-pip wide corridor has formed. These are ideal conditions for range trading. The TC trend line is currently giving out a lot of false signals.
The trend line has yet to be broken. At the time of writing, the Euro is selling for 1.0648 USD. The price can be found in the lower half of the 1.0630 – 1.0680 channel. Today, traders will widen this range after the publication of NFP. Alternatively, the long-awaited exit from this range ay happen next week with the emergence of a new 200-300 pip impulse.
Positives for the euro (+):
Fundamental:
(+) Bundesbank president, Jens Weidmann, has stressed that the ECB needs to bring an end to its QE program earlier than planned;
(+) ECB bosses have discussed the possibility of raising interest rates before the QE program comes to an end;
(+) Head of the ECB, Mario Draghi, has hinted that the central bank may not need to provide any further stimulus to revitalise Europe’s economy. From April to December 2017, the ECB will reduce their monthly assets purchases from 80 to 60 billion EUR;
(+) On the 24th of March, Donald Trump withdrew his proposed healthcare bill to replace Obamacare from the US Congress’ agenda;
Technical (short-term):
(+) According to data from 28/03/17, large speculators on the Chicago Exchange have increased their long and decreased their short positions. Long positions have grown by 1,807 to 160,453 contracts, while short positions have fallen by 9,283 to 167,608 contracts. Net short positions have fallen from 18,245 to 7,155 contracts;
(+) German 10-year bond yields: 0.256% (up 1.02% from 06/04/17);
(+) In Asia, US 10Y bond yields have fallen by 1.31% to 2.312%;
(+) EURGBP (W): CCI (20), AO, AC – up;
(+)EURGBP (D): CCI (20), Stochastic (5,3,3), AC – up;
(-) Head of the ECB – revision of monetary policy not required for the moment;
(-) Eric Rosengren, president of the Boston Fed, argues that the central bank should raise interest rates every other session, meaning that he expects to see another 3 hikes this year;
(-) FOMC member Williams is envisaging another 2-3 rate hikes this year and isn’t ruling out the possibility of even more. The Fed could also start reducing its balance sheet this year, which is earlier than many economists had predicted;
(-) Dallas Fed president Kaplan has said 3 rate hikes in 2017 is his base case;
(-) FOMC member Mester says that the Fed needs to reduce the size of its balance sheet this year;
(-) St. Louis Fed president Bullard has said that the Federal Reserve needs to act quickly on normalising its balance sheet;
(-) According to CME Group’s FedWatch Tool, on Thursday the 6th of April, the probability of a rate hike in May remains 5.3%. The probability in June has risen from 66.6% to 70.9% and in July from 69.1% to 73.8%;
(-) Political risks in Europe (French elections);
Technical factors (short-term):
(-) Small speculators on the Chicago exchange have reduced their long positions by 1,095 to 64,185 contracts and increased shorts by 10 to 63,103 contracts. Net long positions have fallen from 2,187 to 1,082 contracts;
(-) Short/long ratio according to myfxbook as of 8:02 EET: 22%/77%, lots: 9256/32004 (previous day: 10084/28169), positions: 35806/64580 (previous day: 39422/53484);
(-) US 10-year bond yields: 2.346% (up 0.51% from 06/04/17);
(-) EURGBP (W): Stochastic (5,3,3), CCI (20) – down;
(-) EURGBP (D): AO – down;
(-) EURUSD (W): Stochastic (5,3,3) – down;
(-) EURUSD (D): AO, CCI (20) – down;
Built into the price:
(-) The Ex-Prime Minister of France, Alain Juppe, has ruled himself out of participating in the presidential election;
(-) Fed member Evans is expecting 2-3 rate hikes in 2017. The Federal Reserve will make a decision about the next hike in June;
(-) President of the Philadelphia Fed, Harker, announced that the Federal Reserve will continue to gradually increase interest rates throughout 2017;
(+) François Bayrou, leader of the “Democratic Movement” party, has ruled out running for the presidency and thrown his weight behind independent candidate Emmanuel Macron;
(+) Marine Le Pen has had her EU parliamentary immunity from prosecution lifted for political reasons;
(+) US president Donald Trump favours a weaker dollar;
(+) The threshold for acceptable US government debt of 20.1 trillion USD may be reached by March this year. This will create headaches for new US president Donald Trump;
(+) The Greek government has made some progress in its talks with international creditors on the second stage of their reform program;
(+) Ewald Nowotny, a member of the ECB’s governing council, has said that the bank could raise the deposit rate before the main refinancing rate;
(+) ECB member Lautenschläger warns that it’s time to prepare for a change in the bank’s policy.
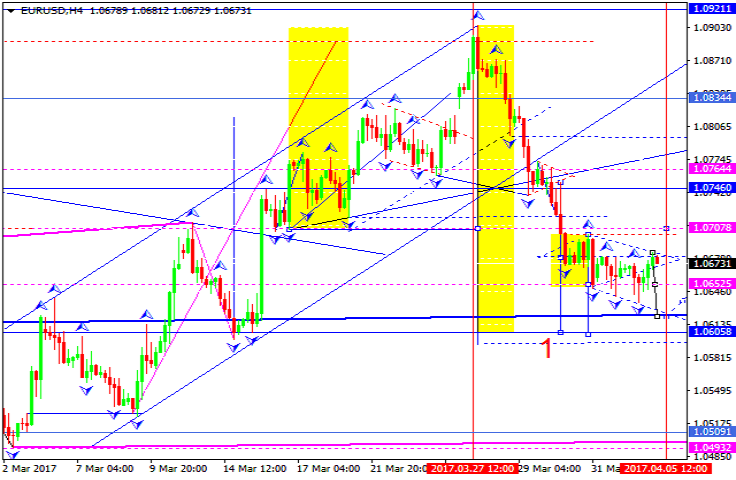
Being under pressure, the EUR/USD pair is moving downwards; it has rebounded from 1.0660 to the downside. Possibly, today the price may fall to reach 1.0624 and then grow to return to 1.0660. After that, the instrument may fall towards 1.0606.
GBP USD, “Great Britain Pound vs US Dollar”
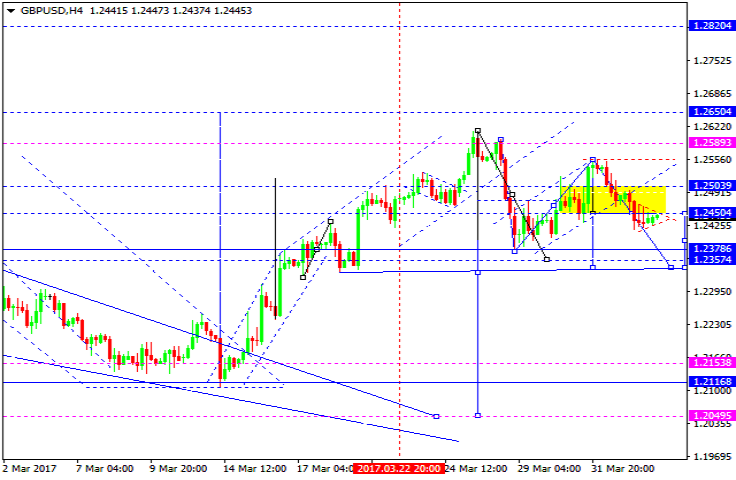
The GBP/USD pair has completed the correctional structure and broken the correctional channel to the downside. Possibly, today the price may fall and continue forming the fifth structure to reach 1.2357. Later, in our opinion, the market may start another growth with the target at 1.2483.
USD CHF, “US Dollar vs Swiss Franc”
The USD/CHF pair is trading to rebound from 1.0035 to the upside. Possibly, today the price may break the upside border of the range. The next target is at 1.0126.
USD JPY, “US Dollar vs Japanese Yen”
The USD/JPY pair is still moving downwards with the target at 109.78. Later, in our opinion, the market may grow towards 111.00.
AUD USD, “Australian Dollar vs US Dollar”
The AUD/USD pair has reached the target of the fifth descending structure. Possibly, today the price may consolidate at the lows. After breaking the channel of the fifth structure, the instrument may reach 0.7550.
USD RUB, “US Dollar vs Russian Ruble”
The USD/RUB pair is trading to rebound from the upside border of its consolidation range. Possibly, today the price may grow fall to reach 55.50 and then start growing towards 56.00.
XAU USD, “Gold vs US Dollar”
Gold has formed another ascending structure, the fifth one, towards 1263. Later, in our opinion, the market may be corrected to the downside to reach 1220. However, today the price is expected to fall inside the downtrend while forming the first wave with the target at 1250.
BRENT
Brent has completed another ascending structure. Possibly, today the price may fall towards 54.98 and then resume its growth to reach 57.50.
Attention! Forecasts presented in this section only reflect the author’s private opinion and should not be considered as guidance for trading. RoboForex LP bears no responsibility for trading results based on trading recommendations described in these analytical reviews.
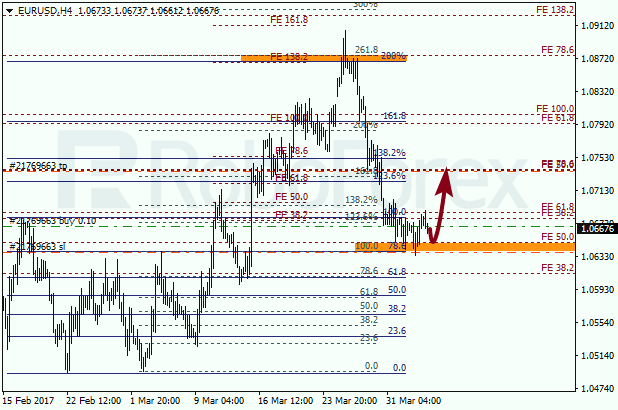
The EUR/USD pair rebounded from the group of local fibo-levels twice. On Wednesday, the local correction may take place, but later the price is expected to resume moving upwards to reach the area at 1.0735.
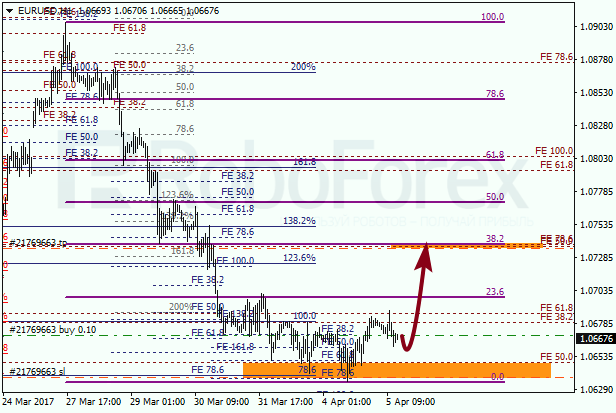
At the H1 chart, the main target of the current ascending correction is the retracement of 38.2%. If later the price breaks this level, the market may continue growing to reach the next group of fibo-levels.
EUR GBP, “Euro vs Great Britain Pound”
The EUR/GBP pair reached its local targets and started the current correction. In the nearest future, the market may resume moving upwards to reach the closest group of fibo-levels at 0.8640 – 0.8625.
At the H1 chart, the target of the local descending correction is the retracement of 61.8%. If later the pair rebounds from this level, the market may resume moving upwards and break the previous high.
Attention! Forecasts presented in this section only reflect the author’s private opinion and should not be considered as guidance for trading. RoboForex LP bears no responsibility for trading results based on trading recommendations described in these analytical reviews.
The single currency closed slightly down against the dollar on Wednesday. Now, on the daily timeframe, the 1.0630 price level is being protected by two hammers (imperfect). At first, strong PMI data from the UK brought the Euro down from its high of 1.0689, after which a further slide was triggered by the ADP report.
The private sector added 263,000 new jobs in March, providing the US dollar with some support. Still, no one paid attention to the fact that February’s figure was revised down by 53,000.
Currency markets underwent a surge in volatility after the FOMC’s minutes were published. the Euro reluctantly renewed the weekly minimum, from which it subsequently rebounded upwards by 49 pips to 1.0682. This recovery was facilitated by a fall in US bond yields from 2.382% to 2.326%.
The US central bank discussed reducing their balance sheet, which currently amounts to 4.5 trillion USD. The minutes also show that the FOMC supports gradually increasing interest rates.
US statistics:
The US ISM non-manufacturing index for March declined to 55.2 (forecast: 57.0, previous reading: 57.6)
The number of new private sector jobs added in March came to 263,000 (forecast: 187,000, previous figure revised from 298,000 to 245,000)
Market expectations:
A lot of speeches are planned for today. Of most interest to traders will be ECB president Mario Draghi’s but we shouldn’t expect a high level of volatility from it. He is generally cautious in his statements outside press conferences that follow ECB meetings. The market is bracing itself for the US labour market report for March. I’ve been expecting a breakthrough at 1.0680 for several days now. It’s possible that the price will hit 1.0710 before the non-farm payrolls.
Day’s news (GMY+3):
09:00 Germany: factory orders (Feb);
10:00 EU: ECB president Draghi’s speech;
10:15 Switzerland: CPI (Mar);
10:30 EU: ECB member Prat’s speech;
11:10 Eurozone: business activity index in retail trade (Mar);
Trading on the Euro on Wednesday closed slightly down. After the FOMC’s minutes were published, another reversal candle formed on the daily timeframe. the two hammers on the daily timeframe have formed a double base on the hourly.
The price has been in a sideways trend for the last 4 days. If the FOMC minutes couldn’t send the Euro below 1.0600, then it’s worth considering a breakthrough of the support zone from 1.0680 to 1.0700. I haven’t made a prediction as the price may stay here until Friday’s NFP report.
At the time of writing, the trend line has been broken though, which is a bullish signal. When trading get underway in Europe, the price could easily rise. Take a look at the Gann levels on the chart. The ellipses represent intermediate levels at which the price could meet some resistance: 1.0703, 1.0723 and 1.0744.
Positives for the euro (+):
Fundamental:
(+) Head of the ECB, Mario Draghi, has hinted that the central bank may not need to provide any further stimulus to revitalise Europe’s economy. From April to December 2017, the ECB will reduce their monthly assets purchases from 80 to 60 billion EUR;
(+) ECB bosses have discussed the possibility of raising interest rates before the QE program comes to an end;
(+) On the 24th of March, Donald Trump withdrew his proposed healthcare bill to replace Obamacare from the US Congress’ agenda;
Technical (short-term):
(+) According to data from 28/03/17, large speculators on the Chicago Exchange have increased their long and decreased their short positions. Long positions have grown by 1,807 to 160,453 contracts, while short positions have fallen by 9,283 to 167,608 contracts. Net short positions have fallen from 18,245 to 7,155 contracts;
(+) US 10-year bond yields: 2.334% (down 1.05% from 05/04/17);
(+) In Asia, US 10Y bond yields have fallen by 0.92% to 2.335%;
(+) EURGBP (W): the CCI (20), AO and AC are up;
(+)EURGBP (D): the CCI (20) and Stochastic (5,3,3) are up;
(+) EURUSD (M): the Stochastic (5,3,3), AO, AC and CCI (20) are up;
(+) EURUSD (W): The Stochastic (5,3,3), AO, AC, and CCI (20) are up;
(+) EURUSD (D): the Stochastic (5,3,3) and AC are up;
Negatives for the euro (-):
Fundamental:
(-) Eric Rosengren, president of the Boston Fed, argues that the central bank should raise interest rates every other session, meaning that he expects to see another 3 hikes this year;
(-) FOMC member Williams is envisaging another 2-3 rate hikes this year and isn’t ruling out the possibility of even more. The Fed could also start reducing its balance sheet this year, which is earlier than many economists had predicted;
(-) Dallas Fed president Kaplan has said 3 rate hikes in 2017 is his base case;
(-) FOMC member Mester says that the Fed needs to reduce the size of its balance sheet this year;
(-) St. Louis Fed president Bullard has said that the Federal Reserve needs to act quickly on normalising its balance sheet;
(-) According to CME Group’s FedWatch Tool, on Wednesday the 5th of April, the probability of a rate hike in May remains 5.3%. The probability in June has risen from 62.1% to 66.6% and in July from 66.8% to 69.1%;
(-) Political risks in Europe (French elections);
Technical factors (short-term):
(-) Small speculators on the Chicago exchange have reduced their long positions by 1,095 to 64,185 contracts and increased shorts by 10 to 63,103 contracts. Net long positions have fallen from 2,187 to 1,082 contracts;
(-) Short/long ratio according to myfxbook as of 7:49 EET: 26%/73%, lots: 10084/28169 (previous day: 10864/35963), positions: 39422/53484 (previous day: 40718/58683);
(-) German 10-year bond yields: 0.250% (down 5.66% from 05/04/17);
(-) EURGBP (M): the AC, AO, CCI (20) and Stochastic (5,3,3) indicators are down;
(-) EURGBP (W): The Stochastic (5,3,3) and CCI (20) are down;
(-) EURGBP (D): the AC and AO indicators are down;
(-) EURUSD (W): the Stochastic (5,3,3) is down;
(-) EURUSD (D): the AO and CCI (20) indicators are down;
Built into the price:
(-) The Ex-Prime Minister of France, Alain Juppe, has ruled himself out of participating in the presidential election;
(-) Fed member Evans is expecting 2-3 rate hikes in 2017. The Federal Reserve will make a decision about the next hike in June;
(-) President of the Philadelphia Fed, Harker, announced that the Federal Reserve will continue to gradually increase interest rates throughout 2017;
(+) François Bayrou, leader of the “Democratic Movement” party, has ruled out running for the presidency and thrown his weight behind independent candidate Emmanuel Macron;
(+) Marine Le Pen has had her EU parliamentary immunity from prosecution lifted for political reasons;
(+) US president Donald Trump favours a weaker dollar;
(+) The threshold for acceptable US government debt of 20.1 trillion USD may be reached by March this year. This will create headaches for new US president Donald Trump;
(+) The Greek government has made some progress in its talks with international creditors on the second stage of their reform program;
(+) Ewald Nowotny, a member of the ECB’s governing council, has said that the bank could raise the deposit rate before the main refinancing rate;
(+) ECB member Lautenschläger warns that it’s time to prepare for a change in the bank’s policy
The EUR/USD pair has reached new lows and returned to the center of the consolidation range. Possibly, today the price may fall to reach 1.0622 and then return to 1.0655. After that, the instrument may fall towards 1.0606 and then grow with the target at 1.0707.
GBP USD, “Great Britain Pound vs US Dollar”
The GBP/USD pair is trading around 1.2450. this structure may be considered as a downside continuation pattern with the target at 1.2357. Later, in our opinion, the market may grow towards 1.2500.
USD CHF, “US Dollar vs Swiss Franc”
The USD/CHF pair is trading without any particular direction; it has broken the descending channel and this structure may be considered as an upside continuation pattern with the target at 1.0200. Possibly, today the price may grow to reach 1.0065 and then test 1.0007 from above. After that, the instrument may grow to reach the target at 1.0200.
USD JPY, “US Dollar vs Japanese Yen”
The USD/JPY pair is trading below 111.00. Possibly, the price may fall to reach 109.78 and then grow towards 111.00, thus forming another consolidation range in the form of the Diamond pattern. If later the market breaks this range to the upside, the instrument may be corrected towards 115.00; if to the downside – continue falling inside the downtrend with the target at 106.50.
AUD USD, “Australian Dollar vs US Dollar”
The AUD/USD pair is forming the fifth descending wave with the target at 0.7583. Possibly, today the price may test 0.7576 from below and then continue falling to reach the above-mentioned target.
USD RUB, “US Dollar vs Russian Ruble”
The USD/RUB pair has formed another consolidation range. Possibly, the price may break it to the downside and continue falling towards 55.50. After that, the instrument may test 55.90 from below and then extend this wave to reach 54.50.
XAU USD, “Gold vs US Dollar”
Gold is being corrected to reach 1250. Later, in our opinion, the market may move according to an alternative scenario and extend this structure towards 1262. After that, the instrument may fall with the target at 1237.
BRENT
Brent is extending the ascending wave. Possibly, the price may reach 54.94; it is extending the third wave and may start a new correction towards 53.00 at any moment. Later, in our opinion, the market may grow to reach 55.20.
Attention! Forecasts presented in this section only reflect the author’s private opinion and should not be considered as guidance for trading. RoboForex LP bears no responsibility for trading results based on trading recommendations described in these analytical reviews.
An Excerpt from Chapter 1 of The Socionomic Theory of Finance
By Robert Prechter
Few people find a new theory accessible until they first see errors in the old way of thinking. Part I of this book challenges the universally accepted paradigm under which humans’ rational reactions to exogenous (external, or externally generated) causes purportedly account for financial market behavior. The current chapter explores whether dramatic news events affect financial markets.
Testing Financial-Market Reaction under Perfect Conditions
In the physical world of mechanics, action is followed by reaction. When a bat strikes a ball, the ball changes course.
Most financial analysts, economists, historians, sociologists and futurists believe that society works the same way. They typically say, “Because so-and-so has happened, it will cause such-and-such reaction.” This mechanics paradigm is ubiquitous in financial commentary. The news headlines in Figure 1 reflect what economists tell reporters: Good economic news makes the stock market go up; bad economic news makes it go down. But is it true?
Figure 1
In the second half of the 1990s, a popular book made a case for buying and holding stocks forever. In March 2004, after several terrorist attacks had occurred, the author told a reporter, “Clearly, the risk of terror is the major reason why the markets have come down. We can’t quantify these risks; it’s not like flipping a coin and knowing your odds are 50-50 that an attack won’t occur.”1
In other words, he accepts the mechanics paradigm of exogenous cause and effect with respect to the stock market but says he cannot predict a major cause part of the equation. The first question is, if one cannot predict causes, then how can one write a book predicting effects? A second question is far more important: Is there any evidence that dramatic news events that make headlines, including terrorist attacks, political events, wars, natural disasters and other crises, are causal to stock market movement?
Suppose the devil were to offer you historic news a day in advance, no strings attached. “What’s more,” he says, “you can hold a position in the stock market for as little as a single trading day after the event or as long as you like.” It sounds foolproof, so you accept.
His first offer: “The president will be assassinated tomorrow.” You can’t believe it. You are the only person in the world who knows it’s going to happen.
The devil transports you back to November 22, 1963. You quickly take a short position in the stock market in order to profit when prices fall on the bad news you know is coming. Do you make money?
This article was syndicated by Elliott Wave International and was originally published under the headline The Myth of Shocks. EWI is the world’s largest market forecasting firm. Its staff of full-time analysts led by Chartered Market Technician Robert Prechter provides 24-hour-a-day market analysis to institutional and private investors around the world.
On a global level, 2015 and 2016 marked the lowest level of new conventional oil discoveries since 1952. In 2016, only 3.7 billion barrels of conventional oil were discovered, roughly 45 days of global crude consumption or 0.2 percent of global proved reserves. Globally, exploratory drilling fell by almost 20 percent in 2015 and fell even further in 2016. Russia’s exploration activities, which were hit not only by plummeting oil prices but also by a targeted sanctions regime, suffered a double blow during this period. In 2015, only seven new hydrocarbon discoveries were made in Russia, three of them in the Baltic Sea. In 2016, oil and gas companies in Russia discovered 40 prospective fields, however, the 3P reserves of the largest among them, Rosneft’s Nertsetinskoye, amounted to 17.4 million tons. This stands in stark contrast with pre-sanction period achievements, for instance, 2014’s largest find, Pobeda, is believed to contain 130 million tons of oil and 0.5TCm of gas.
Graph 1. Russia’s Oil Production 1970-2020 and Russia’s Deep-Hole Oil & Gas Exploration Drilling.
Source: Russian Central Bank, IEA, Russian Statistics Agency.
It is only logical that against such depressive trends, that people start to question the sustainability of Russia’s current oil-producing renaissance (Graph 1). When will Russia run out of oil? Were Sheikh Yaki Zamani’s “Stone age” simile to materialize, would Russia still be among the top producers when oil started its descent towards obsolescence?
The Ministry of Natural Resources and Environmental Protection of Russia states that not accounting for new discoveries, current oil reserves in Russia stand at 29 billion tons and under current consumption rates would be depleted by 2044 (its 2P gas reserves’ depletion would come about in more than 160 years). To this end, it would like to implement business-easing measures, e.g.: facilitate the issuance of licenses and to increase the size of the allotted subsoil block to a maximum of 500 km2 (which would mean a fivefold increase compared to existing regulations). The Ministry’s stimulating measures, however, should not obfuscate the fact that Russia still has vast amounts of untapped reserves waiting to be discovered. But where?
Frontiers
The future of Russian crude lies in oil that is more expensive, more geologically complex and further away from traditional regions of production. Just as West Siberia replaced the Volga-Urals Region in the 1970s as the Soviet Union’s main producing region, East-Siberia and offshore regions will overtake West-Siberia (which saw its share in the national output diminish from 71 percent in 2004-2005 to 57 percent currently). This change of “leaders” is long overdue as West-Siberia oil output was already expected to plummet in the 1990s, yet thanks to extended oil recovery methods and slower-than-expected development of other oil-rich regions it has managed to keep stable output numbers. Russia’s oil sector has been consistently hoodwinked by analysts, who, beginning from the early 1980s predicted an imminent production slump. The production fall did happen, reaching a low-point between 1996 and 1999 when production foundered to 301-305 million tons per year. The cause was to be sought in Russia’s overall economic depression, not in its dearth of resources.
Today, Russian companies are similarly constrained in tackling Russia’s three new oil frontiers – shale, Arctic and deep-water. It is no coincidence that U.S. and EU sanctions targeted the sales of technologies related to these sectors and not conventional – whilst Russian companies are well-equipped to deal with conventional fields, they relied heavily on Western know-how. Yet it is very unlikely that even a tightening of sanctions could stall Russia’s Arctic exploration activities for a longer period of time. Russia’s continental shelf contains most of the Arctic’s oil formations and approximately 60 percent of its undiscovered reserves. So far, the 3P reserves of Russia’s Arctic stand at 585 million tons and 10.4 TCm, yet most of its Arctic Seas were only superficially appraised. The Kara Sea, whose fields are almost exclusively gaseous, has been in the spotlight since the 1983 of the Murmanskoye gas field (120 BCm), yet the northern parts of the adjacent Barents Sea, which Russia’s Federal Agency on Subsoil Usage deems the most likely to yield top hydrocarbon discoveries in the next few years, are relative newcomers in prospective surveys.
Western oil & gas companies should be aware that the Russian government treats Arctic formations as resources of “federal significance” and it is unlikely to provide them a role other than that of a minority shareholder. There is more maneuvering room for oil formations in the riskier part of the Arctic – the as of yet impossible-to-assess Laptev and Chukchi Seas, where no large-scale surveying has been done. Moreover, after the UN Commission on the Limits of the Continental Shelf acknowledged the Okhotsk Sea as a Russian enclave, the least-researched Russian sea can now be prospected and appraised. Still, the Russian Arctic, along with frontier zones like the Timano-Pechora Basin and the Yenisey-Khatanga Basin, will play an important role in keeping Russia among world’s top 3 oil producers in the next 40-50 years. Yet there is more, Russia’s oil future is not only more Arctic, but also more shale-related.Russia has been sitting on vast shale/tight oil reserves, which according to present data are second only to the United States. Yet it might easily surpass all its rivals, as the development of gigantic tight-oil formations, such as Bazhenov Suite, the largest shale deposit in the world covering a territory of more than 1 million km2 and assumed to contain at least 20 billion tons of oil, is still in its infant phase. The potential of the Abalak Suite underlying the Bazhenov, the Domanik Suite, stretching asymmetrically across the Volga-Urals Region from Perm to Orenburg, as well as many others, is still difficult to assess, yet virtually all of them are located in traditional oil-producing regions with a fully-established oil infrastructure. Although the first Bazhenov oil gush dates back to 1969, several factors have hindered the development of Russian tight oil, yet the principal among them was the availability of other, less-costly variants of production. The preference for easier-to-access, less costly formations is aptly reflected in Russia’s curbing of deep-hole exploration drilling (Graph 1).
As Russia’s tight oil needs at least an oil price level of 55-60 USD per barrel, bringing the first fields on-stream is still some way off as conventionals’ breakeven levels are in the 20-30 USD per barrel range. Despite a significant lag compared to the U.S. shale revolution, this might not be that unfavorable for Russia. It is expected that under the aegis of “import substitution”, Russian service companies might be fully up to the task to exploit Russia’s shale bounty by the 2020s, moreover, they are likely to work in an environment with significantly lower drilling costs, time and efficiency rates than their American counterparts in late 2000s (thus yielding more oil). By that time, perhaps, anti-Russian sanctions will be a yesteryear affair.
Lastly, one should not underestimate the tenacity of Russia’s conventional oil reserves, which thanks to enhanced oil recovery techniques and supplementary exploration will remain a force to be reckoned with. As demonstrated by the discovery of the Velikoye field in the Astrakhan Oblast (reserves estimated at 330 million tons of oil), Russia’s pre-salt layers, even in regions previously thought to be on the verge of depletion, might kickstart a new development vector in its energy matrix. As Russia’s Natural Resource Ministry cannot account for events that are still yet to happen, its 2044 depletion assumption reflects merely its inherent conservatism, not the country’s realistic capabilities. By all accounts, Russia will remain a major oil-producing nation throughout the entire XXIst century, with oil production moving to places that are further (north and east), deeper (both deepwater and pre-salt) and generally more costly.
One of the most attractive things about being a forex trader with Vantage FX is the range of different approaches and styles available to you. Discretionary traders rely on gut instinct to beat the market, systematic traders take trades based on a proven system and automated traders take systematic trading to its logical conclusion and deploy a robot to trade their system. With so many different approaches, there is bound to be one that is suitable for nearly everyone. In this piece we will discuss the pro’s and cons of each approach and also take a quick look at the hybrid, semi-automated approach which dominates the proprietary trading sector.
Discretionary Trading
Discretionary traders with Vantage FX are the cowboys of forex trading. Though they will generally use the same technical tools other traders do, at the end of the day, they take trades based on gut-instinct. Discretionary trading is tough – only a select few are capable of turning consistent profits with this approach. You need to have an edge to be successful discretionary trader: whether it’s in your genes, or a product of decades of experience; you have the ability to pick the market right more often than not.
Many new traders try their hand at discretionary trading and fail miserably. This approach is not at all suitable for beginners. On the other hand, experienced discretionary traders can be extremely profitable, as their trade frequency is not limited by the confines of a rigid systematic approach.
Systematic Trading
Not a discretionary trading god? Systematic trading with Vantage FX might be a better option. Unlike discretionary traders, systematic traders do not necessarily require a genetic edge; rather their edge comes from a proven trading system, and their ability to adhere to this system.
Where discretionary trading revolves around skill, systematic trading is all about discipline. If your system tells you to enter long, you enter long. If your system tells you to exit your trade, you exit. Often your system’s signals will go against your gut-instinct: you may not like the trade, but your ability to ignore your gut and adhere to your system will determine your success.
Automated Trading
Automated trading with Vantage FX takes the systematic approach to its logical conclusion. Even though systematic traders adhere to a strict set of rules, it is impossible to completely remove the human element from manual trading. Automated trading systems do exactly this.
An automated trading system always follows the rules, no exceptions. Automated systems don’t need to sleep – they can run 24/5. Automated trading systems are fast – they calculate trade size in fractions of a second and enter the market before you can say ‘there’s my signal’.
Though completely removing the human element from trading is the automated approach’s greatest strength, it is also arguably its greatest weakness. Once you begin testing and running automated systems, you realize discretion still plays a large part in profitable systematic trading. Many basic systems, for example an RSI 30 / 70 cross, are simply not profitable once discretion is removed from the equation.
The Hybrid Approach: Semi-Automated Trading at Vantage FX
The vast majority of proprietary trading firms employ a semi-automated approach. In general, most firms require your position sizing and risk management processes to be completely automated. It is extremely hard to acquire funding for an entirely discretionary approach – you will need an even more extensive track record than usual. Semi-automated trading allows you to capitalize on the benefits of the various approaches, whilst minimizing or eliminating the drawbacks.
If you do have edge when it comes to picking trades, but you are not so good at restricting your risk, managing a trade once it is open, or taking profit at the appropriate time; you should seriously consider a semi-automated approach. You can design or commission a robot that takes a trade on your cue, but sizes your position automatically, places your stop loss and take profit levels automatically and manages your open trades using advanced trailing stops.
Semi-automated trading is arguably the best approach to trading: this approach automates all secondary processes, allowing the discretionary or systematic trader to focus on executing high probability trades.
The EUR/USD pair has reached new lows and returned to the center of the consolidation range. Possibly, today the price may fall to reach 1.0622 and then return to 1.0655. After that, the instrument may fall towards 1.0606 and then grow with the target at 1.0707.
GBP USD, “Great Britain Pound vs US Dollar”
The GBP/USD pair is trading around 1.2450. this structure may be considered as a downside continuation pattern with the target at 1.2357. Later, in our opinion, the market may grow towards 1.2500.
USD CHF, “US Dollar vs Swiss Franc”
The USD/CHF pair is trading without any particular direction; it has broken the descending channel and this structure may be considered as an upside continuation pattern with the target at 1.0200. Possibly, today the price may grow to reach 1.0065 and then test 1.0007 from above. After that, the instrument may grow to reach the target at 1.0200.
USD JPY, “US Dollar vs Japanese Yen”
The USD/JPY pair is trading below 111.00. Possibly, the price may fall to reach 109.78 and then grow towards 111.00, thus forming another consolidation range in the form of the Diamond pattern. If later the market breaks this range to the upside, the instrument may be corrected towards 115.00; if to the downside – continue falling inside the downtrend with the target at 106.50.
AUD USD, “Australian Dollar vs US Dollar”
The AUD/USD pair is forming the fifth descending wave with the target at 0.7583. Possibly, today the price may test 0.7576 from below and then continue falling to reach the above-mentioned target.
USD RUB, “US Dollar vs Russian Ruble”
The USD/RUB pair has formed another consolidation range. Possibly, the price may break it to the downside and continue falling towards 55.50. After that, the instrument may test 55.90 from below and then extend this wave to reach 54.50.
XAU USD, “Gold vs US Dollar”
Gold is being corrected to reach 1250. Later, in our opinion, the market may move according to an alternative scenario and extend this structure towards 1262. After that, the instrument may fall with the target at 1237.
BRENT
Brent is extending the ascending wave. Possibly, the price may reach 54.94; it is extending the third wave and may start a new correction towards 53.00 at any moment. Later, in our opinion, the market may grow to reach 55.20.
Attention! Forecasts presented in this section only reflect the author’s private opinion and should not be considered as guidance for trading. RoboForex LP bears no responsibility for trading results based on trading recommendations described in these analytical reviews.