Author Archive for InvestMacro – Page 570

The Trump-Xi Summit Paves the Way to New Realism in US-Chinese Trade

By Dan Steinbock

Despite preliminary pessimism, the Trump-Xi Summit showed greater trade pragmatism than initially expected, even though it was overshadowed by a raw display of US military power.

President Donald Trump says he developed a “friendship” with President Xi Jinping at Mar-a-Lago. However, U.S. missile attacks against Bashar al-Assad’s forces in Syria overshadowed the meeting. Apparently, the White House hoped to kill two birds with one stone: to show to al-Assad who was in control and to Xi what might happen to North Korea if China would not intervene more decisively.

In the process, geopolitics cast a shadow over the meeting’s economic agenda, which had evolved after December when State Councilor Yang Jiechi visited Trump Tower and spoke about Chinese core interests. A day later, Trump talked on the phone with Taiwanese President Tsai Ing-wen and suggested that decades-old one-China policy could be used as a bargaining chip.

After a bilateral rhetoric tit-for-tat, Washington and Beijing began efforts to reduce tensions and a complementary channel was opened by China’s US ambassador Cui Tiankai with Jared Kushner, Trump’s son-in-law and trusted senior adviser. In February, these efforts led to Trump’s re-affirmation of the one-China policy and in March Secretary of State Rex Tillerson’s Beijing visit where he described the basis for US-China ties as “non-conflict, non-confrontation, mutual respect, and win-win cooperation.” While Democratic and Republican critics saw it as a sign of appeasement, optimists saw it a new a bilateral opening.

The stakes are huge. Starting with Deng Xiaoping’s economic reforms, US-China merchandise trade has grown from $2 billion in 1979 to $579 billion in 2016. Today, China is the US’s second-largest merchandise trading partner, third-largest export market, and biggest source of imports.

White House divided

During the campaign, Trump threatened to use 35-45% import tariffs against those nations that have a significant trade surplus with the US. In the White House, his team has floated 10% tariffs. To signal determination, Trump’s trade warriors – the head of the National Trade Council Peter Navarro, US Trade Representative Robert Lighthizer, trade advisor CEO Dan DiMicco and Secretary of Commerce Wilbur Ross – have singled out nations that have large trade surplus with the US. In 2016, the deficit list was topped by China ($347 billion), Japan ($69 billion), Germany ($65 billion), Mexico ($63 billion), and Canada ($11 billion).

In substance, Trump’s bilateral deficit obsession is a relic from the mercantilist era. Historically, US trade deficits began in the 1970s, not with China’s rise in the 2000s. Moreover, these deficits are multilateral, not bilateral. They have prevailed more than four decades with Asia; first with Japan, then with the newly-industrialized Asian tigers and more recently with China and emerging Asia. However, since Trump won the presidency with his mercantilist rhetoric, he needs perceived deficit concessions.

At Mar-a-Lago, besides the Trump-Xi talks, U.S. cabinet officials held meetings with their Chinese counterparts. Led by the Treasury Secretary Steve Mnuchin, the economic teams had a breakfast meeting on Friday, while a trade meeting included Commerce Secretary Wilbur Ross and Director of the National Economic Council Gary Cohn. It was a Goldman Sachs play. Cohn is the investment bank’s former president; Mnuchin, its former hedge fund manager. The two support a tough but more cooperative approach with China.

It is a not-so-secret-secret that the White House’s advisers have been split by internal battles between those Trump advisers (Navarro, DiMicco), who advocate aggressive measures to challenge China on trade, and their opponents (Mnuchin, Cohn), who prefer a moderate tone. While sympathetic to the trade hawks, Ross leans onto the moderates. Like Trump, they know only too well that short-term wins in trade battles could easily be undermined by long-term friction in bilateral relations that could hurt vital US fiscal, monetary, defense and security interests.

Toward bilateral investment treaty

By 2015, barely 1% of the stock of US FDI abroad was in China. But things are changing. After US investment in China peaked at more than $20 billion in 2008, it has stayed around $12-$15 billion annually. In the same time period, China’s investment in the US soared from a few hundred million dollars to $15 billion in 2015, tripling to $45 billion in 2016.

Since 2008, Washington and Beijing have been in talks about a bilateral investment treaty (BIT) to expand investment opportunities in the two countries. While the original goal was to complete an agreement by the end of President Obama’s second term, the latter’s geopolitical plays undermined the investment objective.

Somewhat like China’s membership in the World Trade Organization (WTO) in 2001, China’s pursuit of a BIT with the US offers domestic gains as well. It could accelerate structural economic reforms in the mainland and is very much in line with President Xi’s medium-term goals and the rebalancing of the Chinese economy.

One possible bilateral scenario that has been discussed involves Chinese investment in US infrastructure, including bridges, roads and airports. Beijing is interested in such prospects, but the Trump administration would still have to reconcile suchideas with its “Buy America” doctrines.

While the BIT would certainly facilitate investments in the two nations, it would support Trump’s infrastructure initiatives. Nevertheless, the Trump administration would have to portray it as a trade pact that would not result in US jobs being offshored to China.

Toward a compromise trajectory

Before the Summit, the White House hoped President Xi would in some way address Trump’s concerns about the US trade deficit with China. For instance, Beijing has pledged to reduce overcapacity in steel, but the central government has not yet engaged in broad plant closures. Instead, local governments, which depend on factories for taxes and employment, still maintain substantial production levels.

If these issues were addressed behind closed doors, the Chinese negotiators may have reassured the Trump advisers that broad-scale plant closures are in the agenda but that likely to ensue only after the Chinese politburo summit in the fall.

Tough economic reforms require political consensus in both China and the US.

Like the Reagan administration did with Japan in the 1980s, the Trump administration may also have hoped for a deal in which China would “voluntarily” agree to limit production and exports to carry out its pledges about overcapacity and to ease trade tensions. However, China is neither Japan nor dependent on the US alliance system in Asia Pacific, as Japan is. Moreover, US-Chinese trade involves much more than autos and consumer electronics. Consequently, incentives for voluntary restraints are marginal.

After the two-day summit at Mar-a-Lago, the US and China announced a 100-day plan to improve strained trade ties and boost cooperation between two nations. Trump negotiators characterized the first Trump-Xi Summit with references to “positive” chemistry.

Reportedly, China will offer better market access for U.S. financial sector investments, while ending the ban on U.S. beef imports that has been in place almost 15 years. While Washington would like Beijing to lower the 25% tariff on automotive imports, Beijing would like Washington to relax restrictions on advanced technology sales to China. Meanwhile, the Trump administration is preparing an executive order that would probe dumping from foreign companies and could result in tariffs, while steel and aluminum will be targeted.

While such concessions represent relatively modest progress in bilateral relations, Commerce Secretary Ross believes both sides agreed to speed up trade talks to recalibrate their bilateral imbalance: “This may be ambitious, but it’s a big sea change in the pace of discussions.”

Dialogue matters

Before the Trump-Xi Summit, some felt it was premature and could undermine recent progress in bilateral relations. Others saw the meeting as a window of opportunity that should not be missed – as happened in 2013 in Sunnylands, California, when Obama rejected Xi’s offer of “new type of major power relations.”

The simple reality is that, without efforts at stabilization in the US-Sino relationship, aggressive bilateral rhetoric could derail more than four decades of bilateral normalization. As Xi said at Mar-a-Lago: “There are a thousand reasons to make the Sino-US relationship work, and no reason to break it.”

That’s where the Trump-Xi Summit did succeed – it paved a way for a sustained dialogue and potential compromise trajectories, despite differences.

About the Author:

Dr Steinbock is the founder of Difference Group and has served as research director at the India, China and America Institute (USA) and visiting fellow at the Shanghai Institutes for International Studies (China) and the EU Center (Singapore). For more, see http://www.differencegroup.net/ 

The original version was published by China-US Focus on April 11, 2017.


GBPUSD: Long for 1.2500

By GrowthAces.com

GBP/USD supported by Britain’s inflation data

Macroeconomic overview: Fed Chair Janet Yellen said the Federal Reserve’s plans to raise U.S. interest rates gradually are aimed at sustaining full employment and near-2% inflation without letting the economy overheat.

Unemployment, at 4.5%, is now a little bit below the jobless rate that most Fed officials think signals full employment, and inflation is “reasonably close” to the Fed’s 2% goal, she said. With the economy expected to continue to grow at a moderate pace, she said, the Fed is now shifting its focus. “Whereas before we had our foot pressed down on the gas pedal trying to give the economy all the oomph we possibly could, now allowing the economy to kind of coast and remain on an even keel – to give it some gas but not so much that we are pressing down hard on the accelerator – that’s a better stance of monetary policy,” she said. “We want to be ahead of the curve and not behind it.”

Yellen’s comments largely echoed what she has said since then, and did not offer any new color on the timing of the rate hikes, or of the Fed’s eventual reduction of its USD 4.5 trillion balance sheet.

British inflation held steady in March due to the later timing of this year’s Easter holidays which pushed down airfares, and a dip in global oil prices, but the squeeze on households looks set to resume soon.

Consumer prices increased in March by 2.3% compared with a year earlier, the Office for National Statistics said on Tuesday, in line with market forecasts. Excluding oil prices and other volatile components such as food, core consumer price inflation slowed to 1.8%.

Inflation has accelerated in Britain in recent months, pushed up by a weakening of the pound since last year’s decision by voters to leave the European Union, and by the rise in oil prices which has fuelled inflation in other countries too.

With wages growing at the same rate or slightly slower than prices in the shops, many households are facing the prospect of a renewed squeeze on their incomes after a respite when inflation dipped to zero in 2015 and remained low last year.

In the latest sign of how consumers are reacting to rising inflation and slowing wage growth, total sales inched up by just 0.1% in the January-March period compared with the same three months of last year, the British Retail Consortium said. That was the weakest growth since the three months to December 2008, the BRC said.

Bank of England Governor Mark Carney said on Friday he would keep a close eye on fading consumer demand as he and his fellow policymakers consider whether they should raise interest rates to protect the economy against inflation. Most Bank of England policymakers have signalled they see no urgency to raise interest rates, even as they predict inflation will peak at 2.8% in around a year’s time. In our opinion inflation will exceed 3.0%.

Producer prices rose by 3.6%, a touch weaker than in February but above a forecast of 3.3%. Separately, the Office for National Statistics said house prices rose by an annual 5.8% in February, picking up speed from January. But house prices in London rose at their slowest pace in nearly five years, increasing by 3.7%.

The GBP/USD rose after UK inflation data release, but the reaction was short-lived.

Technical analysis: The GBP/USD remains below 14-day exponential moving average, which highlights the short-term bearish structure. The nearest target for currency bears is 1.2361 (50% fibo of March rise). This is a very important support and a close below this level could open the way to stronger drop. On the other hand, a close above 14-day ema may suggest a recovery.

EURUSD Daily Forex Signals Chart

Short-term signal: Long at 1.2430 for 1.2500.

Long-term outlook: Neutral


EUR/USD: We have opened a long position at 1.0615 after closing our short with a small loss.

EUR/CAD: Profit taken at 1.4145, earlier than initially assumed.


TRADING STRATEGIES SUMMARY:

FOREX – MAJOR PAIRS:

Please enable images to upload to view this email properly

FOREX – MAJOR CROSSES:

Please enable images to upload to view this email properly

PRECIOUS METALS:

Please enable images to upload to view this email properly

How to read these tables?

1. Support/Resistance – three closest important support/resistance levels
2. Position/Trading Idea:
BUY/SELL – It means we are looking to open LONG/SHORT position at the Entry Price. If the order is filled we will set the suggested Target and Stop-loss level.
LONG/SHORT – It means we have already taken this position at the Entry Price and expect the rate to go up/down to the Target level.
3. Stop-Loss/Profit Locked In – Sometimes we move the stop-loss level above (in case of LONG) or below (in case of SHORT) the Entry price. This means that we have locked in profit on this position.
4. Risk Factor – green “*” means high level of confidence (low level of uncertainty), grey “**” means medium level of confidence, red “***” means low level of confidence (high level of uncertainty)
5. Position Size (forex)– position size suggested for a USD 10,000 trading account in mini lots. You can calculate your position size as follows: (your account size in USD / USD 10,000) * (our position size). You should always round the result down. For example, if the result was 2.671, your position size should be 2 mini lots. This would be a great tool for your risk management!
Position size (precious metals) – position size suggested for a USD 10,000 trading account in units. You can calculate your position size as follows: (your account size in USD / USD 10,000) * (our position size).
6. Profit/Loss on recently closed position (forex) – is the amount of pips we have earned/lost on recently closed position. The amount in USD is calculated on the assumption of suggested position size for USD 10,000 trading account.
Profit/Loss on recently closed position (precious metals) – is profit/loss we have earned/lost per unit on recently closed position. The amount in USD is calculated on the assumption of suggested position size for USD 10,000 trading account.
About the Author:

By GrowthAces.com – Daily Forex Trading Strategies


Murrey Math Lines 11.04.2017 (EUR/USD, USD/CHF)

Article By RoboForex.com

EUR USD, “Euro vs US Dollar”

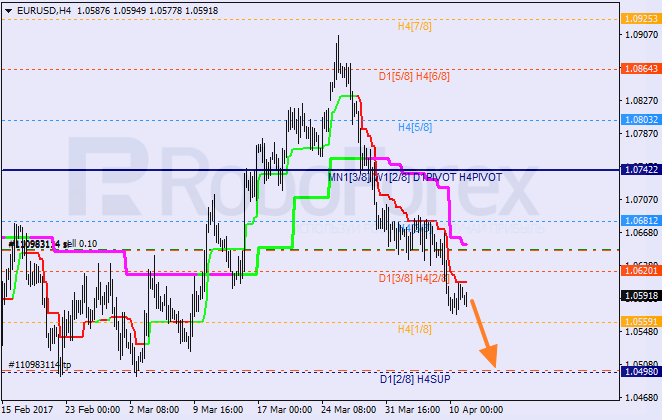
The EUR/USD pair is consolidating above the H4 Super Trend. Earlier, the price failed to fix above the 6/8 level and started the current decline. The closest target for bears is at the 0/8 level. After reaching this level, the market may start an ascending correction.

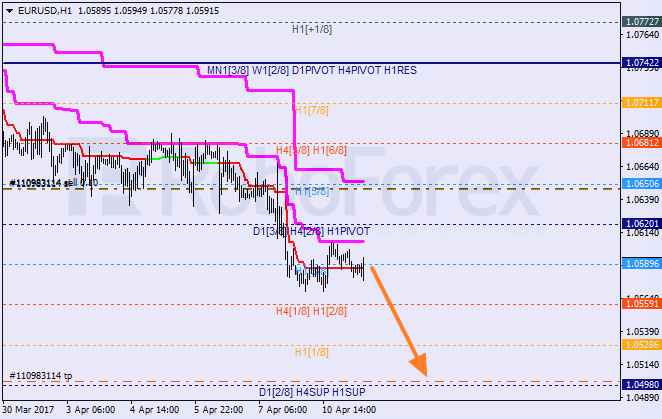
At the H1 chart, the pair is consolidating at the 3/8 level. If the price is able to stay under this level, the market may resume falling and reach the 0/8 one.


USD CHF, “US Dollar vs Swiss Franc”

The USD/CHF pair is testing the 5/8 level and the H4 Super Trend. If the price rebounds from these levels, the market may start a new decline to reach the 7/8 one.

At the H1 chart, the pair is trading at the 6/8 level. If the price rebounds from this level, the market may resume moving upwards. In this case, the closest target for bulls will be at the +2/8 level. After this level is broken, the lines at the chart will be redrawn.


RoboForex Analytical Department

Article By RoboForex.com

Attention!
Forecasts presented in this section only reflect the author’s private opinion and should not be considered as guidance for trading. RoboForex LP bears no responsibility for trading results based on trading recommendations described in these analytical reviews.

Forex Technical Analysis & Forecast 11.04.2017 (EUR/USD, GBP/USD, USD/CHF, USD/JPY, AUD/USD, USD/RUB, GOLD, BRENT)

Article By RoboForex.com

EUR USD, “Euro vs US Dollar”

The EUR/USD pair is consolidating at its lows. Possibly, today the price may reach 1.0608 and then fall towards 1.0585. If later the pair breaks this range to the upside, the market may be corrected with the target at 1.0707; if to the downside – reach 1.0525.


GBP USD, “Great Britain Pound vs US Dollar”

The GBP/USD pair has returned and tested the broken consolidation range from below. Possibly, the price may continue falling to reach the target at 1.2357. Later, in our opinion, the market may start another correction towards 1.2486.


USD CHF, “US Dollar vs Swiss Franc”

The USD/CHF pair has tested the broken consolidation range from above. Possibly, today the price may continue growing with the target at 1.0130. Later, in our opinion, the market may form another consolidation range. After breaking this range to the upside, the market may move to reach the next target at 1.0211.


USD JPY, “US Dollar vs Japanese Yen”

The USD/JPY pair is still consolidating in the center of the range; it has almost formed the Expanding Triangle pattern. Possibly, today the price may reach a new low at 110.00 and then move upwards to reach 110.80. After that, the instrument may fall with the target at 109.78.


AUD USD, “Australian Dollar vs US Dollar”

The AUD/USD pair has completed the first ascending impulse along with the correction. After breaking this impulse to the upside, the market may grow to test 0.7541 from below and then fall towards 0.7504. If later the price breaks its consolidation range to the upside, the instrument may be corrected to reach 0.7600; if to the downside – fall with the target at 0.7460.


USD RUB, “US Dollar vs Russian Ruble”

The USD/RUB pair has completed the ascending wave. Possibly, today the price may fall to reach 56.25. according to the main scenario, the instrument is expected to continue forming the wave with the target at 55.50.


XAU USD, “Gold vs US Dollar”

Being under pressure, Gold is moving upwards. Possibly, the price may be corrected towards 1261. Later, in our opinion, the market may start falling to break its lows. The local target is at 1239.


BRENT

Brent has completed another ascending structure to break the top. Possibly, today the price may form another consolidation range around 56.15. After breaking this range to the upside, the market is expected to resume its growth towards 57.70.


RoboForex Analytical Department

Article By RoboForex.com

Attention!
Forecasts presented in this section only reflect the author’s private opinion and should not be considered as guidance for trading. RoboForex LP bears no responsibility for trading results based on trading recommendations described in these analytical reviews.

EUR/USD: Euro remains under pressure from cross

By Gabriel Ojimadu, Alpari

Previous:

Trading on the Euro on Monday closed slightly up. The price corrected from 1.0570 to 1.0607. The economic calendar was bare, so market activity remained low. The price spent most of its time in a sideways trend.

A speech from the head of the US Federal Reserve, Janet Yellen, did nothing to surprise markets and thus had no effect on the dollar. She repeated that the US economy is in good shape and that the goal of gradually increasing interest rates is to maintain full employment and keep inflation around the 2% mark without overheating the economy. She made no mention of reducing the Fed’s 4.5 trillion dollar balance sheet.

Market expectations:

Monday’s session closed with the price on the trend line at 1.0595, meaning that the break wasn’t confirmed. This also makes the situation for Tuesday ambiguous as the British pound is showing some positive dynamics against the US dollar.

It’s now important for the euro-bulls whether or not the EUR/GBP cross will rise above 0.8530 level. If it does, the Euro will strengthen across the board.

For Tuesday, I’m expecting the EUR/USD pair to continue its flat. If the EUR/GBP cross manages to develop a bullish impulse, we can expect our pair to surpass 1.0621 as the greenback falls against most major currencies. The highest volume seen during yesterday’s trading occurred at 1.0618. We need to surpass this level in order to discourage the bears from selling.

Don’t forget that we have a long weekend ahead of us. Due to Easter celebrations, European exchanges will be closed from Friday to Tuesday (see our holiday calendar).

Day’s news (GMT+3):

  • 11:30 UK: CPI (Mar), retail price index (Mar), PPI input/output (Mar), DCLG house price index (Mar);
  • 12:00 Germany: ZEW survey – economic sentiment (Apr);
  • 12:00 Eurozone: industrial production (Feb), ZEW survey – economic sentiment (Apr);
  • 13:00 USA: NFIB business optimism index (Mar);
  • 17:00 USA: JOLTS job openings (Feb);
  • 20:45 USA: FOMC member Kashkari’s speech.

EURUSD rate on the hourly. Source: TradingView.

Intraday forecast: low: 1.0581 (current in Asia), high: 1.0610, close: 1.0600.

The price didn’t immediately go into a correctional phase on Monday. Euro sales on the crosses put our main pair under pressure. Before rising up to 1.0607, the Euro rate returned to 1.0570 level. A double base model looked to be forming on the hourly timeframe but this didn’t come to pass. A falling cross tipped the scales back in the favour of sellers. In Asia, the rate has fallen to 1.0581.

At the current moment, I can’t envisage our pair growing significantly. I think that today’s movements will largely mirror Monday’s. US bond yields are currently in the red. Taking this into account, my forecast has our target on the trend line at 1.0610. There’s nothing to contradict this view on the hourly indicators.

Given that the Stochastic is down, the euro-bulls have about 3-4 hours to try and create a bullish impulse. Keep an eye on the main EUR/GBP cross. For our main pair to grow, the cross needs to break 0.8530 level.

The highest trading volume yesterday occurred at 1.0618. If this level gets broken through, then after the trend line gets broken through, the 45th degree will be unlikely to stop buyers.

There are many buyers in waiting. This means that as soon as the Stochastic reverses into the buy zone, the bearish risk will sharply increase. By the end of yesterday’s session, there was no confirmed break in the trend line, even though the price is currently below it. This means that when making trades on corrections, it would be worth lowering the volume of your positions.

While the trend line is alive and well on the hourly timeframe, sellers will use this growth to sell their Euros against the crowd.

Positives for the euro (+):

Fundamental:

(+) Bundesbank president, Jens Weidmann, has stressed that the ECB needs to bring an end to its QE program earlier than planned;

(+) ECB bosses have discussed the possibility of raising interest rates before the QE program comes to an end;

(+) Head of the ECB, Mario Draghi, has hinted that the central bank may not need to provide any further stimulus to revitalise Europe’s economy. From April to December 2017, the ECB will reduce their monthly assets purchases from 80 to 60 billion EUR;

(+) On the 24th of March, Donald Trump withdrew his proposed healthcare bill to replace Obamacare from the US Congress’ agenda;

Technical (short-term):

(+) Small speculators have increased their long positions by 1,181 to 65,366 contracts. Short positions have been reduced by 3,261 to 59,842 contracts. Net-long positions have grown from 1,082 to 5,524 contracts;

(+) US 10-year bond yields: 2.353% (down 1.21% from 10/04/17);

(+) In Asia, US 10Y bond yields have fallen by 0.85% to 2.341%;

(+) EURGBP (W):  CCI (20) – up;

(+)EURGBP (D): CCI (20), AC, AO – up;

(+) EURUSD (M): Stochastic (5,3,3), AO, AC, CCI (20) – up;

(+) EURUSD (W): AO, AC – up;

(+) EURUSD (D): AC – up;

Negatives for the euro (-):

Fundamental:

(-) Head of the ECB – revision of monetary policy not required for the moment;

(-) According to CME Group’s FedWatch Tool, on Monday the 7th of April, the probability of a rate hike in May has fallen from 5.3% to 4.3%, in June from 67.2% to 66.2% and in July from 73.8% to 68.7%;

(-) Political risks in Europe (French elections);

Technical factors (short-term):

(-) According to data from 04/04/17, large speculators on the Chicago exchange have reduced their long and short positions. long positions have fallen by 4,506 to 155,947 contracts, while short positions have fallen by 1,314 to 166,294 contracts. Net-short positions have grown from 7,155 to 10,347 contracts;

(-) Short/long ratio according to myfxbook as of 7:11 EET: 19%/80%, lots: 7863/31489  (previous day: 3399/12390), positions: 28881/63205 (previous day: 11662/29566);

(-) German 10-year bond yields: 0.207% (down 11.54% from 10/04/17);

(-) EURGBP (M): AC, AO, CCI (20), Stochastic (5,3,3) – down;

(-) EURGBP (W): Stochastic (5,3,3), AO, AC – down;

(-) EURGBP (D): Stochastic (5,3,3) – down;

(-) EURUSD (W): Stochastic (5,3,3) – down;

(-) EURUSD (D): Stochastic (5,3,3), AO, CCI (20) – down;

Built into the price:

(-)  The Ex-Prime Minister of France, Alain Juppe, has ruled himself out of participating in the presidential election;

(-) Fed member Evans is expecting 2-3 rate hikes in 2017. The Federal Reserve will make a decision about the next hike in June;

(-) President of the Philadelphia Fed, Harker, announced that the Federal Reserve will continue to gradually increase interest rates throughout 2017;

(-) Eric Rosengren, president of the Boston Fed, argues that the central bank should raise interest rates every other session, meaning that he expects to see another 3 hikes this year;

(-) FOMC member Williams is envisaging another 2-3 rate hikes this year and isn’t ruling out the possibility of even more. The Fed could also start reducing its balance sheet this year, which is earlier than many economists had predicted;

(-) Dallas Fed president Kaplan has said 3 rate hikes in 2017 is his base case;

(-) FOMC member Mester says that the Fed needs to reduce the size of its balance sheet this year;

(-) St. Louis Fed president Bullard has said that the Federal Reserve needs to act quickly on normalising its balance sheet;

(+) François Bayrou, leader of the “Democratic Movement” party, has ruled out running for the presidency and thrown his weight behind independent candidate Emmanuel Macron;

(+) Marine Le Pen has had her EU parliamentary immunity from prosecution lifted for political reasons;

(+) US president Donald Trump favours a weaker dollar;

(+) The threshold for acceptable US government debt of 20.1 trillion USD may be reached by March this year. This will create headaches for new US president Donald Trump;

(+) The Greek government has made some progress in its talks with international creditors on the second stage of their reform program;

(+) Ewald Nowotny, a member of the ECB’s governing council, has said that the bank could raise the deposit rate before the main refinancing rate;

(+) ECB member Lautenschläger warns that it’s time to prepare for a change in the bank’s policy.

US Dollar and Chinese Renminbi: Mysteries Revealed

By Dan Steinbock

The Trump administration’s exchange-rate hawks contend that the US should designate China as a “currency manipulator.” In reality, the problem is the strengthening dollar, despite massive debt US owes to foreign countries.

Before the Trump-Xi Summit, the White House has often warned about “currency manipulators” while targeting US trade deficits.

After the Summit, US Treasury Secretary Steve Mnuching was asked whether the Trump administration will move forward with a plan to label China a currency manipulator. “The currency report is going to come out in the near future, and we will address that when it comes out,” Mnuchin responded.

A (very) short history of US dollar and Chinese renminbi

For years, China pegged its currency to the US dollar. Due in part to pressure from its trading partners, Beijing in 2005 appreciated the renminbi (RMB) to US dollar by 2.1 percent and moved to a “managed float” exchange rate system, based on a basket of foreign currencies.

Subsequently, the bilateral exchange rate stayed around 6.83 RMB from July 2008 to June 2010 for damage control amid the Great Recession. Currency appreciation was resumed in June 2010, but at a slower pace than in previous years.

Despite claims of devaluation, the RMB actually appreciated by 35 percent on a nominal basis against the dollar from June 2005 through July 2015.

In August, 2015, China’s central bank took new measures to improve the market-orientation of its daily central parity rate of the RMB. This was vital to support the internationalization of the RMB. Over the next three days, the RMB depreciated against the dollar by 4.4 percent – not because the central bank was opposing the market forces but precisely because it allowed those forces to affect the currency more than before.

Strengthening dollar

From July 2015 to mid-December 2016, the RMB depreciated by 13.6% against US dollar. As the US Federal Reserve has taken steps toward interest rate normalization, US dollar has strengthened.

Last fall, US dollar hit its 14-year high. It has been fueled by rising government bond yields (and the Fed’s anticipated rate hike), and expectations of Trump’s fiscal expansion (infrastructure stimulus).

After last January’s correction, US dollar remains strong.  In the next three quarters, it will be supported by the Fed’s anticipated rate hikes.

In theory, the Trump administration continues to support a “strong dollar policy.” In practice, it will not tolerate greater dollar appreciation in the short term. That’s the real reason for efforts to target China, Japan and Germany for “currency manipulation” (read: widening US trade deficits).

Yet, the very notion of “currency manipulation” is flawed. All governments take actions that directly or indirectly affect the exchange rate. In the past decade, this has been more of a rule than an exception. Moreover, reckless budget deficits can lead to a weak currency; so can low interest rates.

Debt burden requires weaker dollar

Today, the consensus is that the US-Chinese exchange rate is pretty much where it should be. In early January, US dollar climaxed at 6.96 RMB. After China began to curb speculation in the RMB depreciation, things have steadied and today a dollar equals 6.89 RMB.

Meanwhile, calls for a weaker dollar are increasing in the US. There is a deep gap between what the US owes other countries and what other countries owe to the US. And that gap is now climbing to a danger zone. Consequently, it would require a weaker dollar.

As the US must borrow ever more to finance its trade deficit, rising debt is pushing America deeper into the red. In the last quarter of 2016, foreign ownership of US debt outpaced US claims on foreigners by $8.4 trillion, which translates to a deficit that’s almost half of US GDP. Currently, it is projected to exceed 53 percent by 2021, but that could happen a lot faster if the Trump administration cuts taxes and Congress expands the budget deficit.

By some estimates, an effort to stabilize the borrowing deficit at 50 percent of the US GDP would require halving the trade gap to 2 percent of GDP by 2020, instead of the projected 4 percent path. That, however, may not be viable without 14 percent depreciation in the dollar.

The problem in the US/RMB exchange rate is not the alleged currency manipulation in China (or elsewhere). Rather, US twin deficits cast a long, potentially dangerous shadow over the US economy, which no longer justifies a strong dollar.

About the Author:

Dan Steinbock is the founder of Difference Group and has served as research director of international business at the India, China and America Institute (US) and a visiting fellow at the Shanghai Institute for International Studies (China) and the EU Center (Singapore). For more, see http://www.differencegroup.net/ 

The original, slightly shorter commentary was released by Shanghai Daily on April 10, 2017


Ichimoku Cloud Analysis 07.04.2017 (GBP/USD, GOLD)

Article By RoboForex.com

GBP USD, “Great Britain Pound vs US Dollar”

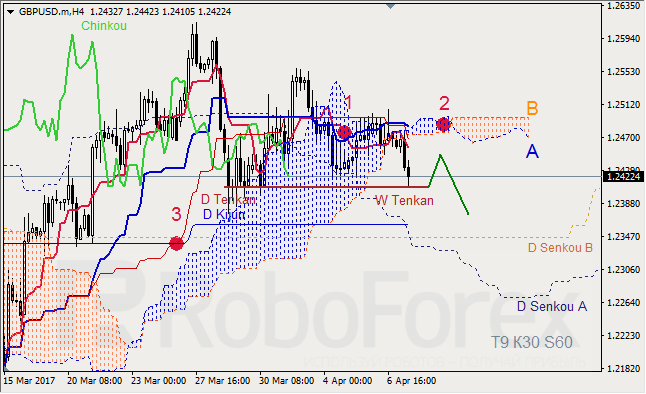
GBP USD, Time Frame H4. Indicator signals: Tenkan-Sen and Kijun-Sen intersected and formed “Dead Cross” (1); Tenkan-Sen is directed downwards. Ichimoku Cloud is heading down (2) and expanding, Chinkou Lagging Span crossed the chart to the downside, and the price is o W Tenkan-Sen. Short-term forecast: we can expect support from W Tenkan-Sen, resistance from Tenkan-Sen, and a further decline of the price.

GBP USD, Time Frame H1. Indicator signals: Tenkan-Sen and Kijun-Sen intersected above Kumo Cloud and formed “Dead Cross” (1). Ichimoku Cloud is going down (2), Chinkou Lagging Span is below the chart, and the price is below the lines.  Short-term forecast: we can expect resistance from Tenkan-Sen, and decline of the price.


XAU USD, “Gold vs US Dollar”

XAU USD, Time Frame H4. Indicator signals: Tenkan-Sen and Kijun-Sen intersected above Kumo Cloud and formed “Golden Cross” (1). Ichimoku Cloud is moving upwards (2), Chinkou Lagging Span is above the chart, and the price is above the lines. Short‑term forecast: we can expect support from Tenkan-Sen, and growth of the price towards M Senkou Span A.


RoboForex Analytical Department

Article By RoboForex.com

Attention!
Forecasts presented in this section only reflect the author’s private opinion and should not be considered as guidance for trading. RoboForex LP bears no responsibility for trading results based on trading recommendations described in these analytical reviews.

Wave Analysis 07.04.2017 (EUR/USD, GBP/USD, USD/JPY, AUD/USD)

Article By RoboForex.com

EUR USD, “Euro vs US Dollar”

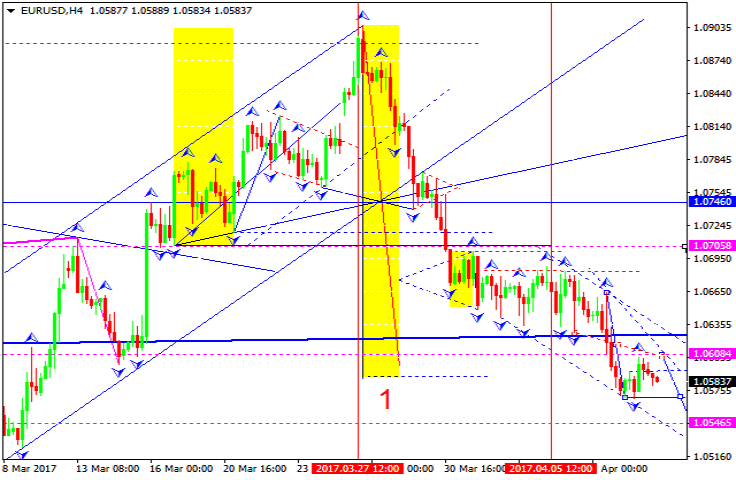
After completing the wave 2 in the form of the double zigzag and the descending impulse in the wave [i], the EUR/USD pair probably finished the wave [ii]. Consequently, in the nearest future the market may start a new decline and form the bearish impulse in the wave (i) of [iii].

More detailed structure is shown on the M30 chart. Probably, after completing the flat in the wave [ii], the pair formed the descending impulse in the wave i. In the future, the market is expected to continue falling in the wave iii of (i).


GBP USD, “Great Britain Pound vs US Dollar”

It looks like the GBP/USD pair is starting to extend the wave iii of (v). Earlier, the price finished the horizontal triangle in the wave (iv) and the bearish impulse in the wave i. As a result, in the nearest future the market may continue moving downwards.

As we can see at the H1 chart, after completing the wave ii and the bearish impulse in the wave [1] of iii, the pair probably formed the wave [2] in the form of the zigzag. Consequently, in the nearest future the market may fall in the wave [3].


USD JPY, “US Dollar vs Japanese Yen”

It’s highly likely that the wave (c) of [y] is taking the form of the diagonal triangle. Earlier, the USD/JPY pair finished the bearish impulse in the wave (a) and the correctional wave (b). After completing the wave (c), the market may try to resume moving upwards.

More detailed structure is shown on the H1 chart. Yesterday, the pair finished the third wave inside the diagonal triangle. As a result, after completing the local correction, the market may resume falling in the wave v of (c).


AUD USD, “Australian Dollar vs US Dollar”

The AUD/USD pair is still falling in the wave (iii). Earlier, after forming the horizontal triangle in the wave 4, the price started moving downwards in the wave (i). During the next several days, the market may continue falling.

At the H1 chart, the pair is forming the third wave in the extended wave (iii). Earlier, the price finished the zigzag in wave (ii) and the descending impulse in the wave i. On Friday, the market is expected to continue moving downwards.


RoboForex Analytical Department

Article By RoboForex.com

Attention!
Forecasts presented in this section only reflect the author’s private opinion and should not be considered as guidance for trading. RoboForex LP bears no responsibility for trading results based on trading recommendations described in these analytical reviews.

EUR/USD: Monday against Friday

By Gabriel Ojimadu, Alpari

Previous:

Trading on the EUR/USD currency pair closed in the red on Friday. The Euro fell on the back of contradictory data from the US. In March, the US created twice fewer jobs than they had forecasted and the figures for January and February were revised downwards. At the same time, unemployment fell by 0.2% to 4.5%.

98,000 new jobs were created in the US in March outside the agricultural sector, just over half the forecasted 180,000. The figure for February was revised down from  235,000 to 219,000 and for January from 238,000 to 216,000. The cumulative downwards revision for the two months came to 38,000. The January figure was revised up last month from 227,000 to 238,000.

The participation rate stayed at 63% while unemployment came down from 4.7% to 4.5% (forecast: 4.7%, previous reading: 4.7%). The index for average hourly earnings in the US came to 0.2% (forecast: 0.2%, previous reading revised from 2.0% to 0.3%).

The Euro grew by 45 points in response to the low NFP figures. The news’ effect on the market turned out to be rather inconsequential. The Euro had lost all its gains by the end of the session, falling to 1.0580 on the back of rising US bond yields.

Market expectations:

In Asia, the single currency has renewed its minimum against the greenback. At the time of writing, the Euro is selling for 1.0584 against a minimum of 1.0570. I don’t do market analyses on Mondays. After payrolls day, my forecast always looks to movements against Friday’s. The target for recovery is 1.0617.

Day’s news (GMT+3):

  • 11:30 Eurozone: Sentix investor confidence (Apr);
  • 15:15 Canada: housing starts (Mar);
  • 16:00 EU: ECB member Constancio’s speech;
  • 17:00 USA: labor market conditions index (Mar);
  • 23:10 USA: Fed’s Yellen speech.

EURUSD rate on the hourly. Source: TradingView.

Intraday forecast: low: 1.0570, high: 1.0617, close: 1.0606.

On Friday, after the support at 1.0630 was broken, the Euro fell to the 90th degree. This isn’t a particularly important support/resistance level, so we need to be ready for a renewed minimum at 1.0555.

Given that the price is trading around trend line, and that today is Monday, the 90th degree could provide a bullish signal. On Mondays, after some impulsive movement, I always look for movement against Friday’s. My forecasted target is on the balance line at 1.0617.

As quotes recover, it’s worth keeping an eye on 1.0596 (22 degrees) level. According to the trend, we could see some renewed selling of the Euro from here given that sellers have lowered the price below the trend line. We’ll find out whether or not the breakthrough was false as the daily candlestick closes. If the day closes higher than 1.0595, then the breakthrough was false, if lower, it was real. If the price rebounds from the 22nd degree, there is a risk of it going towards the 112th degree.

There is one important moment. The trend line was broken through on the daily timeframe for US 10Y bonds. This means that if the breakthrough on the EUR/USD is a real one (close below 1.0595), wave analyses will revise their targets to below 1.0340 as they would consider the three-wave upwards correction from the 3rd of January’s minimum complete.

There are no important events planned in Europe today. Late tonight, head of the Federal Reserve, Janet Yellen, will make a speech. Any incautious remarks about interest rates could weigh negatively on the Euro.

Positives for the euro (+):

Fundamental:

(+) Bundesbank president, Jens Weidmann, has stressed that the ECB needs to bring an end to its QE program earlier than planned;

(+) ECB bosses have discussed the possibility of raising interest rates before the QE program comes to an end;

(+) Head of the ECB, Mario Draghi, has hinted that the central bank may not need to provide any further stimulus to revitalise Europe’s economy. From April to December 2017, the ECB will reduce their monthly assets purchases from 80 to 60 billion EUR;

(+) On the 24th of March, Donald Trump withdrew his proposed healthcare bill to replace Obamacare from the US Congress’ agenda;

Technical (short-term):

(+) Small speculators have increased their long positions by 1,181 to 65,366 contracts. Short positions have been reduced by 3,261 to 59,842 contracts. Net-long positions have grown from 1,082 to 5,524 contracts;

(+) EURGBP (W):  CCI (20) – up;

(+)EURGBP (D): CCI (20), Stochastic (5,3,3), AC, AO – up;

(+) EURUSD (M): Stochastic (5,3,3), AO, AC, CCI (20) – up;

(+) EURUSD (W): AO, AC – up;

(+) EURUSD (D): AC – up;

Negatives for the euro (-):

Fundamental:

(-) Head of the ECB – revision of monetary policy not required for the moment;

(-) Eric Rosengren, president of the Boston Fed, argues that the central bank should raise interest rates every other session, meaning that he expects to see another 3 hikes this year;

(-) FOMC member Williams is envisaging another 2-3 rate hikes this year and isn’t ruling out the possibility of even more. The Fed could also start reducing its balance sheet this year, which is earlier than many economists had predicted;

(-) Dallas Fed president Kaplan has said 3 rate hikes in 2017 is his base case;

(-) FOMC member Mester says that the Fed needs to reduce the size of its balance sheet this year;

(-) St. Louis Fed president Bullard has said that the Federal Reserve needs to act quickly on normalising its balance sheet;

(-) According to CME Group’s FedWatch Tool, on Friday the 7th of April, the probability of a rate hike in May remains 5.3%. The probability in June has fallen from 70.9% 67.2% and in July remains 73.8%;

(-) Political risks in Europe (French elections);

Technical factors (short-term):

(-) According to data from 04/04/17, large speculators on the Chicago exchange have reduced their long and short positions. long positions have fallen by 4,506 to 155,947 contracts, while short positions have fallen by 1,314 to 166,294 contracts. Net-short positions have grown from 7,155 to 10,347 contracts;

(-) Short/long ratio according to myfxbook as of 7:02 EET: 21%/78%, lots: 3399/12390 (previous day: 9256/32004), positions: 11662/29566 (previous day: 35806/64580);

(-) German 10-year bond yields: 0.234% (down 8.59% from 07/04/17);

(-) US 10-year bond yields: 2.382% (up 1.53% from 07/04/17);

(-) In Asia, US 10Y bond yields have fallen by 0.54% to 2.386%;

(-) EURGBP (M): AC, AO, CCI (20), Stochastic (5,3,3) – down;

(-) EURGBP (W): Stochastic (5,3,3), CCI (20) – down;

(-) EURUSD (W): Stochastic (5,3,3) – down;

(-) EURUSD (D): Stochastic (5,3,3), AO, CCI (20) – down;

Built into the price:

(-)  The Ex-Prime Minister of France, Alain Juppe, has ruled himself out of participating in the presidential election;

(-) Fed member Evans is expecting 2-3 rate hikes in 2017. The Federal Reserve will make a decision about the next hike in June;

(-) President of the Philadelphia Fed, Harker, announced that the Federal Reserve will continue to gradually increase interest rates throughout 2017;

(+) François Bayrou, leader of the “Democratic Movement” party, has ruled out running for the presidency and thrown his weight behind independent candidate Emmanuel Macron;

(+) Marine Le Pen has had her EU parliamentary immunity from prosecution lifted for political reasons;

(+) US president Donald Trump favours a weaker dollar;

(+) The threshold for acceptable US government debt of 20.1 trillion USD may be reached by March this year. This will create headaches for new US president Donald Trump;

(+) The Greek government has made some progress in its talks with international creditors on the second stage of their reform program;

(+) Ewald Nowotny, a member of the ECB’s governing council, has said that the bank could raise the deposit rate before the main refinancing rate;

(+) ECB member Lautenschläger warns that it’s time to prepare for a change in the bank’s policy.

The Impact of Fake News on the Markets

By Adinah Brown

Long gone are the days in which we waited for the evening news to be aired on TV or for the morning newspaper to be thrown across our lawns to get the latest financial news. Today’s rapid digital era makes getting the news a 24/7 event. Social media has become the go-to place for many to get the latest news and news outlets are increasingly relying on their digital channels for distribution.

This surge in the use of the internet for financial news consumption, has developed on the back of constant connectivity and the urge to create the latest viral piece. A combination which has turned the web into the perfect arena for fake financial news. While some news pieces are so far-fetched that are easily spotted as fake, others seem so real that they quickly spread through social media, affecting the prices of various financial assets.

In recent years, investment firms have established the habit of scouring through social media networks to analyze posts from news outlets and industry leaders with the purpose of gauging market sentiment. While these firms use systems to try and differentiate reliable news from unreliable ones, the systems aren’t perfect and sometimes fall victim to fake news.

In April of 2013, the official Twitter handle of the reputable news outlet, Associated Press, got hacked, and a report of two explosions taking place at the White House and then President Barack Obama getting hurt, was twitted.  Although the then White House Press Secretary and the AP were quick to discredit the news and issue statements, the market impact was already done and traders around the world were trading on the Tweet. The Dow Jones dropped over 140 points, quickly recovering with triple-digit gains. According to Reuters, the temporary loss may have totaled $136.5 billion in the S&P 500 alone.

When the media is constantly looking to bring the next big story, journalists are often quick to report news based on their own biases and agenda, and when seeing the public’s reaction in the form of retweets and shares, the media incites crowds to take even further action, just to drive clicks.

Adding fake news to times of hypersensitivity towards terrorism threats for example, makes people believe the media without so much as fact checking, making logical choices or waiting for the dust to settle. This is particularly an issue for fundamental traders, who use the news as fact checking mechanisms. A fundamental trader may hear a financial news story and believe it. If enough traders take the same action, prices are driven in a certain direction, and by the time the dust settles, people have already lost significant dollars.

As common channels of financial news delivery, search engine giant Google and social media leader Facebook, have started to build their very own fake news detectors. However, until these B.S detectors become sufficiently sophisticated, traders should do their due diligence by fact checking news pieces and resisting the urge to react.

About the Author:

Adinah Brown is a professional writer who has worked in a wide range of industry settings, including corporate industry, government and non-government organizations. Within many of these positions, Adinah has provided skilled marketing and advertising services and is currently the Content Manager at Leverate.