Currently, the short-term trend for the SPX is NEUTRAL. The intermediate and long term trends are still very BULLISH! There is No trend, in the market, at this time. It is neither overbought or oversold.
The SPX is in a ‘Non-Trending’ market. I expect this next retracement will be completed by the end of April 2017. I plan on taking advantage of this summer’s rally.
I am anxiously watching the 50-day moving average, for the next direction, as to whether they are about to roll over. This moving average is one of the most-watched technical indicators for institutional firms and helps shift market psychology. I am still looking for much higher highs in the stock market throughout 2017.
As I have mentioned, in my previous reports, I am expecting a pullback/consolidation in the equity markets.
I am expecting gold to cross $1300.00/oz. and silver to cross $19.00/oz. by the end of April.
In addition, I am expecting a “buy-in-May” event in 2017. This could begin our rally with the SPX reaching into the 2500 area during the summer.
This market is Not bearish, so I would suggest that you not trade against this very strong BULLISH UPTREND.
The Importance of Sentiment!
The markets direction is driven by “market sentiment” or “social mood.” Forget about “logic” when it comes to the markets. This is the reason why so many were looking the wrong way when Trump won the election.
“Market sentiment” in equities clearly suggested that we were heading higher in early November of 2016, regardless of who won the election.
Social experiments which were conducted, over the last 30 years, have proven this to be real, despite the general public’s belief to the contrary.
Market bottoms and tops typically occur when sentiment reaches an extreme. For instance, when Wall Street is “euphoric”, after a sustained rally, it suggests buying power is exhausted. When there is an exceptionally high number of bears, after a sustained downturn, a bottom will be close at hand.
The Consumer Confidence Index reached its’ highest level since December 2000, helped by American’s perceptions about business conditions and the job market. Business sentiment is also high. The National Federation of Independent Business, which represents small businesses, says optimism is at one of its’ highest levels in more than four decades, based, in part, on expectations of forthcoming positive developments in Washington, D.C. The National Association of Home Builders says builder sentiment rose in March to its’ highest level since June 2005.
Conclusion:
Presently, there is fear in the marketplace.
If you do not have a set of rules for trading, then this will definitely help you TIME your trades.
Patience Pays Off Using MRM – Momentum Reversal Method !
One of the key tenants of my Momentum Reversal trading is “waiting for the right trigger/event and getting in early”. I find this is one of the most difficult aspects for most traders to understand and to master.
Macroeconomic overview: President Donald Trump said that his administration will not label China a currency manipulator, backing away from a campaign promise, even as he said the U.S. dollar was “getting too strong” and would eventually hurt the economy. The United States last branded China a currency manipulator in 1994. Under U.S. law, labeling a country as currency manipulator can trigger an investigation and negotiations on tariffs and trade.
In an interview with The Wall Street Journal, Trump also said he would like to see U.S. interest rates stay low, another comment at odds with what he had often said during the election campaign.
The U.S. dollar fell broadly on Trump’s comments on both the strong dollar and interest rates.
Trump’s comments broke with a long-standing practice of both U.S. Democratic and Republican administrations of refraining from commenting on policy set by the independent Federal Reserve. It is also highly unusual for a president to address the dollar’s value, which is a subject usually left to the U.S. Treasury secretary.
Trump also told the Journal that he respected Federal Reserve Chair Janet Yellen and said she was “not toast” when her current term ends in 2018. That was also a turnaround from his frequent criticism of Yellen during his campaign, when he said she was keeping interest rates too low. At other times, however, Trump had said that low rates were good because higher rates would strengthen the dollar and hurt American exports and manufacturers.
Technical analysis: The EUR/USD rose and close above 7-day exponential moving average yesterday (1.0640). Today’s close above this level would strengthen our short-term bullish expectations. The 21-day moving average is next resistance at 1.0713.
Short-term signal: We stay long for 1.0715 and raised the stop-loss to 1.0615.
Long-term outlook: We have changed our long-term outlook to slightly bullish. USD reaction to Trump’s comments shows that ECB governor Mario Draghi is not the only jawboning master in the market. What’s more, the ECB will probably start to think about ending its accommodative policy soon.
AUD/USD: Sharp rebound on Trump comments and jobs data
Macroeconomic overview: The AUD bounced sharply on Thursday, having been thrown a lifeline by U.S. President Donald Trump who undermined his own currency by saying it was too strong.
The AUD got an added boost from upbeat readings on employment at home and trade in China where both exports and imports beat expectations.
Data from the Australian Bureau of Statistics showed the jobless rate held at a 13-month peak of 5.9%, in line with expectations. Yet employment leapt 60.9k, far exceeding anticipation of a 20k increase. The highly volatile series showed that the gain was led by a 74.5k jump in full-time jobs, reversing a year-long decline during which all the increase in positions were for part-time ones.
That turnaround will be welcomed by the Reserve Bank of Australia, which this month sounded a new note of caution on the labour market, fearing it could keep wages, and thus inflation, at uncomfortably low levels.
Leading indicators of labour demand have generally been more positive. A measure of business conditions surged to a nine-year high in March with sturdy trading conditions and employment holding at a 16-month high while profitability was just shy of a recent two-year peak. A gauge of consumer confidence was also above long-term average.
Technical analysis: The AUD/USD broke above 7-day and 14-day exponential moving averages. A close above these levels would be a bullish sign. The next resistance level is 50% fibo of March-April fall at 0.7610.
Short-term signal: Our AUD/USD long opened at 0.7505 is in good shape now. We think this currency pair should recover soon given improving fundamentals of Australian economy and returning risk appetite. We have raised our target on this position to 0.7670.
AUD/JPY: We see that risk appetite is improving and this should result in higher AUD/JPY rate. We have placed AUD/JPY bid at 82.50.
Long-term outlook: We expect AUD/USD and AUD/JPY to rise in the long term.
USD/CAD: Bank of Canada turns less dovish
Macroeconomic overview: The CAD strengthened to a six-week high against the USD after the Bank of Canada turned less dovish, while comments by U.S. President Donald Trump weighed on the USD.
The Bank of Canada did not even consider cutting interest rates as it left monetary policy unchanged on Wednesday amid signs of strong growth, but it is too early to conclude the economic growth is sustainable, Governor Stephen Poloz said.
Sounding less dovish than in January, when he said policymakers discussed a possible rate cut, Poloz said the bank was “decidedly neutral” even as it raised its growth forecast for 2017.
“Given the data that we’ve seen in the last few months, I can quite clearly say no, a rate cut was not on the table at this time,” Poloz told a news conference.
Reiterating its position that material excess capacity remains in the economy, the central bank nudged up its growth forecast for 2017 but lowered its projection for potential growth to reflect “persistently weak investment.”
Taken together, the outlooks mean the bank now projects the output gap to close in the first half of 2018, sooner than the mid-2018 date predicted in January.
In a report that noted a weakness for every strength, the bank said business investment remains well below what could be expected at this stage in the recovery and wage growth remains subdued, while residential investment has been stronger than expected.
In later testimony to a parliamentary committee, Poloz said it would be wrong for the bank to try to offset market factors driving the Canadian dollar, but acknowledged that a weaker currency is “selectively good” for some sectors, making exports more competitive but increasing input costs.
Poloz said speculative forces are at work in Toronto’s hot housing market, noting that prices, which rose 33% in March from a year earlier, are divorced from fundamentals. The Teranet-National Bank Composite House Price Index, which measures changes for repeat sales of single-family homes, showed prices rose 0.9% last month. It was the largest March increase in 10 years, the report said. Compared with a year ago, prices jumped 13.5%, the biggest 12-month increase since November 2006. Prices in Toronto were up a record 24.8% from a year ago.
Senior Deputy Governor Carolyn Wilkins emphasized that while the bank sets policy independently of the Fed, which has begun hiking rates, higher U.S. rates will have an impact.
The Bank of Canada will likely maintain its wait-and-see stance on monetary policy until early next year.
Technical analysis: The USD/CAD broke below two important support levels: 1.3312 (61.8% fibo of last year’s drop) and 1.3248 (50% fibo of January-March rise). This is an important bearish signal and suggests further drop.
Short-term signal: We opened a short at 1.3280 in yesterday’s Trading Strategies Summary with the target at 1.3120.
Long-term outlook: Bearish
TRADING STRATEGIES SUMMARY:
FOREX – MAJOR PAIRS:
FOREX – MAJOR CROSSES:
PRECIOUS METALS:
How to read these tables?
1.Support/Resistance – three closest important support/resistance levels 2. Position/Trading Idea: BUY/SELL – It means we are looking to open LONG/SHORT position at the Entry Price. If the order is filled we will set the suggested Target and Stop-loss level. LONG/SHORT – It means we have already taken this position at the Entry Price and expect the rate to go up/down to the Target level. 3. Stop-Loss/Profit Locked In – Sometimes we move the stop-loss level above (in case of LONG) or below (in case of SHORT) the Entry price. This means that we have locked in profit on this position. 4. Risk Factor – green “*” means high level of confidence (low level of uncertainty), grey “**” means medium level of confidence, red “***” means low level of confidence (high level of uncertainty) 5. Position Size (forex)– position size suggested for a USD 10,000 trading account in mini lots. You can calculate your position size as follows: (your account size in USD / USD 10,000) * (our position size). You should always round the result down. For example, if the result was 2.671, your position size should be 2 mini lots. This would be a great tool for your risk management! Position size (precious metals) – position size suggested for a USD 10,000 trading account in units. You can calculate your position size as follows: (your account size in USD / USD 10,000) * (our position size). 6. Profit/Loss on recently closed position(forex) – is the amount of pips we have earned/lost on recently closed position. The amount in USD is calculated on the assumption of suggested position size for USD 10,000 trading account. Profit/Loss on recently closed position (precious metals) – is profit/loss we have earned/lost per unit on recently closed position. The amount in USD is calculated on the assumption of suggested position size for USD 10,000 trading account. About the Author:
GBP USD, Time Frame H4. Indicator signals: Tenkan-Sen and Kijun-Sen intersected below Kumo Cloud and formed “Golden Cross” (1); D Tenkan-Sen and D Kijun-Sen are still influenced by D “Golden Cross” (3). Ichimoku Cloud is closed (2); Chinkou Lagging Span is on the chart. Short-term forecast: we can expect support from Tenkan-Sen – D Tenkan-Sen, and growth of the price.
GBP USD, Time Frame H1. Indicator signals: Tenkan-Sen and Kijun-Sen are still influenced by “Golden Cross” (1). Ichimoku Cloud is going up (2); Chinkou Lagging Span is above the chart. Short-term forecast: we can expect support from the cloud’s upside border, and growth of the price.
XAU USD, “Gold vs US Dollar”
XAU USD, Time Frame H4. Indicator signals: Tenkan-Sen and Kijun-Sen intersected above Kumo Cloud and formed “Golden Cross” (1); D Tenkan-Sen and D Kijun-Sen are influenced by D “Golden Cross” (3). Ichimoku Cloud is moving upwards (2); Chinkou Lagging Span is above the chart. Short‑term forecast: we can expect support from Tenkan-Sen, and growth of the price towards resistance from M Senkou Span A.
Attention! Forecasts presented in this section only reflect the author’s private opinion and should not be considered as guidance for trading. RoboForex LP bears no responsibility for trading results based on trading recommendations described in these analytical reviews.
Probably, the EUR/UDS pair is forming the third wave in the extended wave [iii]. Earlier, the price finished the double zigzag in the wave 2. As a result, in the nearest future the market may continue falling.
As we can see at the H1 chart, the pair possibly completed the zigzag(ii) with the double threeb inside it. Consequently, during the next several days the market may continue moving downwards in the wave (iii) of [iii].
GBP USD, “Great Britain Pound vs US Dollar”
Probably, the wave i of (v) is taking the form of the descending wedge. Earlier, the GBP/USD pair completed the horizontal triangle in the wave (iv). As a result, later the price is expected to continue moving downwards to reach the pattern’s downside border.
As we can see at the H1 chart, the pair is forming the fourth wave of the wedge. In the future, after completing the local correction, the price may resume falling in the wave [5] of i.
USD JPY, “US Dollar vs Japanese Yen”
It’s highly likely that the USD/JPY pair is still forming the wave [y] of 2. Earlier, the price completed the descending impulse in the wave (a). Later, the market may resume moving downwards and form the bearish impulse in the wave (c) of [y].
At the H1 chart, the pair is about to finish the third wave in the wave (c). on Wednesday, the price may reach a new low and complete wave iii, which may be followed by the bullish correction in the wave iv.
AUD USD, “Australian Dollar vs US Dollar”
The AUD/USD pair is still falling in the wave (iii). Earlier, after forming the horizontal triangle in the wave 4, the price started moving downwards in the wave (i). During the next several days, the market may continue falling.
More detailed structure is shown on the H1 chart. The wave iv took the form of the horizontal triangle, which means that the pair may continue moving downwards. Consequently, in the nearest future the market may the descending impulse in the wave v of (iii).
Attention! Forecasts presented in this section only reflect the author’s private opinion and should not be considered as guidance for trading. RoboForex LP bears no responsibility for trading results based on trading recommendations described in these analytical reviews.
The Euro closed up at the end of trading on Wednesday. The price spent the day in a sideways trend within a 35 point range from 1.0589 to 1.0624. The price broke through the trend line and exited this range towards the end of the trading day. The dollar fell on the back of comments from US president Donald Trump, who stated that the dollar is getting too strong and that it’s damaging the US economy. He also called on the Federal Reserve to maintain low interest rates.
Most interestingly, the head of the Fed, Janet Yellen, is slightly concerned about a bill that is currently pending in Congress. If accepted, this bill would change the rules on how the Federal Reserve could react to crises and the conditions for changing interest rates. The independence of the Federal Reserve is under threat.
US 10Y bond yields have fallen by 2.57% to 2.235%. The EUR/USD rate has risen to 1.0675.
Market expectations:
At the time of writing this review, the Euro is trading at 1.0673. In Asia, buyers have shifted the maximum to 1.0677. After renewing the maximum, I’m expecting a downwards correction to 1.0651. The depth of the correction will depend on whether or not buyers will want to keep their long positions open over the long weekend. Due to Easter celebrations, a lot of European exchanges will be closed on Friday and Monday.
A leap to around 1.0685/90 is possible. As Trump has strengthened the Euro, it could lose all its gains as attention turns towards the French elections. I’ll be pleasantly surprised if the price manages to reach 1.0700 in the first half of the day. In any case, though, for any further advance, it’s best to start from a rebound.
Day’s news (GMT+3):
09:00 Germany: CPI (Mar);
10:15 Switzerland: producer and import prices (Mar);
11:30 UK: BoE credit conditions survey;
15:30 Canada: manufacturing shipments (Feb), new housing price index (Feb);
17:00 USA: Michigan consumer sentiment index (Apr).
On Wednesday, the Euro closed up thanks to Trump’s comments. After talking about Syria, he turned his attention towards North Korea, and then to the US dollar. From a low of 1.0569, the Euro restored against the dollar by 90 degrees.
1.0630 level has been broken through. The next resistance is at 1.0680. US 10Y bond yields are down by 3%. The Euro’s growth is being held back by the EUR/GBP cross.
The Euro appreciated by 80 pips during trading in Chicago. After such a session rally, we should see a correction. If the correction goes according to my forecast, then we could see some continued growth on Friday as far as the 112th degree (1.0700) or higher. If the Euro rises to 1.0690/700 from when trading opens, we might see a correction to 1.0651 before the long weekend, but the Euro will likely continue to fall next week.
At the moment, the 22nd degree is at 1.0650 level. It’s best if the rate doesn’t fall below this level. If it falls below 1.0630, that would put any subsequent growth in doubt.
Positives for the euro (+):
Fundamental:
(+) US president Donald Trump favours a weaker dollar;
(+) Bundesbank president, Jens Weidmann, has stressed that the ECB needs to bring an end to its QE program earlier than planned;
(+) ECB bosses have discussed the possibility of raising interest rates before the QE program comes to an end;
(+) Head of the ECB, Mario Draghi, has hinted that the central bank may not need to provide any further stimulus to revitalise Europe’s economy. From April to December 2017, the ECB will reduce their monthly assets purchases from 80 to 60 billion EUR;
(+) On the 24th of March, Donald Trump withdrew his proposed healthcare bill to replace Obamacare from the US Congress’ agenda;
Technical (short-term):
(+) Small speculators have increased their long positions by 1,181 to 65,366 contracts. Short positions have been reduced by 3,261 to 59,842 contracts. Net-long positions have grown from 1,082 to 5,524 contracts;
(+) US 10-year bond yields: 2.246% (down 2.26% from 12/04/17);
(+) In Asia, US 10Y bond yields have fallen by 3.09% to 2.225%;
(+) EURUSD (D): AC, Stochastic (5,3,3), CCI (20) – up;
Negatives for the euro (-):
Fundamental:
(-) Head of the ECB – revision of monetary policy not required for the moment;
(-) According to CME Group’s FedWatch Tool, on Wednesday the 12th of April, the probability of a rate hike in May has risen from 4.3% to 5.3% and in June from 61.7% to 62.1%. The probability of a rate hike in July has fallen from 65.6% to 65.0%;
(-) Political risks in Europe (French elections);
Technical factors (short-term):
(-) According to data from 04/04/17, large speculators on the Chicago exchange have reduced their long and short positions. long positions have fallen by 4,506 to 155,947 contracts, while short positions have fallen by 1,314 to 166,294 contracts. Net-short positions have grown from 7,155 to 10,347 contracts;
(-) Short/long ratio according to myfxbook as of 7:30 EET: 41%/58%, lots: 14854/20953 (previous day: 8779/28591), positions: 42571/46347 (previous day: 30239/58209);
(-) German 10-year bond yields: 0.201% (down 1.47% from 12/04/17);
(-) The Ex-Prime Minister of France, Alain Juppe, has ruled himself out of participating in the presidential election;
(-) Fed member Evans is expecting 2-3 rate hikes in 2017. The Federal Reserve will make a decision about the next hike in June;
(-) President of the Philadelphia Fed, Harker, announced that the Federal Reserve will continue to gradually increase interest rates throughout 2017;
(-) Eric Rosengren, president of the Boston Fed, argues that the central bank should raise interest rates every other session, meaning that he expects to see another 3 hikes this year;
(-) FOMC member Williams is envisaging another 2-3 rate hikes this year and isn’t ruling out the possibility of even more. The Fed could also start reducing its balance sheet this year, which is earlier than many economists had predicted;
(-) Dallas Fed president Kaplan has said 3 rate hikes in 2017 is his base case;
(-) FOMC member Mester says that the Fed needs to reduce the size of its balance sheet this year;
(-) St. Louis Fed president Bullard has said that the Federal Reserve needs to act quickly on normalising its balance sheet;
(+) François Bayrou, leader of the “Democratic Movement” party, has ruled out running for the presidency and thrown his weight behind independent candidate Emmanuel Macron;
(+) Marine Le Pen has had her EU parliamentary immunity from prosecution lifted for political reasons;
(+) The threshold for acceptable US government debt of 20.1 trillion USD may be reached by March this year. This will create headaches for new US president Donald Trump;
(+) The Greek government has made some progress in its talks with international creditors on the second stage of their reform program;
(+) Ewald Nowotny, a member of the ECB’s governing council, has said that the bank could raise the deposit rate before the main refinancing rate;
(+) ECB member Lautenschläger warns that it’s time to prepare for a change in the bank’s policy.
The United States is the world’s largest and most diversified economy! It is currently suffering through a protracted period of slow growth which has held down job creation and labor market participation. The Pew Research Center reported, in late 2015, that a mere 19% of Americans trust the government either always or most of the time.
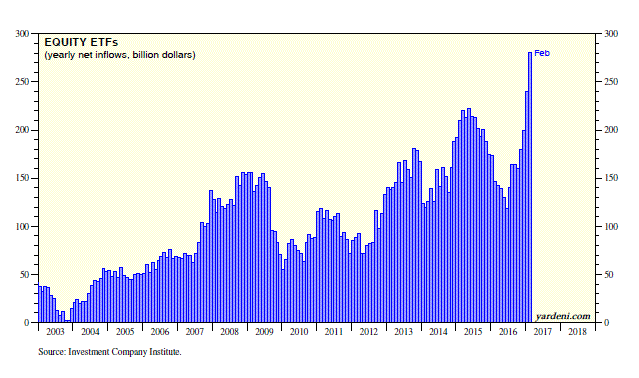
The bottom line is that this current bull market has been driven mostly by corporations which are buying back their shares, over the years. Individual investors have increasingly been moving out of equity mutual funds and into equity ETF’s.
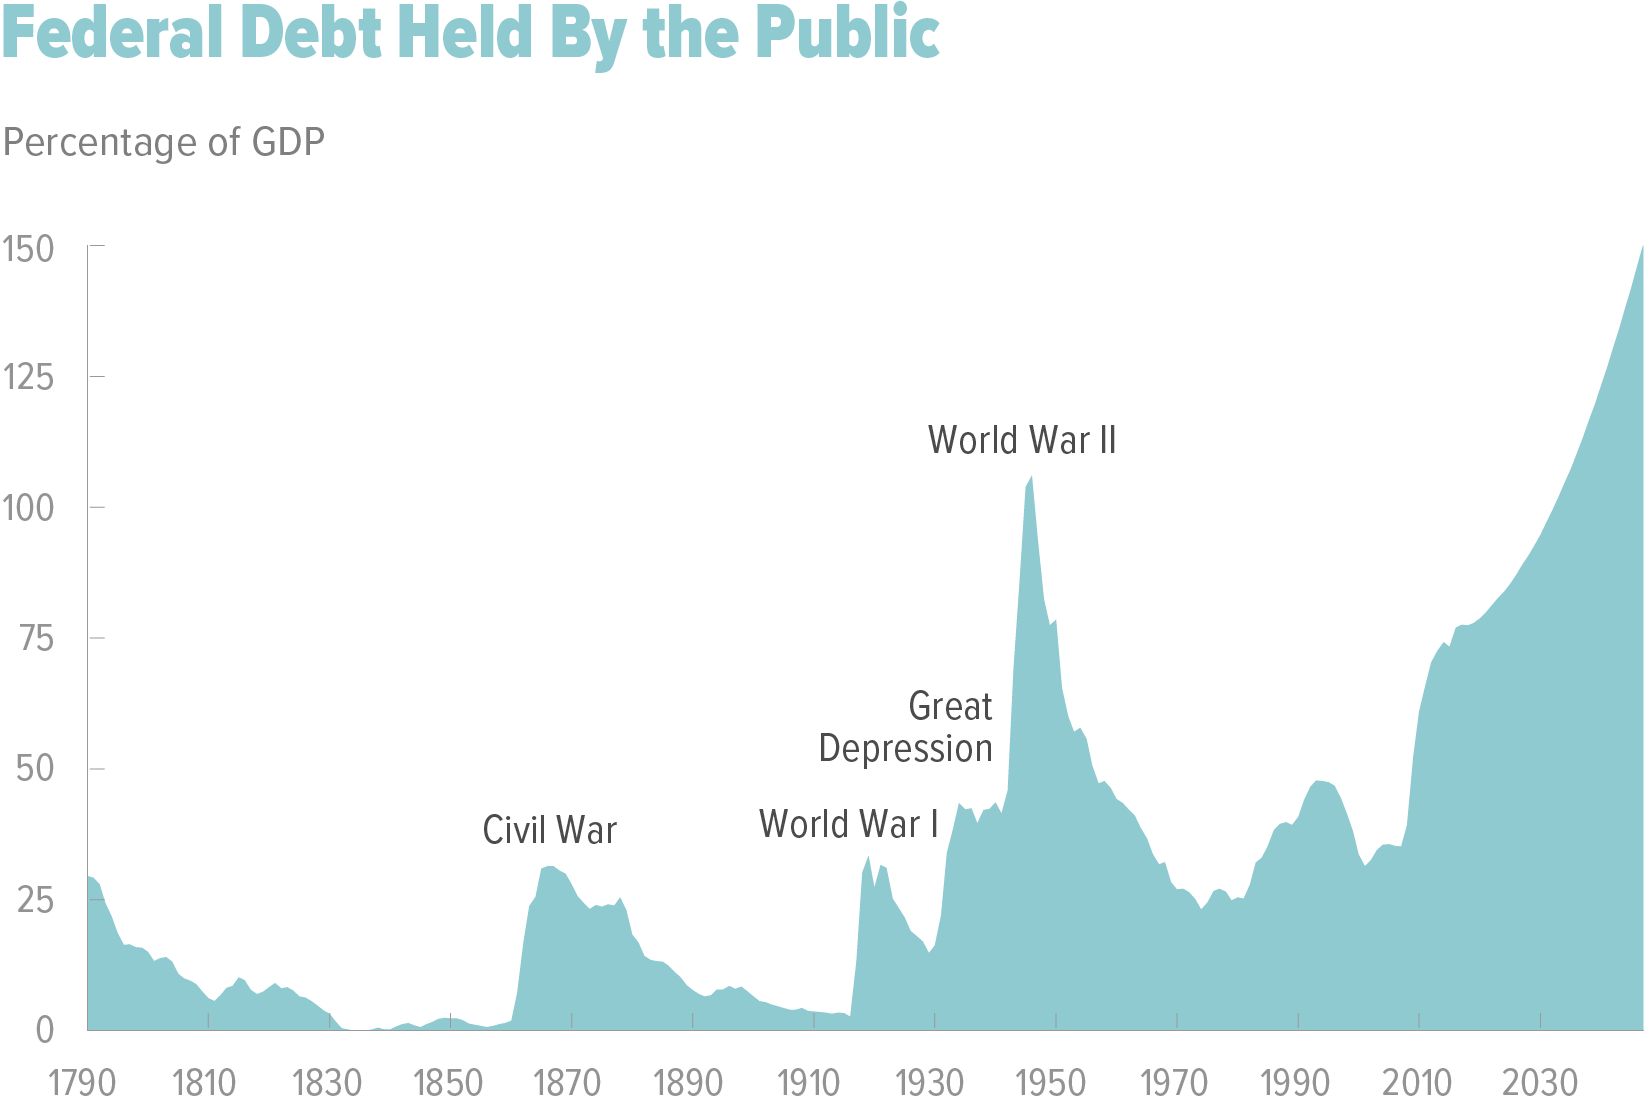
The Congressional Budget Office (CBO) reported that in fiscal year 2016, the federal budget deficit increased in relation to the GDP, for the first time since 2009. The CBO projects that over the next decade, budget deficits will follow an upward trajectory. The spending costs for retirement and health care programs targeted towards senior citizens, and rising interest payments on the government’s debt will be the root drivers. There will be only a modest growth in revenue collections. This will drive up public debt to its’ highest level of gross domestic product (GDP) since shortly after World War II ended.
The BULLISH Trend in the stock markets is not reversing in the near future.
The stock market is on an upward trajectory. Are you wondering what you should do next?
Do you want to gain the edge that you need in order to beat the markets an profit during both rising and falling prices?
Take advantage of my insight and expertise as I can help you to grow your trading account. Tune in every morning for my video analysis and market forecasts at TheGoldAndOilGuy.com on all ‘asset classes’ and new ETF trade opportunities.
I always take half off of the table, on all positions, to lock in quick solid gains and then ride out the other half for much higher returns! I manage my risk while keeping profits!
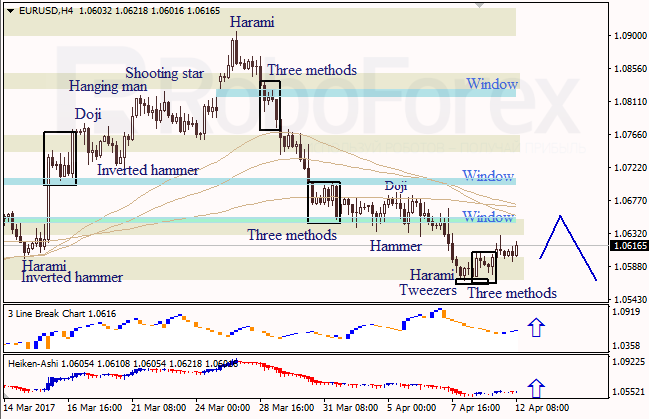
At the H4 chart of EUR USD, bullish Harami, Tweezers, and Three Methods patterns indicated an ascending correction. The downside Window is a resistance level. Three Line Break chart and Heiken Ashi candlesticks confirm that the ascending correction continues.
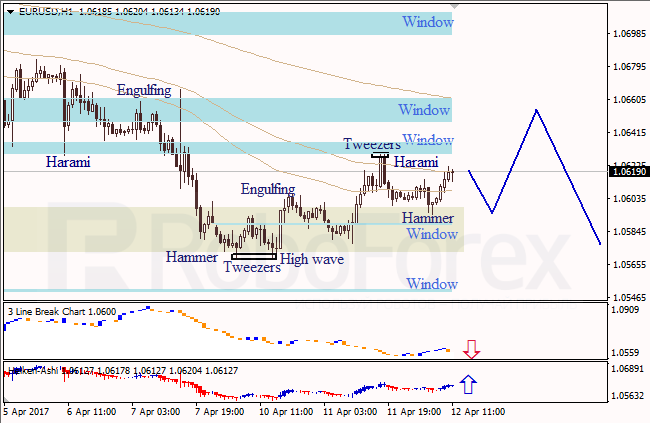
At the H1 chart of EUR USD, the correction within the downtrend continues; bullish Hammer pattern indicates an ascending movement. The Windows in the middle are resistance levels. Three Line Break chart shows a bearish direction; Heiken Ashi candlesticks confirm the ascending movement.
USD JPY, “US Dollar vs. Japanese Yen”
At the H4 chart of USD JPY, bullish Doji pattern indicates an ascending correction. Three Line Break chart and Heiken Ashi candlesticks confirm a bearish direction.
Attention! Forecasts presented in this section only reflect the author’s private opinion and should not be considered as guidance for trading. RoboForex LP bears no responsibility for trading results based on trading recommendations described in these analytical reviews.
USD/JPY: Geopolitical tensions boosted demand for safe-haven assets
Macroeconomic overview: The JPY hit five-month highs against the USD on Wednesday, as simmering geopolitical tensions checked risk appetite and put the safe-haven Japanese currency in favour. Demand for JPY was boosted by fresh worries over France’s presidential election, and possible U.S. military action against Syria and North Korea.
North Korean state media threatened a nuclear attack on the United States at any sign of American aggression on Tuesday, while U.S. President Donald Trump tweeted that Pyongyang was “looking for trouble” and the United States would “solve the problem” with or without China’s help. Trump’s administration also accused Russia of trying to shield Syria’s government from blame for a deadly gas attack, as Secretary of State Rex Tillerson brought a Western message to Moscow condemning its support for President Bashar al-Assad.
In a new twist in the two-round election in France, Jean-Luc Melenchon, a far-left veteran who for most of the campaign has been dismissed as a distant no-hoper, has surged into the top four and lies just a few percentage points behind the leaders. Though some commentators see Melenchon’s challenge as a blip that may fade, his rise has injected further uncertainty into the outcome of the election, in which centrist Emmanuel Macron has largely been seen as the favourite.
Higher risk aversion shifted investors to buy precious metals. Gold on Tuesday closed above the 200-day moving average for the first time this year after struggling to do so over the past few weeks.
Bank of Japan Governor Haruhiko Kuroda said on Wednesday yen declines may help the central bank achieve its 2% inflation target more quickly, even as geopolitical tensions lifted the Japanese currency to a five-month high against the dollar. Kuroda reiterated that the BOJ was not targeting exchange rates in guiding monetary policy and instead was pumping money into the economy to spur inflation. But he conceded the benefits a weak yen would have in accelerating inflation, such as by pushing up the cost of imports and thereby overall price growth. As the economy continues to recover and the base effect from last year’s oil price fall dissipates, inflation will accelerate and heighten public’s inflation expectations, he said.
The BOJ now projects core consumer inflation to hit 1.5% in the current fiscal year that ends in March 2018, and accelerate to 1.7% in fiscal 2018. We expect lower inflation only slightly exceeding 1% for both years.
Technical analysis: The USD/JPY broke below an important support at 110.10 yesterday. A close below this level suggests we may expect further fall, even to 200-dma, last at 108.72. 61.8% fibo of November-Decmber rally at 107.85 would be another bears’ target.
Short-term signal: Short for 109.20
Long-term outlook: Bearish
GBP/USD: British wage growth beat expectations, profit taken on GBP/USD long
Macroeconomic overview: Sterling hit its highest level in over a week against the dollar, after data on British wage growth beat expectations. Workers’ total earnings including bonuses rose by an annual 2.3% in the three months to February, unchanged from the previous period. The market had expected wage growth of 2.2%.
But after taking into account inflation, total pay growth rose just 0.2% and excluding bonuses it inched up just 0.1% in the three months to February. Those were the weakest real-terms increases seen since mid-2014.
British households are grappling with sharp increases in prices, fuelled by rising energy costs and exacerbated by the pound’s plunge that followed last year’s vote to leave the European Union. Britain’s official forecasters had expected pay growth in real-terms would evaporate later this year, but Wednesday’s figures showed this is happening already.
Data released on Tuesday showed consumer price inflation stood at 2.3% in the 12 months to March and the BoE expects it to approach 2.7% by the end of this year. We think that inflation will be above 3% at the end of the year.
The unemployment rate in the period between December and February held steady at an almost 12-year low of 4.7%, in line with market expectations.
Technical analysis: The EUR/GBP bounced from the support of 1.2361 (50% fibo of March rise) and broke above 14-day exponential moving average yesterday. The pair continues its upward move after today’s data on wages. The next resistance level is 1.2615 high on March 27.
Short-term signal: We have taken profit on GBP/USD long at 1.2500. We think that further rise is possible in the coming days. As we already have opened some other USD-selling positions, we do not want to increase risk with another GBP/USD long.
Long-term outlook: Neutral. Given high political uncertainty around the UK, we think no position is justified from risk/reward perspective.
USD/CAD: BoC is likely to raise growth forecast today
Macroeconomic overview: The CAD closed unchanged against the USD on Tuesday, failing to lock in a fresh one-week high as risk aversion offset higher oil prices in rangebound trading ahead of a Bank of Canada interest rate decision.
Prices of oil, one of Canada’s major exports, rose on reports that Saudi Arabia has told Organization of the Petroleum Exporting Countries’ officials it wants to continue output cuts for an additional six months.
The Bank of Canada is widely expected to hold rates at 0.50% when it releases its interest rate decision and Monetary Policy Report on Wednesday. Still, the strength of recent domestic data has pointed to a pickup in Canada’s economy and the central bank is likely to raise its first-quarter growth forecast.
Technical analysis: Fibos of last year’s 1.4689-1.2461 drop are holding an iron grip. 38.2% fibo at 1.3312 is a key level now. Breaking below this level could open the way to stronger drop and yesterday’s low at 1.3310 demonstrates how powerful this level has become.
Short-term signal: Out short-term strategy is to sell on upticks. We have placed sell offer at 1.3370.
Long-term outlook: We think that improving fundamentals of Canadian economy will support the loonie in the long term. An expected rise in oil prices could also help USD/CAD bears.
TRADING STRATEGIES SUMMARY:
FOREX – MAJOR PAIRS:
FOREX – MAJOR CROSSES:
PRECIOUS METALS:
How to read these tables?
1.Support/Resistance – three closest important support/resistance levels 2. Position/Trading Idea: BUY/SELL – It means we are looking to open LONG/SHORT position at the Entry Price. If the order is filled we will set the suggested Target and Stop-loss level. LONG/SHORT – It means we have already taken this position at the Entry Price and expect the rate to go up/down to the Target level. 3. Stop-Loss/Profit Locked In – Sometimes we move the stop-loss level above (in case of LONG) or below (in case of SHORT) the Entry price. This means that we have locked in profit on this position. 4. Risk Factor – green “*” means high level of confidence (low level of uncertainty), grey “**” means medium level of confidence, red “***” means low level of confidence (high level of uncertainty) 5. Position Size (forex)– position size suggested for a USD 10,000 trading account in mini lots. You can calculate your position size as follows: (your account size in USD / USD 10,000) * (our position size). You should always round the result down. For example, if the result was 2.671, your position size should be 2 mini lots. This would be a great tool for your risk management! Position size (precious metals) – position size suggested for a USD 10,000 trading account in units. You can calculate your position size as follows: (your account size in USD / USD 10,000) * (our position size). 6. Profit/Loss on recently closed position(forex) – is the amount of pips we have earned/lost on recently closed position. The amount in USD is calculated on the assumption of suggested position size for USD 10,000 trading account. Profit/Loss on recently closed position (precious metals) – is profit/loss we have earned/lost per unit on recently closed position. The amount in USD is calculated on the assumption of suggested position size for USD 10,000 trading account. About the Author:
The EUR/USD pair has completed one ascending structure. Possibly, today the price may be corrected to reach 1.0580, thus forming another consolidation range. If later the instrument breaks this range to the upside, the market may continue growing with the target at 1.0707; if to the downside – continue falling to reach 1.0507.
GBP USD, “Great Britain Pound vs US Dollar”
The GBP/USD pair has completed the correction towards 1.2486. Possibly, today the price may fall to reach 1.2410.
USD CHF, “US Dollar vs Swiss Franc”
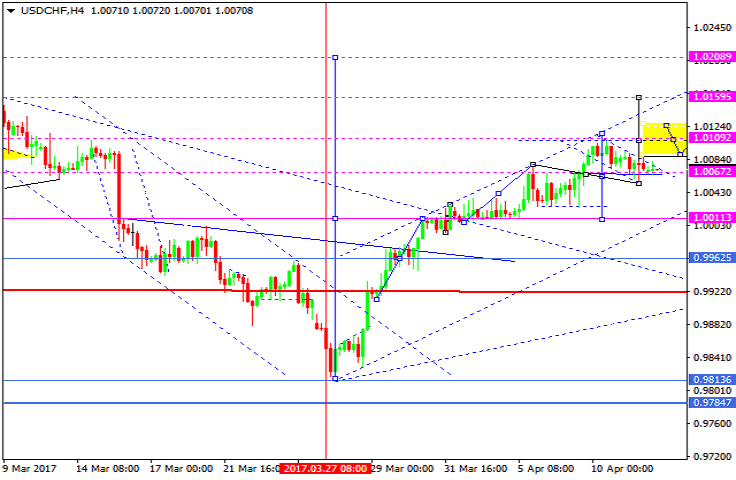
The USD/CHF pair has completed the ascending impulse. Possibly, today the price may break the high and continue growing with the target at 1.0110. Later, in our opinion, the market may form another consolidation range as a continuation pattern. The target is at 1.0200. An alternative scenario implies that the instrument may be corrected towards 1.0000.
USD JPY, “US Dollar vs Japanese Yen”
The USD/JPY pair has expanded its consolidation range to the downside. Possibly, today the price may return to 110.80 to test it from below and complete a downside continuation pattern. The local target is at 106.11.
AUD USD, “Australian Dollar vs US Dollar”
The AUD/USD pair is consolidating. If later the price breaks its consolidation range to the upside, the instrument may be corrected to reach 0.7580; if to the downside – fall inside the downtrend with the target at 0.7300.
USD RUB, “US Dollar vs Russian Ruble”
The USD/RUB pair has completed the descending impulse and the correction. Possibly, today the price may continue falling to break 56.00. The target is at 55.50.
XAU USD, “Gold vs US Dollar”
Gold is forming another descending impulse. Possibly, the price may reach 1257 and then start another correction towards 1268. Later, in our opinion, the market may fall to reach 1239.
BRENT
Brent has broken 56.30 to the upside. Possibly, today the price may continue growing to reach 57.00 and then test 56.30 from above. After that, the instrument may grow towards the local target at 59.90.
Attention! Forecasts presented in this section only reflect the author’s private opinion and should not be considered as guidance for trading. RoboForex LP bears no responsibility for trading results based on trading recommendations described in these analytical reviews.
The EUR/USD pair closed up yesterday for the second day in a row. Over the last few days, a false breakout of the trend line has been confirmed. The Euro strengthened against the US dollar to 1.0630, but that’s as far as buyers managed to push the price. As traders avoided risk and the main EUR/GBP cross fell, our EUR/USD pair went into a correctional phase.
The Euro’s fall against the pound and dollar coincided with a rise in quotes for gold and yen. This flight to more defensive assets and a fall in US bond yields were brought about by rising political tensions relating to Syria and North Korea.
US president Donald Trump has stated that Washington will deal with North Korea with or without China’s cooperation. North Korean state media has issued a statement warning of a nuclear attack on the US in the case of any provocation.
Market expectations:
Treasury bonds are currently in the red while gold and yen are appreciating. Investors are worried by the growing political tensions in Syria and on the Korean peninsula. The upcoming elections in France are also giving them cause for concern.
The single currency lost some ground against the greenback during the EUR/GBP cross’s fall, but falling US bond yields has been providing support for buyers.
Taking the long weekend ahead into account, I’m expecting our pair to continue its sideways trend. For the US session, today I’m expecting the dollar to strengthen to 1.0632.
On Tuesday, the Euro closed up. Buyers tested the 1.0630 level from below, which was previously a support. The first attempt at a breakout was unsuccessful. The EUR/GBP pair’s slide has had a negative effect on our main currency pair. Buyers have retreated to 1.0600 level. In Asia, the rate has fallen to 1.0595.
On the hourly timeframe, yesterday’s breakout of the trend line turned out to be false. Buyers now need to prepare for another assault. From a high of 1.0630, the correction amounted to 22 degrees. The price’s bounce from the lb balance line will give buyers hope of some new growth towards 1.0630.
My forecast is looking north given that US bonds are down and that I’m expecting a correction on the EUR/GBP cross. Given growing geopolitical tensions and general risk avoidance on the markets, I’m not ruling out a return to 1.0579 (45 degrees). By the way, the trend line on the daily timeframe currently passes through this level and is acting as a support. Look at the previous correction from 1.0607. The rate can go up if we see a renewed minimum in the Asian session.
Positives for the euro (+):
Fundamental:
(+) Bundesbank president, Jens Weidmann, has stressed that the ECB needs to bring an end to its QE program earlier than planned;
(+) ECB bosses have discussed the possibility of raising interest rates before the QE program comes to an end;
(+) Head of the ECB, Mario Draghi, has hinted that the central bank may not need to provide any further stimulus to revitalise Europe’s economy. From April to December 2017, the ECB will reduce their monthly assets purchases from 80 to 60 billion EUR;
(+) On the 24th of March, Donald Trump withdrew his proposed healthcare bill to replace Obamacare from the US Congress’ agenda;
Technical (short-term):
(+) Small speculators have increased their long positions by 1,181 to 65,366 contracts. Short positions have been reduced by 3,261 to 59,842 contracts. Net-long positions have grown from 1,082 to 5,524 contracts;
(+) US 10-year bond yields: 2.298% (down 2.33% from 11/04/17);
(+) In Asia, US 10Y bond yields have fallen by 1.20% to 2.287%;
(+) EURUSD (D): AC, Stochastic (5,3,3), CCI (20) – up;
Negatives for the euro (-):
Fundamental:
(-) Head of the ECB – revision of monetary policy not required for the moment;
(-) According to CME Group’s FedWatch Tool, on Tuesday the 11th of April, the probability of a rate hike in May remains 4.3%. The probability in June has fallen from 66.2% to 61.7% and in July from 68.7% to 65.6%;
(-) Political risks in Europe (French elections);
Technical factors (short-term):
(-) According to data from 04/04/17, large speculators on the Chicago exchange have reduced their long and short positions. long positions have fallen by 4,506 to 155,947 contracts, while short positions have fallen by 1,314 to 166,294 contracts. Net-short positions have grown from 7,155 to 10,347 contracts;
(-) Short/long ratio according to myfxbook as of 6:54 EET: 19%/80%, lots: 8779/28591 (previous day: 7863/31489), positions: 30239/58209 (previous day: 28881/63205);
(-) German 10-year bond yields: 0.204% (down 1.45% from 11/04/17);
(-) The Ex-Prime Minister of France, Alain Juppe, has ruled himself out of participating in the presidential election;
(-) Fed member Evans is expecting 2-3 rate hikes in 2017. The Federal Reserve will make a decision about the next hike in June;
(-) President of the Philadelphia Fed, Harker, announced that the Federal Reserve will continue to gradually increase interest rates throughout 2017;
(-) Eric Rosengren, president of the Boston Fed, argues that the central bank should raise interest rates every other session, meaning that he expects to see another 3 hikes this year;
(-) FOMC member Williams is envisaging another 2-3 rate hikes this year and isn’t ruling out the possibility of even more. The Fed could also start reducing its balance sheet this year, which is earlier than many economists had predicted;
(-) Dallas Fed president Kaplan has said 3 rate hikes in 2017 is his base case;
(-) FOMC member Mester says that the Fed needs to reduce the size of its balance sheet this year;
(-) St. Louis Fed president Bullard has said that the Federal Reserve needs to act quickly on normalising its balance sheet;
(+) François Bayrou, leader of the “Democratic Movement” party, has ruled out running for the presidency and thrown his weight behind independent candidate Emmanuel Macron;
(+) Marine Le Pen has had her EU parliamentary immunity from prosecution lifted for political reasons;
(+) US president Donald Trump favours a weaker dollar;
(+) The threshold for acceptable US government debt of 20.1 trillion USD may be reached by March this year. This will create headaches for new US president Donald Trump;
(+) The Greek government has made some progress in its talks with international creditors on the second stage of their reform program;
(+) Ewald Nowotny, a member of the ECB’s governing council, has said that the bank could raise the deposit rate before the main refinancing rate;
(+) ECB member Lautenschläger warns that it’s time to prepare for a change in the bank’s policy.