Author Archive for InvestMacro – Page 550

Murrey Math Lines 06.06.2017 (EUR/USD, GBP/JPY)

Article By RoboForex.com

EUR USD, “Euro vs US Dollar”

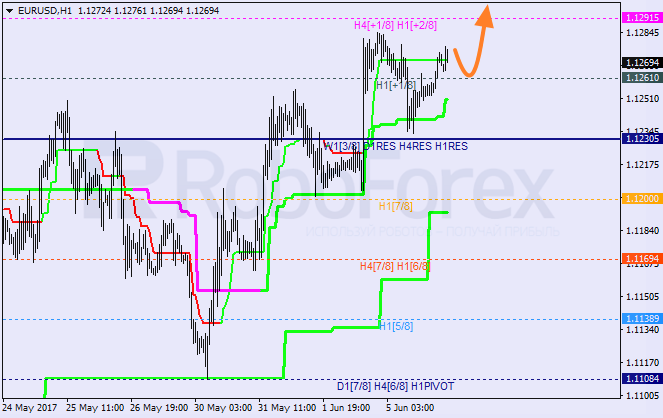
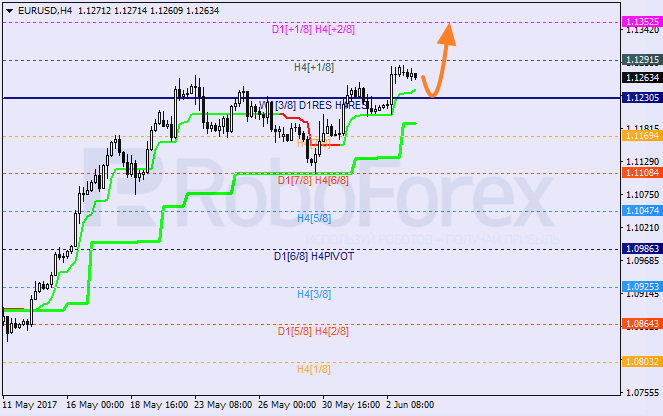
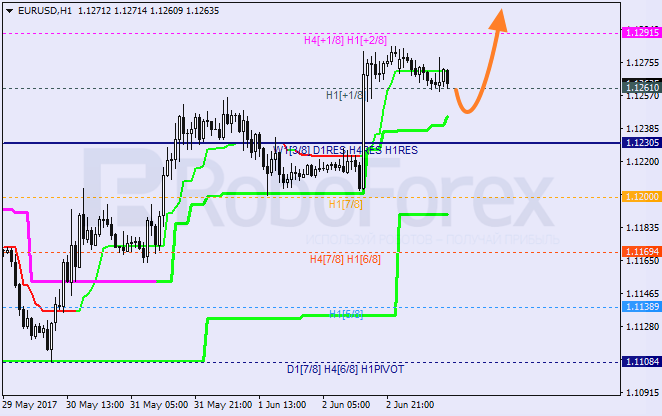
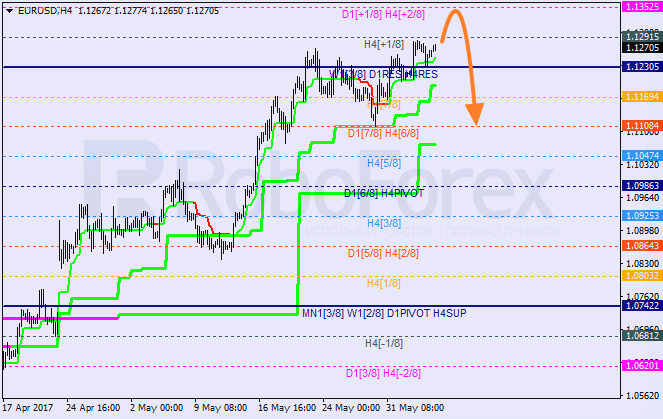
The EUR/USD pair rebounded from the 8/8 level, which means that it may reach a new local high. If later the price rebounds from the +2/8 level, the pair may start a new bearish correction.

At the H1 chart, the pair is also trading inside the “overbought zone”. The current uptrend is supported by Super Trends. If the market breaks the +2/8 level, the lines at the chart will be redrawn.


GBP JPY “Great Britain Pound vs Japanese Yen”

Possibly, In the nearest future the GBP/JPY pair may test the 1/8 level once again. If the price rebounds from this level, the market may resume growing. In this case, the closest target for bulls will be at the 4/8 level and the daily Super Trend.

The lines at the H4 and H1 charts are completely the same. To confirm a new ascending movement, the pair has to break Super Trends and the 2/8 level, and fix above them.


RoboForex Analytical Department

Article By RoboForex.com

Attention!
Forecasts presented in this section only reflect the author’s private opinion and should not be considered as guidance for trading. RoboForex LP bears no responsibility for trading results based on trading recommendations described in these analytical reviews.

Forex Technical Analysis & Forecast 06.06.2017 (EUR/USD, GBP/USD, USD/CHF, USD/JPY, AUD/USD, USD/RUB, GOLD, BRENT)

Article By RoboForex.com

EUR USD, “Euro vs US Dollar”

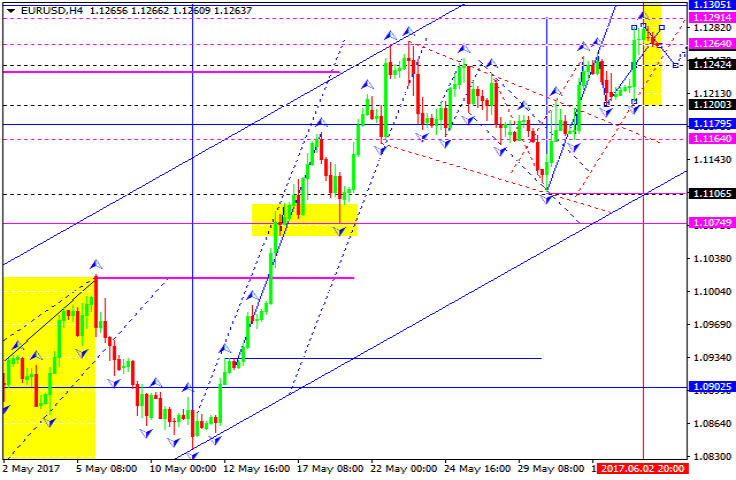
The EUR/USD pair is consolidating above 1.1200. We think, today the price may grow towards 1.1287 and then fall to reach 1.1212. Possibly, the pair may reach 1.1305 (an alternative scenario). The main scenario implies that the market may continue its descending correction with the target at 1.0900.


GBP USD, “Great Britain Pound vs US Dollar”

The GBP/USD pair is trading to break the Pennant pattern to the upside. Right now, the instrument is forming a continuation pattern around 1.2913. Possibly, the price may form the third descending structure with the target at 1.2997.


USD CHF, “US Dollar vs Swiss Franc”

The USD/CHF pair is still consolidating near its lows. Possibly, the price may reach 0.9623. Later, in our opinion, the market may form a reversal pattern to start a new correction with the target at 0.9900.


USD JPY, “US Dollar vs Japanese Yen”

The USD/JPY pair has formed a downside continuation pattern near 110.47 and already broken the low if its consolidation range. The local downside target is at 108.87.  After that, the instrument may be corrected towards 110.47.


AUD USD, “Australian Dollar vs US Dollar”

Being under pressure, the AUD/USD pair is still moving upwards. Possibly, the price may reach 0.7510 and complete the correction. Later, in our opinion, the market may continue moving downwards with the target at 0.7200.


USD RUB, “US Dollar vs Russian Ruble”

The USD/RUB pair is still consolidating without any particular direction. Possibly, the price may choose an alternative scenario and reach 57.00. The main scenario implies that the market may fall towards 55.50.


XAU USD, “Gold vs US Dollar”

Being under pressure, Gold continues growing. Possibly, the price may reach the local target at 1287.44. After that, the instrument may be corrected towards 1267.00 and then grow to form the fifth wave with the target at 1300.00.


BRENT

Brent has expanded its consolidation range and broken it to the upside. Possibly, the price may grow to reach the first target at 53.33. Later, in our opinion, the market may be corrected to reach 51.15 and then move upwards towards 55.80.


RoboForex Analytical Department

Article By RoboForex.com

Attention!
Forecasts presented in this section only reflect the author’s private opinion and should not be considered as guidance for trading. RoboForex LP bears no responsibility for trading results based on trading recommendations described in these analytical reviews.

EURUSD: investors fleeing to safe haven assets

By Gabriel Ojimadu, Alpari

Previous:

Trading on the EUR/USD pair closed down on Monday. The EUR/GBP cross sparked a downwards correction after the publication of an opinion poll for the UK general election by ICM. The pair restored after retreating to the trend line, lb and the 45th degree.

Market activity was low during the US session, when some ambiguous statistics came out. The number of factory orders for April fell in line with expectations. The previous reading was significantly revised upwards. The ISM services PMI for May dropped slightly on the previous month.

These statistics haven’t changed the sentiment on the market with regards to the FOMC’s June meeting. The probability of a rate hike this month stands at 95.8%.

US statistics:

  • The services PMI in the US fell to 56.9 (forecast: 57.0, previous reading: 57.5).
  • Factory orders in the US fell by 0.2% (forecast: -0.2%, previous reading: revised from 0.5% to 1.0%).
  • The Markit services PMI in the US grew to 53.6 (forecast: 54.1, previous reading: 54.0).

Market expectations:

The Euro has appreciated against the dollar by 0.19% in Asia, to 1.1275. There has been an increase in volatility since morning. This increase was caused by the Reserve Bank of Australia’s meeting, the ECB’s meeting, and increased caution ahead of the parliamentary elections in the UK. Additionally, on Thursday, former FBI director James Comey is set to testify to Congress. Everyone is waiting to see what he will say about Trump and Russia.

The market is moving in a similar fashion to the movements seen between the 31st of May and 2nd of June. Growth, rebound, slow recovery then acceleration. given that the trend line has resisted any approaches during the Asian session, the US dollar is set to slide against most other currencies and there is a high risk of the EUR/USD rising to 1.1336 (112 degrees). I haven’t made any forecast’s on today’s chart since I wasn’t able to pick a scenario. As the parliamentary elections and central bank meeting approach, there are currently more questions than answers.

Day’s news (GMT+3):

  • 11:30 Eurozone: Sentix investor confidence (Jun);
  • 12:00 Eurozone: retail sales (Apr);
  • 17:00 Canada: Ivey PMI (May);
  • 17:00 USA: JOLTS job openings (Apr), IBD/TIPP economic optimism (Jun).

EURUSD rate on the hourly. Source: TradingView

Intraday forecast: low: n/a, high: n/a, close: n/a.

Looking at the hourly chart, we can see that the Euro has undergone a technical correction towards the balance line lb. We know that the ICM survey is behind this correction. Gold and yen are appreciating. Traders are fleeing to safe haven assets ahead of the UK election.

In Asia, the Euro is rising on the back of a drop in US bond yields. The dollar is falling across the market. For now, there are more questions than answers and I can’t choose a scenario. Let’s wait and see how the market opens in London.

From the Era of Easing to the Era of Tightening

By Dan Steinbock

After half a decade of ultra-low rates in the United States, the Fed is hiking rates and moving ahead to reduce its massive $4.5 trillion balance sheet. The consequences will reverberate across the world, including Asia.

Before the Trump era, the Federal Reserve hoped to tighten monetary policy more often and aggressively than markets anticipated. But since November, US economic prospects have fluctuated dramatically, from the Trump trade to new volatility.

In its May meeting, the Fed left its target range for federal funds rate steady at 0.75-1 percent, in line with market expectations. It is likely to climb to 1.3 percent by the year-end and to exceed 3 percent by 2020.

In other major advanced economies, monetary stance has remained broadly unchanged. The European Central Bank (ECB), led by Mario Draghi, held its benchmark rate at 0 percent in April. While the ECB has signaled impending normalization, it will continue its asset purchases until the year-end. Even if the ECB begins rate hikes in 2018, they are likely to be low and slow. The rate could climb to 1 percent by 2020.

In Japan, Abenomics has failed, despite slight improvement in short-term growth prospects. As introduced by Haruhiko Kuroda, the chief of the Bank of Japan (BOJ), negative rates and huge asset purchases will continue. The rate may remain negative (-0.1%) until 2020 – by then Japan’s sovereign debt will exceed 260 percent of its GDP.

Yet, rate normalization is only a part of the story. After the Fed began its historical experiment with quantitative easing (QE), its then-chief Ben Bernanke accumulated a portfolio of some $4.5 trillion. Now the question is how his successor Janet Yellen plans to reduce it.

Adding to uncertainty is the fact that she is likely to be replaced at the end of her term in 2018 with a Republican whose views of US economy and markets are more in line with those of the Trump administration.

Subdued balance-sheet contraction

Since 2008, I have argued that, despite its hawkish rhetoric, the Fed will not be able to increase rates as early, as often and as much as it initially hoped. And nor will the Fed reduce its balance sheet as early, as often and as much as it initially signaled. Though widely different from the consensus half a decade ago, it seems now that both forecasts have been to the point. The Fed’s current objective seems to be to hike rates up to only 3 percent.

Theoretically, the Fed has a half a dozen options to reduce its balance sheet, according to its minutes. In practice, it will opt for one of three scenarios. It can sell some assets at once or over time. It can halt the reinvestment of maturing assets. Or it will taper the reinvestment of maturing assets. The latter is the most likely option since the Fed has officially announced its intention to deploy interest rate as its main instrument (which requires gradual shrinking of the balance sheet).

The Fed’s objective is not to fully unwind its balance sheet. Rather, it may reduce its balance sheet by about $2 trillion in some 4-5 years, according to its minutes. Concurrently, the role of the remaining $2.5 trillion could probably be legitimized as a “new policy instrument,” which would be deployed as a cushion amid future crises.

Prior to the global crisis and the QE rounds in major advanced economies, there was little understanding about the probable impact of balance sheet expansion on monetary conditions. Bernanke deemed such measures necessary, but critics saw them as neither effective nor harmless but as harbingers of an “inflation-holocaust.”

Today, the understanding of the impact of balance sheet contraction on monetary conditions remains equally deficient. Consequently, critics are likely to portray Yellen’s QT measures as ineffective, adverse, or harbingers of an impending “deflation-holocaust.”

What seems certain is that, as the Fed plans to continue increasing rates, even as it is reducing its balance sheet, both activities will translate to tightening monetary conditions – not just in the US but around the world.

Unfortunately, the track record of the Fed’s tightening is dark – even without balance-sheet reductions.

Reversal of ‘hot money’ flows?

In the early 1980s, Fed chief Paul Volcker resorted to harsh tightening that devastated US households, while leading to a “lost decade” in Latin America. Subsequently, Alan Greenspan’s rate hikes brought down struggling savings and loans associations, forcing Washington and states to bail out insolvent institutions.

In the early 1990s, Greenspan again seized tightening but then reversed his decision, which undermined expansion. In the first case, global growth decelerated to less than 1 percent; in the second, it plunged to 4 percent below zero in developing nations. In 2004-7, the rate hikes by Greenspan and his successor Ben Bernanke contributed to the global financial crisis. In low-income economies, growth stayed at 5-7 percent thanks to China’s contribution to global growth.

During the QE era, after traditional monetary policies had been exhausted, the central banks of advanced economies effectively created what I termed the “hot money” trap, thanks to short-term portfolio flows into high-yield emerging markets. As a result, the latter had to cope with asset bubbles, elevated inflation and exchange rate appreciation. That’s when Brazil’s Minister of Finance Guido Mantega first warned about “currency wars,” while China’s Minister of Commerce Chen Deming complained the mainland was being attacked by “imported inflation.”

Assuming a reverse symmetry, the impending US hikes have potential to attract “hot money” outflows from emerging economies leaving fragile countries struggling with asset shrinkages, deflation and depreciation. In that scenario, the “hot money” trap of the early 2010s would be replaced by the “cold money” trap in the late 2010s.

On the one hand, today emerging economies are stronger and better prepared to cope with tightening. On the other hand, global growth is no longer fueled by major advanced economies as in the 1980s and 1990s, but by large emerging economies, which must cope with their adverse impact – which, in turn, has potential to penalize global growth prospects.

In 2013, when Bernanke announced the Fed would no longer purchase bonds, the statement caused a mass global panic. Today, the central banks of major advanced economies are navigating into new, unknown and dangerous waters. If, in the past, over-ambitious or misguided tightening caused “lost decades,” today the net effect could be far worse.

The brief “taper tantrum” in 2013 was one thing. Multi-year rate hikes, coupled with balance-sheet reductions, in major economies that are highly indebted, suffer from aging demographics and are coping with secular stagnation – well, that’s a different story altogether.

About the Author:

Dr Steinbock is the founder of Difference Group and has served as research director at the India, China and America Institute (USA) and visiting fellow at the Shanghai Institutes for International Studies (China) and the EU Center (Singapore). For more, see http://www.differencegroup.net/

This commentary was released by South China Morning Post on June 4, 2017.

UK’s Weaker Brexit Hand with the EU

By Dan Steinbock

Prime Minister May pushed for a snap election in June 2017 to strengthen her hand in the impending Brexit talks. In practice, she has weakened UK’s bargaining power at the EU’s expense, while the latest London Bridge incident introduces new uncertainty and volatility into the EU/UK divorce proceedings.

Like too many times before, British police declared a “major incident” on London Bridge after a van reportedly hit multiple pedestrians.

The terrorist incident took place only days before a critical “snap election” that May was supposed to win with a landslide victory; but in which her Conservative Party’s lead has dropped to a new low of just one or more percentage points.

While British pollsters predict May will win most seats in Thursday’s election, some expect a landslide victory, but others believe that the Conservative majority is under threat.  Not only have UK polls been highly volatile amid election campaigns and fairly inaccurate, but the most recent ones do not yet reflect the potential effects from the London Bridge incident.

Collapse of neoliberalism, path to uncertainty

About a year ago, the UK had its referendum on the European Union (EU).  At the end, the “Leave” camp triumphed, by focusing on costly EU bureaucracies, over-inflated security concerns and immigration’s negative tradeoffs. While the campaign had less to do with facts than flawed perceptions, it proved effective.

Unfortunately, the adverse impact of the Brexit decision is still ahead.

If the UK’s neoliberal economic policies peaked in the Thatcher years, they were sustained by labor governments led by Tony Blair (1997-2007) and Gordon Brown (2007-2010). As they got the blame for the global crisis, Conservatives’ David Cameron won a mandate to govern in a coalition with Liberal Democrats.

Cameron championed fashionable social causes, including same-sex marriage and the UN target for aid spending, but cut down government’s large deficits through harsh austerity measures, including large-scale changes to welfare, immigration policy, education and health services. Nevertheless, prior to the referendum, government debt peaked at 90 percent of the GDP, which led to an IMF warning.

In 2011, Cameron became the first UK Prime Minister to “veto” the EU treaty, perhaps to bargain better membership terms with Brussels, while boosting Conservative support at home. In 2013, he pledged that, should his Conservatives win the parliamentary majority in the 2015 election, the government would negotiate more favorable terms for British membership of the EU, before a referendum. The gamble came with a price – his failure to win the Brexit referendum.

So Cameron was succeeded by Theresa May, a veteran “law and order” Tory and a long-serving Home Secretary. Meanwhile, Ed Miliband resigned as Labor’s leader and was followed by Jeremy Corbyn of the party’s “hard left.” As neoliberal economic policies collapsed, both parties sought to defuse Euroscepticism that the right-wing UK Independence Party (UKIP) and Nigel Farage had popularized.

In a sense, both parties have won. Today the two account some 80 percent of the polls, compared with barely 65 percent in the 2015 election. But in the process, cooptation of the Euro-skeptics has recalibrated each, internally. Conservatives have left behind Cameron’s laissez-faire globalization; Labor has shifted further to the left; the current leadership of neither party has much faith in the EU.

Since July 2016, May has been focused on withdrawing the UK from the EU. Last March, the UK finally invoked Article 50 of the EU Treaty to leave the EU, while May even blurted that “no deal is better than a bad deal.” In April, she announced a snap general election for June 8, “to guarantee certainty and security for years ahead.” Like Cameron in 2016, she thought she could capitalize on her popularity to ensure political consolidation before tough talks with Brussels.

Despite 20 points ahead in the polls, the row over the so-called “dementia tax” on elderly people cut her poll lead to 9 points.  After May’s U-turn on elderly care tax, the polls still pointed to a Conservative victory. At the eve of the London Bridge incident, Corbyn’s Labor had almost caught up with May’s lead.

What is certain, however, is that if May wins, her majority could be far less than expected or that she has to govern without a majority, or worse. And that means a weaker hand in the impending Brexit talks.
Again, the British political landscape has shifted dramatically, in just two months.

Rising economic pressures

The UK economy is beginning to feel Brexit pressures, particularly in business and financial services and foreign direct investment. As long as big companies lack adequate certainty about their EU operations, they tend to hedge location decisions and exhibit great caution in investment.

After the global crisis, the UK benefited from US recovery, while being propped up by the European Central Bank’s (ECB) ultra-low rates and quantitative easing. Prior to the global crisis, the UK’s growth had rested on housing and mortgage-lending, huge expansion of the financial sector, government services, oil and gas production in North Sea. While the economy had performed relatively well in the post-crisis era, growth began to slow in early 2016, along with lingering productivity growth, rising current account deficit and vulnerabilities associated with property markets.

In the first half of the 2010s, the overall fiscal deficit had been cut from the peak of over 10 percent of GDP to 4 percent. Monetary policy had remained boldly accommodative. Structural reforms sought to boost potential output. Yet, in 2017, growth was expected to remain around 1.9 percent in 2017.

As the more negative consequences of Brexit will impact the UK, GDP growth may decrease to just 1.2 percent in 2018; that’s below the eurozone’s 1.5 percent.

While rates have been cut to 0.25 percent and have been on hold, rate increases are looming in the horizon. Consumer inflation may climb to 2.6 percent in the ongoing year. Moreover, the UK continues to face fiscal and trade deficits.

In 2015, the pound peaked at almost $1.50. Prior to the referendum, I forecast the Brexit could penalize the UK pound by more than 20% and it did plunge to $1.20 by the fall. Thanks to resilience, it is now around $1.29 (about 0.87 euro). As markets open and trading begins, the pound will face new election and terror pressures.

Structurally, weaker pound supports increased overseas demand for British exports and decreased domestic demand for foreign imports. But as the UK relies more on services exports (financial and insurance services), vulnerabilities will increase if London loses its “passporting” rights upon exiting the EU.

“Soft” or “Hard” Brexit

In April 2016, UK Treasury published its report about the probable annual impact of leaving the EU on the UK after 15 years. It estimated that the Brexit could cause an almost 10 percent loss of GDP. In practice, much depends on the post-Brexit UK’s choice of trading arrangements and relationship with the EU.

The question is whether the UK would retain its membership of the European Economic Area (EEA), like Norway; or the UK opts for a negotiated bilateral agreement, such as that between the EU and Switzerland, Turkey or Canada; or a simple World Trade Organization (WTO) membership without any specific agreement with the EU, like Russia or Brazil.

A “soft” Brexit could entail some form of membership of the EU single market, in exchange for a degree of free movement. Whereas in a “hard” Brexit, the UK would not compromise on such issues as the free movement of people, leaving the EU single market and trading with the EU as if it were any other country outside Europe, based on WTO rules.

Currently, the UK appears less prepared for the impending Brexit negotiations than the 27 remaining European member states that seem united in their stance. A risk prevails that talks could fail at the first stage over the UK’s cost of leaving the EU, the so-called “Brexit bill.” Moreover, the election is not likely to strengthen her hand in Brexit negotiations. The reverse may be more likely.

After a nearly “lost decade,” the eurozone is eventually feeling more optimistic about the future. The ECB is likely to continue asset purchases until the year-end and hopes to begin rate hikes starting next year. However, if the Brexit runs out of control, what happens in the UK will not stay in the UK but spread across Europe.

About the Author:

Dr Steinbock is the founder of Difference Group and has served as research director at the India, China and America Institute (USA) and visiting fellow at the Shanghai Institutes for International Studies (China) and the EU Center (Singapore). For more, see http://www.differencegroup.net/ 


This commentary was initially published by The Manila Times on June 5, 2017.


Admiral Markets Announces Full Coverage of the UK General Election 2017

By Admiral Markets

Admiral Markets has launched a dedicated landing page, covering the latest financial news related to the UK General Election 2017, with the purpose of providing information on how to trade before, during and after the vote. The entire page and all materials are available in 12 different languages.

Traders have the possibility to stay up-to-date by monitoring widgets, which display the market sentiment on an hourly basis, the most popular candidate of the day, as well as live statistics on the Forex and CFD instruments that may be most affected.

Additionally, three different articles offer traders a historical review of recent elections, a pre-election forecast, as well as an analysis of the UK General Election 2017 results’ impact on financial markets.

Lastly, traders can sign up to two free webinars (pre and post election), where a professional trader discusses how to trade the UK General Election, as well as the implications of the final results.

Admiral Markets also informs its clients regarding changes to trading terms throughout the period of the UK General Election (23:00 EET on Thursday, 8 June 2017 until 12:00 EET on Friday, 9 June 2017). The changes include an increase in the margin requirements for a number of instruments. For the full announcement, please visit Admiral Markets’ website.

A ‘snap’ UK General Election is due to be held on Thursday, 8 June, as Prime Minister May decided to call an election three years early in an attempt to strengthen her control within UK Parliament and push her agenda ahead of the upcoming Brexit negotiations with the EU.

Press contact: [email protected].

Risk disclosure: Forex and CFD’s carry a high level of risk and losses may exceed your initial deposit. Admiral Markets UK Ltd. recommends you seek advice from an independent financial advisor to ensure that you understand the risks involved with Forex, CFD’s, Margin and Leveraged trading.


Murrey Math Lines 05.06.2017 (EUR/USD, CHF/JPY)

Article By RoboForex.com

EUR USD, “Euro vs US Dollar”

The EUR/USD pair is consolidating inside the “overbought zone”. In the nearest future, the market may test the 8/8level and the H4 Super Trend. If the price rebounds from this level, the pair may resume moving upwards to reach the +2/8 one.

As we can see at the H1 chart, Super Trends are still influenced by “bullish cross”. Possibly, the price may break the +2/8 level soon. If this level is broken, the lines at the chart will be redrawn.


CHF JPY, “Swiss Franc vs Japanese Yen”

The CHF/JPY pair is trading inside the “overbought zone” close to the H4 Super Trend. In the nearest future, the market may resume growing and test the +2/8 level.

At the H1 chart, the 5/8 level provided support. Consequently, on Monday the pair may start a new growth and break the local high. The closest target for bull is at the +2/8 level.


RoboForex Analytical Department

Article By RoboForex.com

Attention!
Forecasts presented in this section only reflect the author’s private opinion and should not be considered as guidance for trading. RoboForex LP bears no responsibility for trading results based on trading recommendations described in these analytical reviews.

Forex Technical Analysis & Forecast 05.06.2017 (EUR/USD, GBP/USD, USD/CHF, USD/JPY, AUD/USD, USD/RUB, GOLD, BRENT)

Article By RoboForex.com

EUR USD, “Euro vs US Dollar”

The EUR/USD pair has broken 1.1252 to the upside and right now is consolidating. Possibly, today the price may move according to an alternative scenario and grow towards 1.1305. However, the main scenario implies that the pair may reverse and continue falling inside the downtrend towards 1.0900. The first target is at 1.1100.


GBP USD, “Great Britain Pound vs US Dollar”

The GBP/USD pair is consolidating and forming the Pennant pattern. After breaking it to the upside, the instrument may move according to an alternative scenario and grow towards 1.2970. However, if the price breaks the pattern to the downside, the correction may continue to reach the local target at 1.2760.


USD CHF, “US Dollar vs Swiss Franc”

The USD/CHF pair has completed the extension. Possibly, today the price may consolidate, break this range to the upside, and then start another ascending correction towards 0.9900. The first target is at 0.9767.


USD JPY, “US Dollar vs Japanese Yen”

The USD/JPY pair hasn’t been able to continue its ascending structure and right now is consolidating around 110.47. Possibly, the price may form a downside continuation pattern there. The local target is at 109.26.


AUD USD, “Australian Dollar vs US Dollar”

The AUD/USD pair returned to 0.7447. After breaking it upwards, the price may extend this structure towards 0.7510 (an alternative scenario). Later, in our opinion, the market may continue moving downwards to reach 0.7200.


USD RUB, “US Dollar vs Russian Ruble”

The USD/RUB pair I still consolidating without any particular direction. Possibly, the price may choose an alternative scenario and reach 57.00. The main scenario implies that the market may fall towards 55.50.


XAU USD, “Gold vs US Dollar”

Gold has reached the predicted local target. We think, today the price may be corrected to reach 1267. After that, the instrument may grow to extend this wave towards 1286. Later, in our opinion, the market may start another correction with the target at 1260 and then move upwards to reach 1300.


BRENT

Brent has finished the first ascending impulse. Possibly, today the price may fall towards 49.92 and then form the second impulse with the target at 52.20. After that, the instrument may be corrected to reach 51.15 and then grow towards 53.00. All these movements may be considered as the first wave with the target at 53.00.


RoboForex Analytical Department

Article By RoboForex.com

Attention!
Forecasts presented in this section only reflect the author’s private opinion and should not be considered as guidance for trading. RoboForex LP bears no responsibility for trading results based on trading recommendations described in these analytical reviews.


EURUSD: correction on the back of a rise in US bond yields

By Gabriel Ojimadu, Alpari

Previous:

On Friday, trading on the Euro closed up. Before the US labour report was published, our pair was trading at 1.1217 level. After the news, the Euro appreciated to 1.1282.

The US created 138,000 new nonfarm jobs in May against a forecast of 185,000. The value for April was revised downwards from 211,000 to 174,000 and the figure for March was revised from 79,000 to 50,000. The aggregate revision come to -66,000 new jobs.

Unemployment fell to 4.3% (forecast: 4.4%, previous reading: 4.4%). Average hourly earnings grew by 0.2% MoM, which was in line with market expectations. The previous figure has been revised from 0.3% to 0.2%. The participation rate fell from 62.9% to 62.7% last month.

Currency market participants are taking note of how bonds are reacting to the news. US 10Y bond yields have fallen from 2.91% to 2.144% per annum. Still, according to CME Group’s FedWatch, the NFP report hasn’t changed the probability of a rate hike in June, which remains 94.6%. Low unemployment won’t stop the Fed from raising interest rates this month.

Market expectations:

On Friday, the news helped the Euro renew its maximum against the greenback. Euro bulls managed to push the 26th of May’s maximum of 1.1268 to 1.1285. In Asia, US bond yields are trading up by 0.56%. The Euro/dollar has corrected to 1.1262. I’m expecting to see this correction extend to the balance line lb at 1.1240. Buyers have nothing to fear at the moment. As long as the price is above 1.12, they will be active on the market.

From the news coming out of Europe, it’s worth taking note of the UK’s services PMI figures. The UK PMI indices have a strong influence on the GBP/USD and EUR/GBP pairs, so it’s probably better not to make any trading decisions until these reports come out later today.

Day’s news (GM+3):

  • 10:55 Germany: Markit services PMI (May);
  • 11:00 Eurozone: Markit services PMI (May);
  • 11:30 UK: Markit services PMI (May);
  • 15:30 USA: nonfarm productivity (Q1), unit labour costs (Q1);
  • 16:45 USA: Markit services PMI (May);
  • 17:00 USA: ISM non-manufacturing PMI (May), factory orders (Apr), labour market conditions index (May).

EURUSD rate on the hourly. Source: TradingView

Intraday forecast: low: 1.1238, high: 1.1283, close: 1.1256.

Developments in the news have pushed the Euro up by 67 degrees. Considering the payrolls, the Euro’s jump of 77 pips or 0.69% isn’t particularly big. On the news of weak data, Euro bulls could have driven the exchange rate up to 1.1335 level, but this didn’t happen. The upcoming British parliamentary elections as well as futures options for June set to expire on the 9th are limiting bullish activity.

The single currency is still on the bullish trend started at 1.0569, but after Friday’s payrolls, I’m expecting to see some correctional movement today. If the rate doesn’t fall below 1.1250 and closes above this level, then on Tuesday we can expect a breakout of 1.13. Should the indicators unload with the trend, the possibility of bearish divergences will disappear, so keep that in mind.

If the day closes at around 1,1235, this will signal an increase in bearish sentiment. Should Friday’s gains be erased, this would point towards a reversal given that this would form a bearish engulfing pattern on the daily timeframe. And now we keep an eye on how the Euro will fall. If sluggish, there will be a buy opportunity at the trend line. If the slide is fast, it’ll be better to take a wait-and-see attitude and not rush into anything.

Technical trading: Much ado about nothing or the secret is in the science?

By Adinah Brown

I know that you have seen the advertisements. In fact, it’s these types of outrageous claims that bring new people into trading. The ones that say “I made $200 an hour from my home with this simple trick” or something like that.

Ultimately, it will provide you with a link to a technical trading system, or a social trading service that uses some sort of amazing technology to beat the market and make millions. With dreams of wealth flashing through your head and the knowledge that people can and do make wonderful money through trading, you desperately want to believe that it will work for you.

But is it a scam? And how can you tell?

Since most of these systems work by automated algorithms, it relies on the principles of technical trading. At the core of this issue is a pointed question that strikes at the very core of trading ideas – does technical trading actually work?

Broadly speaking, technical trading is trading based on market patterns. The technical trader will review historical charts, looking for shapes, patterns, variations and movements to determine how and why a market reacts. They will then identify which indicators gave a reliable prediction of the market direction and apply these indicators to predict the future activity.

At the end you have a system of predictors of market activity, that will allow you to trade with the expectation that the market will respond when the confluence of factors line up.

But, there are a few main issues with technical indicators that make trading with them somewhat concerning.

1. They tell you nothing about the actual value of what is being traded.

2. They are often based on the vicissitudes of trader behaviour and psychology, which is not necessarily something that is the same in all situations and therefore may not be applicable.

3. The trader may not be any good at identifying which of them are pertinent.

4. Some technical indicators or methods/patterns are just plain stupid.

Now all the above points are not as simple as they have been made to appear, and there are good arguments either way, but on some level these are legitimate concerns.

At the core of the issues is the main point – technical trading does not look at what is being bought, yet it’s buying that very thing that it is not even looking at. It’s like buying a house without knowing anything about the house, other than other people have bought houses.

Yet, it’s not quite like that. Your intention is to buy a house, knowing that other houses have been bought and with the expectation that this house will increase in value, like the other houses have increased in value.

But it’s also not this either. This approach is the same as buying a house because you have an indicator that shows house prices will go up because the changes in housing values have hit a set of critical factors like the amount of houses sold, the amount of people bidding on houses, the short term increase in housing values moving in an upwards and downwards pattern of increasingly tighter timeframes to a value where the market is expected to make a decision….

So there are few issues at play with technical trading, but one great constant trumps all these factors. Traders believe in technical trading. And because of this, the activities behind technical trading become self fulfilling. You see if enough people trade on an indicator, the market will respond to those trades.

And this is the crux of the reality. Those that don’t believe in technical trading will cite the issues I mentioned above, and they will be right, sort of. But they are ignoring the other truth of the market, that markets react based on trades. And therefore, those things that traders use to trade are relevant.

And traders use technical indicators. So technical indicators become relevant, and will move the market if enough traders use them.

That doesn’t necessarily mean that a technical trading tool advertising that it makes $200 a day will do that. But that is a discussion for another time. For now, you can at least have the comfort of knowing that it very well could.

About the Author:

Adinah Brown is a professional writer who has worked in a wide range of industry settings, including corporate industry, government and non-government organizations. Within many of these positions, Adinah has provided skilled marketing and advertising services and is currently the Content Manager at Leverate.