Author Archive for InvestMacro – Page 551

FX Speculators cut US Dollar bets for 2nd week, to lowest since Sept


By CountingPips.comGet our weekly COT Reports by Email

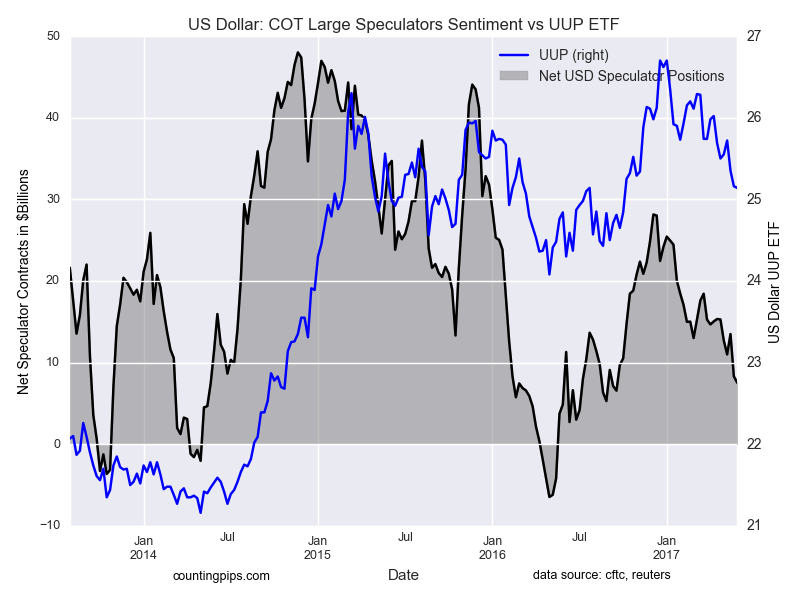
US Dollar net speculator positions declined to $7.53 billion last week

The latest data for the weekly Commitment of Traders (COT) report, released by the Commodity Futures Trading Commission (CFTC) on Friday, showed that large traders and currency speculators reduced their bullish bets for the US dollar last week to the lowest level since September 2016.

Non-commercial large futures traders, including hedge funds and large speculators, had an overall US dollar long position totaling $7.53 billion as of Tuesday May 30th, according to the latest data from the CFTC and dollar amount calculations by Reuters. This was a weekly decline of $-0.79 billion from the $8.32 billion total long position that was registered the previous week, according to the Reuters calculation (totals of the US dollar contracts against the combined contracts of the euro, British pound, Japanese yen, Australian dollar, Canadian dollar and the Swiss franc).

The aggregate speculative positions have now fallen for five out of the past six weeks and to the lowest level since September 20th when positions stood at $6.56 billion.
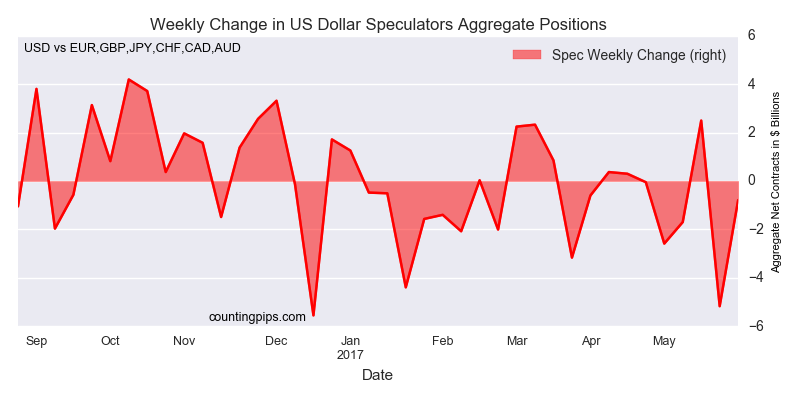
 

Weekly Speculator Contract Changes:

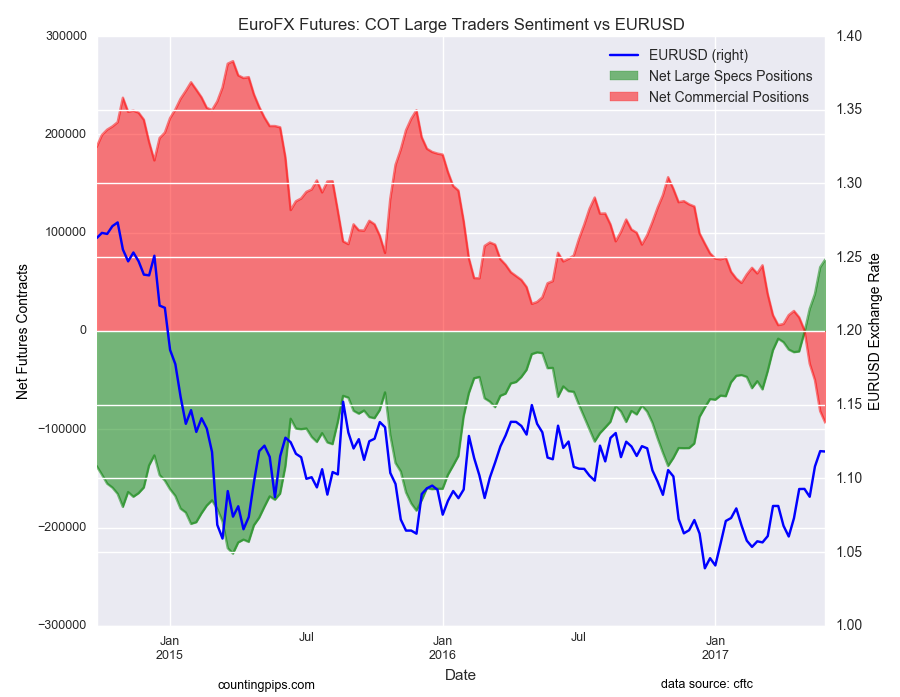
The major currencies that improved against the US dollar last week were the euro (8,024 weekly change in contracts), Swiss franc (1,273 contracts), Canadian dollar (922 contracts), Australian dollar (432 contracts), New Zealand dollar (1,184 contracts) and the Mexican peso (20,704 contracts).

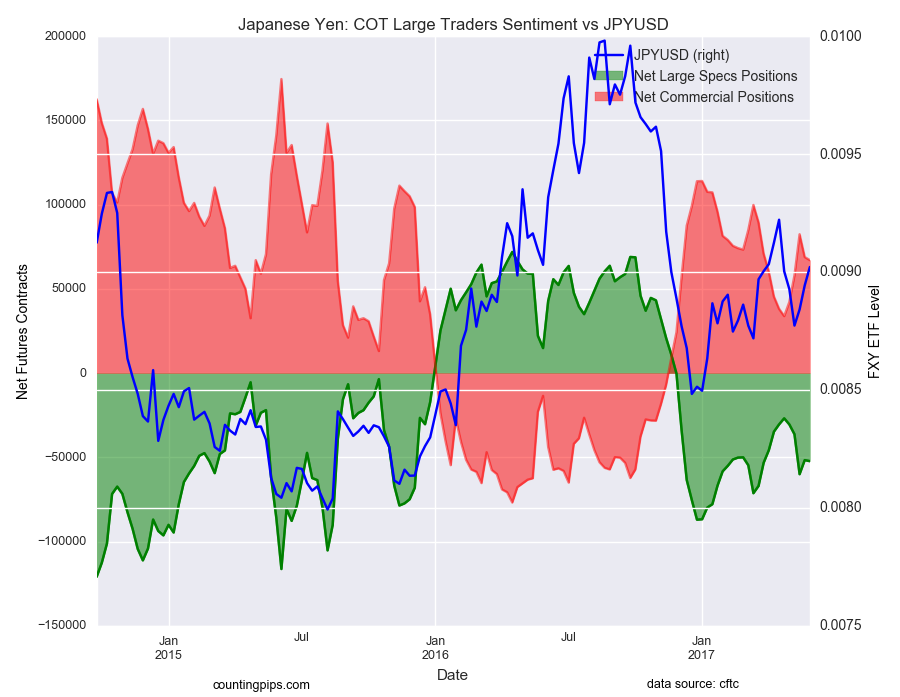
The currencies whose speculative bets declined last week versus the dollar were the British pound sterling (-5,784 contracts) and the Japanese yen (-619 contracts).


Table of Weekly Commercial Traders and Speculators Levels & Changes:

CurrencyNet CommercialsComms Weekly ChgNet SpeculatorsSpecs Weekly Chg
EuroFx-93640-12070728698024
GBP3346510986-29651-5784
JPY67024-1813-52275-619
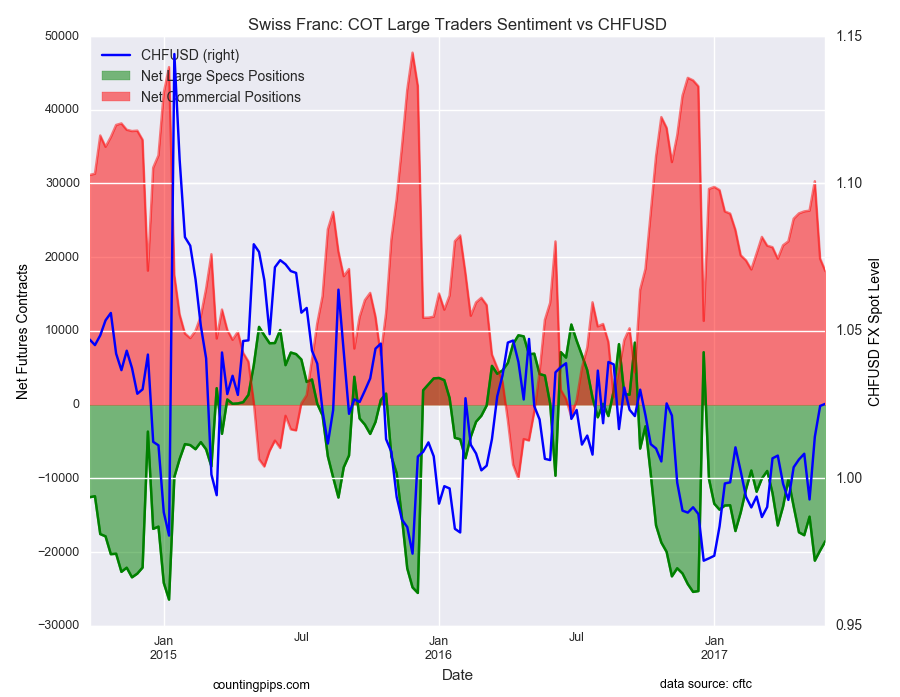
CHF18107-1701-185121273
CAD109374-2730-98187922
AUD7282-12333067432
NZD13108-1119-107861184
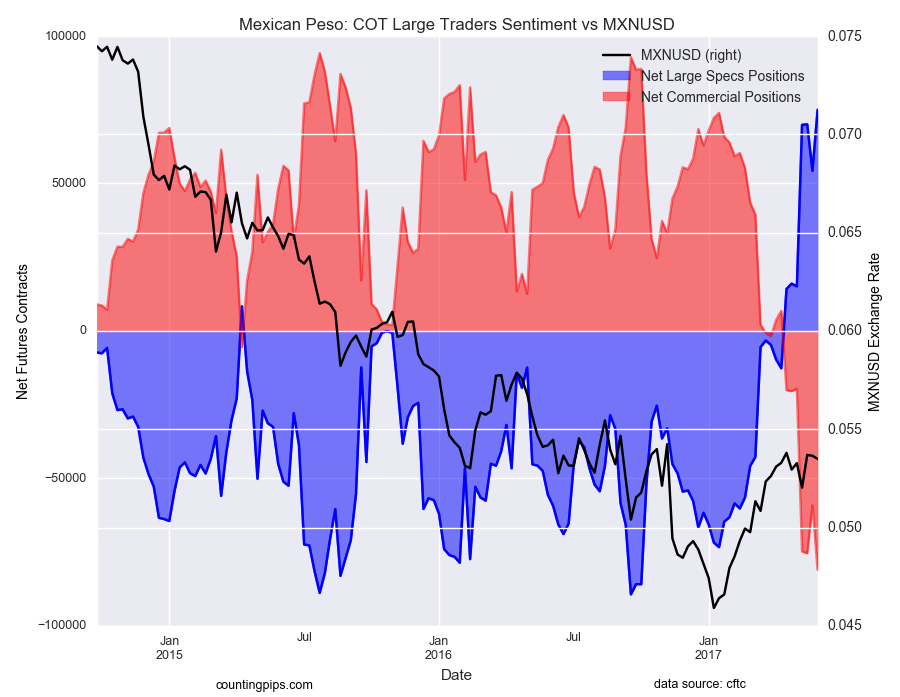
MXN-80987-217827500220704


This latest COT data is through Tuesday and shows a quick view of how large speculators or non-commercials (for-profit traders) as well as the commercial traders (hedgers & traders for business purposes) were positioned in the futures markets. All currency positions are in direct relation to the US dollar where, for example, a bet for the euro is a bet that the euro will rise versus the dollar while a bet against the euro will be a bet that the dollar will gain versus the euro.

Weekly Charts: Large Trader Weekly Positions vs Price

EuroFX:
 

British Pound Sterling:


Japanese Yen:
 

Swiss Franc:
 

Canadian Dollar:


Australian Dollar:


New Zealand Dollar:


Mexican Peso:
*COT Report: The weekly commitment of traders report summarizes the total trader positions for open contracts in the futures trading markets. The CFTC categorizes trader positions according to commercial hedgers (traders who use futures contracts for hedging as part of the business), non-commercials (large traders who speculate to realize trading profits) and nonreportable traders (usually small traders/speculators). Find CFTC criteria here: (http://www.cftc.gov/MarketReports/CommitmentsofTraders/ExplanatoryNotes/index.htm).

The Commitment of Traders report is published every Friday by the Commodity Futures Trading Commission (CFTC) and shows futures positions data that was reported as of the previous Tuesday (3 days behind).

Each currency contract is a quote for that currency directly against the U.S. dollar, a net short amount of contracts means that more speculators are betting that currency to fall against the dollar and a net long position expect that currency to rise versus the dollar.

(The charts overlay the forex closing price of each Tuesday when COT trader positions are reported for each corresponding spot currency pair.) See more information and explanation on the weekly COT report from the CFTC website.

Article by CountingPips.com


COT Report: US Dollar bets down again, Gold & Silver bets rise for 2nd week

By CountingPips.com

Here is a short summary and this week’s links (below) to the latest Commitment of Traders changes.

– Speculators reduced bullish bets for the US dollar to a new low since September as USD bets have fallen 5 out of the last 6 weeks

WTI crude oil speculators slightly edged bets higher last week

– The 10-year note speculators sharply decreased bullish bets after rising for 3 straight weeks

Gold speculative bets went higher for a 2nd week and by over +40,000 contracts in 2 weeks

Silver bets rose again for 2nd week after declining for 5 straight weeks

Copper speculative bets fell for 1st time in 3 weeks and back under the +10,000 level

– Large S&P500 speculative bets slid for 4th out of the last 5 weeks, to lowest since 2012


FX Speculators cut US Dollar bets for 2nd week, to lowest since Sept

US Dollar net speculator positions leveled at $7.53 billion last week

The latest data for the weekly Commitment of Traders (COT) report, released by the Commodity Futures Trading Commission (CFTC) on Friday, showed that large traders and currency speculators reduced their bullish bets for the US dollar last week to the lowest level since September 2016. See full article


WTI Crude Oil Speculators net bullish positions virtually unchanged last week

The non-commercial contracts of WTI crude futures totaled a net position of 373,755 contracts, according to data from last week. This was an advance of 766 contracts from the previous weekly total. See full article


Gold Speculators increased net bullish positions to highest in 4 weeks

The large speculator contracts of gold futures advanced to a total net position of 167,090 contracts. This was a weekly rise of 7,323 contracts from the previous week. See full article


10 Year Treasury Note Speculators sharply cut back on net positions last week

The large speculator contracts of 10-year treasury note futures totaled a net position of 258,165 contracts. This was a weekly drop of -104,336 contracts from the previous week. See full article


Large S&P500 Speculators reduced bullish net positions for 2nd week

The large speculator contracts of S&P 500 futures totaled a net position of -8,085 contracts. This was a decrease of -1,499 contracts from the reported data of the previous week. See full article


Silver Speculator bullish positions rose again last week

The non-commercial contracts of silver futures totaled a net position of 61,414 contracts, according to data from last week. This was a weekly gain of 10,241 contracts from the previous totals. See full article


Copper Speculators decreased bullish net positions after 2 weeks of gains

The large speculator contracts of copper futures totaled a net position of 9,644 contracts. This was a weekly fall of -3,387 contracts from the data of the previous week. See full article


Article by CountingPips.com

The Commitment of Traders report data is published in raw form every Friday by the Commodity Futures Trading Commission (CFTC) and shows the futures positions of market participants as of the previous Tuesday (data is reported 3 days behind).

To learn more about this data please visit the CFTC website at http://www.cftc.gov/MarketReports/CommitmentsofTraders/index.htm


WTI Crude Oil Speculators net bullish positions virtually unchanged last week

By CountingPips.comGet our weekly COT Reports by Email

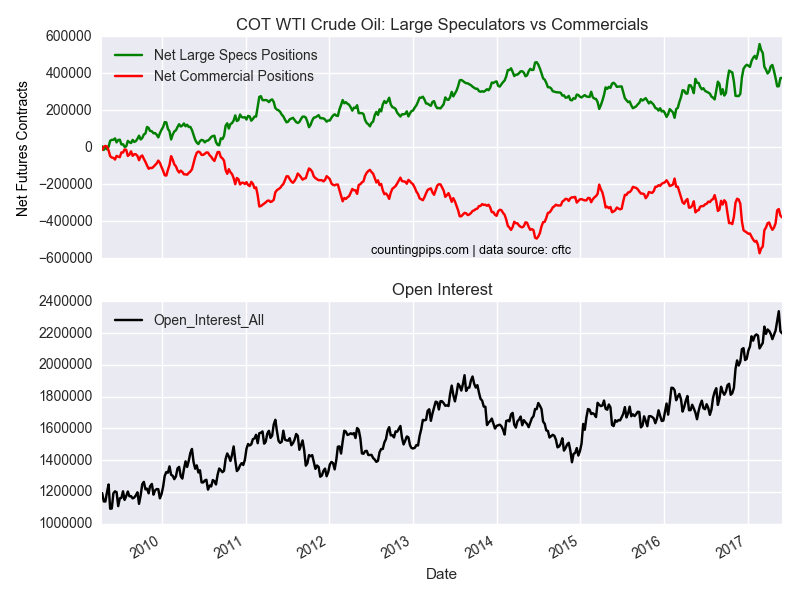
WTI Crude Oil Non-Commercial Positions:

Large speculator bullish net positions in the WTI crude oil futures markets came in virtually unchanged this week following a large gain on May 23rd, according to the latest Commitment of Traders (COT) data released by the Commodity Futures Trading Commission (CFTC) on Friday.

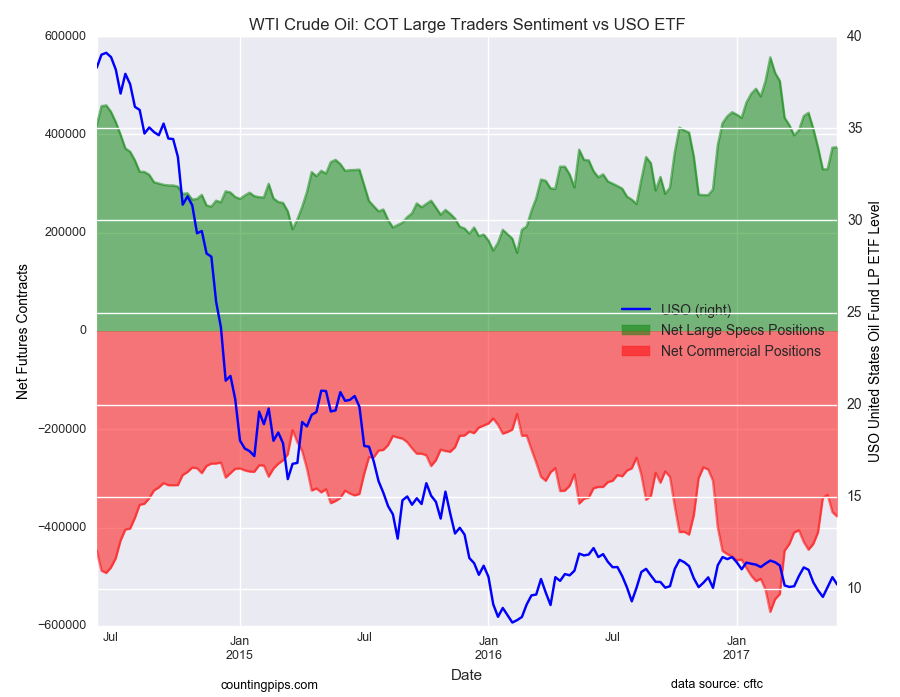
The non-commercial contracts of WTI crude futures, traded by large speculators and hedge funds, totaled a net position of 373,755 contracts in the data reported through May 30th. This was a weekly edge higher by 766 contracts from the previous week which had a total of 372,989 net contracts.

This week’s small gain follows a +44,037 contract jump the previous week and now positions are at their highest level since April 25th when positions totaled +411,822 contracts.

WTI Crude Oil Commercial Positions:

The commercial traders position, categorized by the CFTC as hedgers or traders engaged in buying and selling for business purposes, totaled a net position of -377,765 contracts this week. This was a weekly decrease of -9,214 contracts from the total net of -368,551 contracts reported the previous week.

USO Crude Oil ETF:

Over the same weekly reporting time-frame, from Tuesday to Tuesday, the USO Crude Oil ETF, which tracks the price of WTI crude oil, closed at approximately $10.24 which was a slide of $-0.40 from the previous close of $10.64, according to ETF market data.

*COT Report: The COT data, released weekly to the public each Friday, is updated through the previous Tuesday (data is 3 days old) and shows a quick view of how large speculators or non-commercials (for-profit traders) as well as the commercial traders (hedgers & traders for business purposes) were positioned in the futures markets. The CFTC categorizes trader positions according to commercial hedgers (traders who use futures contracts for hedging as part of the business), non-commercials (large traders who speculate to realize trading profits) and nonreportable traders (usually small traders/speculators). Find CFTC criteria here: (http://www.cftc.gov/MarketReports/CommitmentsofTraders/ExplanatoryNotes/index.htm).

Article by CountingPips.com


Gold Speculators increased net bullish positions to highest in 4 weeks

By CountingPips.comGet our weekly COT Reports by Email

Gold Non-Commercial Positions:

Large speculators increased their bullish net positions in the gold futures markets this week for a second straight week, according to the latest Commitment of Traders (COT) data released by the Commodity Futures Trading Commission (CFTC) on Friday.

The non-commercial futures contracts of Comex gold futures, traded by large speculators and hedge funds, totaled a net position of 167,090 contracts in the data reported through May 30th. This was a weekly gain of 7,323 contracts from the previous week which had a total of 159,767 net contracts.

Gold positions have rebounded sharply over the past two weeks following a three week decline. Positions are now at their highest level since May 2nd and have risen by over +40,000 contracts in the last two weeks.

Gold Commercial Positions:

Meanwhile, the commercial traders position, categorized by the CFTC as hedgers or traders engaged in buying and selling for business purposes, totaled a net position of -183,219 contracts this week. This was a weekly decrease of -8,928 contracts from the total net of -174,291 contracts reported the previous week.

Gold ETF:

Over the same weekly reporting time-frame, from Tuesday to Tuesday, the GLD ETF, which tracks the price of gold, closed at approximately $120.14 which was an increase of $1.00 from the previous close of $119.14, according to ETF financial market data.

*COT Report: The COT data, released weekly to the public each Friday, is updated through the previous Tuesday (data is 3 days old) and shows a quick view of how large speculators or non-commercials (for-profit traders) as well as the commercial traders (hedgers & traders for business purposes) were positioned in the futures markets. The CFTC categorizes trader positions according to commercial hedgers (traders who use futures contracts for hedging as part of the business), non-commercials (large traders who speculate to realize trading profits) and nonreportable traders (usually small traders/speculators). Find CFTC criteria here: (http://www.cftc.gov/MarketReports/CommitmentsofTraders/ExplanatoryNotes/index.htm).

Article by CountingPips.com


10 Year Treasury Note Speculators sharply cut back on net positions last week

By CountingPips.comGet our weekly COT Reports by Email

10 Year Treasury Note Non-Commercial Positions:

Large speculators pulled back sharply from their highest bullish position since 2007 this week in the 10-year treasury note futures markets, according to the latest Commitment of Traders (COT) data released by the Commodity Futures Trading Commission (CFTC) on Friday.

The non-commercial futures contracts of 10-year treasury note futures, traded by large speculators and hedge funds, totaled a net position of 258,165 contracts in the data reported through May 30th. This was a weekly decline of -104,336 contracts from the previous week which had a total of 362,501 net contracts.

Ten year note speculative positions had raced from an overall net short position just seven weeks ago to the highest bullish position since 2007 on May 23rd at +362,501 contracts before this week’s sharp pullback.

10 Year Treasury Note Commercial Positions:

The commercial traders position, categorized by the CFTC as hedgers or traders engaged in buying and selling for business purposes, totaled a net position of -90,113 contracts this week. This is a weekly jump of 95,378 contracts from the total net of -185,491 contracts reported the previous week.

IEF 7-10 Year Bond ETF:

Over the same weekly reporting time-frame, from Tuesday to Tuesday, the 7-10 Year Treasury Bond ETF (IEF) closed at approximately $107.27 which was a change of $0.62 from the previous close of $106.65, according to ETF market data.

*COT Report: The COT data, released weekly to the public each Friday, is updated through the previous Tuesday (data is 3 days old) and shows a quick view of how large speculators or non-commercials (for-profit traders) as well as the commercial traders (hedgers & traders for business purposes) were positioned in the futures markets. The CFTC categorizes trader positions according to commercial hedgers (traders who use futures contracts for hedging as part of the business), non-commercials (large traders who speculate to realize trading profits) and nonreportable traders (usually small traders/speculators). Find CFTC criteria here: (http://www.cftc.gov/MarketReports/CommitmentsofTraders/ExplanatoryNotes/index.htm).

Article by CountingPips.com


Silver Speculator bullish positions rose again last week

By CountingPips.comGet our weekly COT Reports by Email

Silver Non-Commercial Positions:

Large speculators and traders sharply increased their bullish net positions in the silver futures markets for a second consecutive week this week, according to the latest Commitment of Traders (COT) data released by the Commodity Futures Trading Commission (CFTC) on Friday.

The non-commercial futures contracts of Comex silver futures, traded by large speculators and hedge funds, totaled a net position of 61,414 contracts in the data reported through May 30th. This was a weekly gain of 10,241 contracts from the previous week which had a total of 51,173 net contracts.

Silver positions have now rebounded strongly in the past two weeks with a combined increase of over +18,000 contracts. This precious metal had declined over the previous five weeks and by a total of over -60,000 contracts.

Silver Commercial Positions:

The commercial traders position, categorized by the CFTC as hedgers or traders engaged in buying and selling for business purposes, totaled a net position of -71,082 contracts this week. This is a weekly decline of -7,095 contracts from the total net of -63,987 contracts reported the previous week.

Silver ETF:

Over the same weekly reporting time-frame, from Tuesday to Tuesday, the SLV ishares ETF, which tracks the price of silver, closed at approximately $16.47 which was a rise of $0.32 from the previous close of $16.15, according to ETF financial market data.

*COT Report: The weekly commitment of traders report summarizes the total trader positions for open contracts in the futures trading markets. The CFTC categorizes trader positions according to commercial hedgers (traders who use futures contracts for hedging as part of the business), non-commercials (large traders who speculate to realize trading profits) and nonreportable traders (usually small traders/speculators). Find CFTC criteria here: (http://www.cftc.gov/MarketReports/CommitmentsofTraders/ExplanatoryNotes/index.htm).

Article by CountingPips.com


Large S&P500 Speculators reduced bullish net positions for 2nd week

By CountingPips.comGet our weekly COT Reports by Email

S&P500 Non-Commercial Positions:

Large stock market speculators decreased their positions in the S&P500 futures market for a second consecutive week this week, according to the latest Commitment of Traders (COT) data released by the Commodity Futures Trading Commission (CFTC) on Friday.

The non-commercial futures contracts of S&P500 futures, traded by large speculators and hedge funds, totaled a net position of -8,085 contracts in the data reported through May 30th. This was a weekly change of -1,499 contracts from the previous week which had a total of -6,586 net contracts.

The current short position of -8,085 contracts is at the most bearish level since March 6th 2012 when net positions totaled -8,949 contracts.

S&P500 Commercial Positions:

The commercial traders position, categorized by the CFTC as hedgers or traders engaged in buying and selling for business purposes, totaled a net position of 10,979 contracts on the week. This was a weekly rise of 1,661 contracts from the total net of 9,318 contracts reported the previous week.

S&P500 Stock Market Index:

Over the same weekly reporting time-frame, from Tuesday to Tuesday, the S&P500 index closed at approximately 241.5 which was an advance of 1.45 from the previous close of 240.05, according to market data.

*COT Report: The COT data, released weekly to the public each Friday, is updated through the previous Tuesday (data is 3 days old) and shows a quick view of how large speculators or non-commercials (for-profit traders) as well as the commercial traders (hedgers & traders for business purposes) were positioned in the futures markets. The CFTC categorizes trader positions according to commercial hedgers (traders who use futures contracts for hedging as part of the business), non-commercials (large traders who speculate to realize trading profits) and nonreportable traders (usually small traders/speculators). Find CFTC criteria here: (http://www.cftc.gov/MarketReports/CommitmentsofTraders/ExplanatoryNotes/index.htm).

Article by CountingPips.com


Copper Speculators decreased bullish net positions after 2 weeks of gains

By CountingPips.comGet our weekly COT Reports by Email

Copper Non-Commercial Positions:

Large speculators and traders decreased their bullish net positions in the copper futures markets this week, according to the latest Commitment of Traders (COT) data released by the Commodity Futures Trading Commission (CFTC) on Friday.

The non-commercial futures contracts of copper futures, traded by large speculators and hedge funds, totaled a net position of 9,644 contracts in the data reported through May 30th. This was a weekly decrease of -3,387 contracts from the previous week which had a total of 13,031 net contracts.

Copper positions had risen the two previous weeks but this week’s decline brought net positions under the +10,000 position level for the third time in four weeks.

Copper Commercial Positions:

The commercial traders position, categorized by the CFTC as hedgers or traders engaged in buying and selling for business purposes, totaled a net position of -9,563 contracts on the week. This is a weekly gain of 1,166 contracts from the total net of -10,729 contracts reported the previous week.

Copper ETN:

Over the same weekly reporting time-frame, from Tuesday to Tuesday, the JJC iPath Bloomber Copper ETN, which tracks the price of copper, closed at approximately $29.08 which was a delcine of $-0.39 from the previous close of $29.47, according to financial market data.

*COT Report: The COT data, released weekly to the public each Friday, is updated through the previous Tuesday (data is 3 days old) and shows a quick view of how large speculators or non-commercials (for-profit traders) as well as the commercial traders (hedgers & traders for business purposes) were positioned in the futures markets. The CFTC categorizes trader positions according to commercial hedgers (traders who use futures contracts for hedging as part of the business), non-commercials (large traders who speculate to realize trading profits) and nonreportable traders (usually small traders/speculators). Find CFTC criteria here: (http://www.cftc.gov/MarketReports/CommitmentsofTraders/ExplanatoryNotes/index.htm).

Article by CountingPips.com


Can a Chart Pattern Help You Catch a Strong Bond Rally? Yes.

Plus, find out about a dangerous flaw in a “buy-and-hold” stock market strategy

By Elliott Wave International

The Elliott wave model has helped investors catch market turns for eight decades.

As Frost & Prechter’s Wall Street classic book, Elliott Wave Principle, says:

The Wave Principle is the best forecasting tool in existence. [It] imparts an immense amount of knowledge about the market’s position … and its probable ensuing path.

Of course, the proof is in the pudding.

Or, in this case, the bond market.

Elliott Wave International recently applied their knowledge of Elliott wave price patterns to the bond market, and the forecast they shared with their subscribers turned out to be … well, you be the judge.

Let’s start with this chart and commentary from Prechter’s March 2017 Elliott Wave Theorist:

As shown in the chart above, the consolidation in bond futures prices from December through February took the shape of a triangle, a formation that typically appears in the wave four position within an impulse. So, this month’s new low in bond prices is likely occurring within a fifth wave from last year’s high, suggesting that a substantial rally should develop this spring.

The Elliott Wave Theorist published March 17, and its forecast for a “substantial rally” proved timely: The 30-year U.S. T-Bond price low of 145^26.0 registered on March 14, and since then, long-bond prices have indeed moved northward.

You can see this rally [entire wave labeling available to subscribers] in the 30-year U.S. T-Bond in Elliott Wave International’s May 22 Short Term Update chart:

As you can see, the price rallied to a high of 155^16.0 on April 18 — a 6% advance in a month! Recently, after a short retreat, the climb resumed.

Before concluding, let’s briefly shift focus to the stock market — specifically, the claimed average gain of 7.228% during the past 116 years that investors have allegedly been making annually.

“Buy and hold” proponents often point to that annual gain figure. Problem is, in reality, investors pocket substantially less — and that has direct implications for your portfolio.

In fact, once you review the 3-page, eye-opening section in the March Elliott Wave Theorist, which includes 4 tables and a large graph, you’ll learn just “how difficult it has been to earn any real return in the market.”

Here’s the good news: You can read the entire 10-page March 2017 Elliott Wave Theorist 100% FREE — but only for a limited-time. Read below for details.


Get a free issue of market legend Robert Prechter’s Elliott Wave Theorist now

Read this eye-opening issue now and you’ll get a clear picture of what’s next for stocks, bonds and oil and more to help you jump on opportunities and sidestep risk. This free issue (a $29 value) will show you Prechter’s unique outlook and give you a new perspective on the markets you won’t get anywhere else.

Download your FREE issue from Robert Prechter now — for a limited time.

This article was syndicated by Elliott Wave International and was originally published under the headline . EWI is the world’s largest market forecasting firm. Its staff of full-time analysts led by Chartered Market Technician Robert Prechter provides 24-hour-a-day market analysis to institutional and private investors around the world.

Fibonacci Retracements Analysis 02.06.2017 (EUR/USD, EUR/GBP)

Article By RoboForex.com

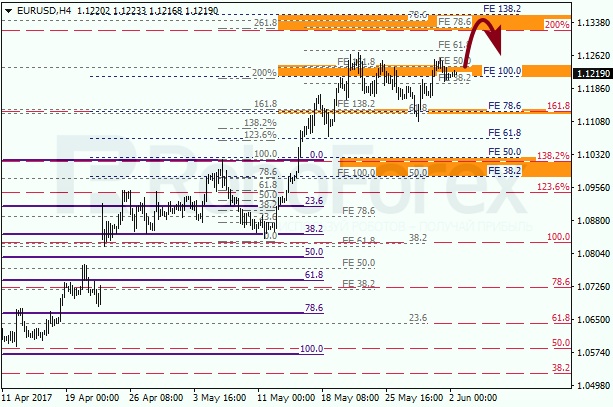
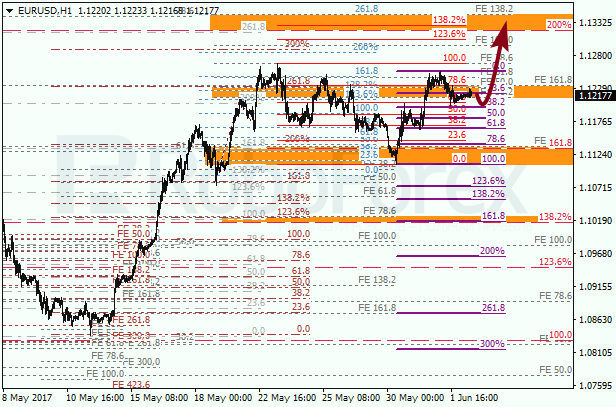
EUR USD, “Euro vs US Dollar”

The EUR/USD pair is still trading close to the group of fibo-levels at 1.1240 – 1.1220. If the price rebounds from this area, the market may resume moving upwards. The closest target for bulls is the area at 1.1350 – 1.1320.

At the H1 chart, the pair may test the correctional retracement of 38.2% at 1.1200. If the price rebounds from this level, the market may continue growing and break local highs.


EUR GBP, “Euro vs Great Britain Pound”

The EUR/GBP pair is trying to fix above the area at 0.8710 – 0.8685. The closest target is the group of fibo-levels at 0.8790 – 0.8770. If later the price rebounds from these levels, the market may start a new local correction.

As we can see at the H1 chart, the pair rebounded from the local retracement of 61.8% at 0.8657. Possibly, on Friday the price may break the local high. However, if the pair rebounds from its upside targets, the market may start a new bearish correction.


RoboForex Analytical Department

Article By RoboForex.com

Attention!
Forecasts presented in this section only reflect the author’s private opinion and should not be considered as guidance for trading. RoboForex LP bears no responsibility for trading results based on trading recommendations described in these analytical reviews.