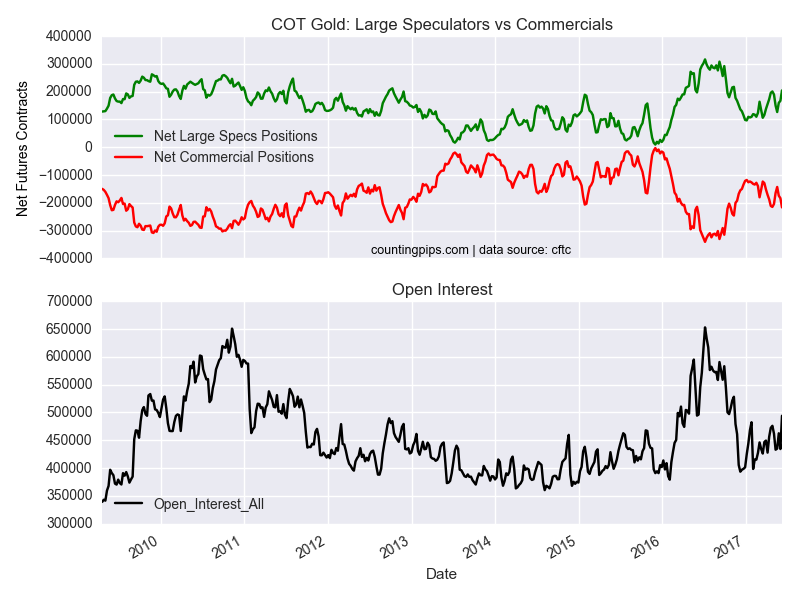
Large speculators boosted their bullish net positions in the gold futures markets last week for a third consecutive week, according to the latest Commitment of Traders (COT) data released by the Commodity Futures Trading Commission (CFTC) on Friday.
The non-commercial futures contracts of Comex gold futures, traded by large speculators and hedge funds, totaled a net position of 204,465 contracts in the data reported through June 6th. This was a weekly rise of 37,375 contracts from the previous week which had a total of 167,090 net contracts.
The strong gains (+77,741 contracts total) of the past three weeks has put the overall net position above the +200,000 level for the first time since April 25th when net positions totaled 200,677 contracts.
Gold Commercial Positions:
The commercial traders position, categorized by the CFTC as hedgers or traders engaged in buying and selling for business purposes, totaled a net position of -216,354 contracts last week. This was a drop of -33,135 contracts from the total net of -183,219 contracts reported the previous week.
Gold ETF:
Over the same weekly reporting time-frame, from Tuesday to Tuesday, the GLD ETF, which tracks the price of gold, closed at approximately $123.10 which was a gain of $2.96 from the previous close of $120.14, according to ETF financial market data.
*COT Report: The COT data, released weekly to the public each Friday, is updated through the previous Tuesday (data is 3 days old) and shows a quick view of how large speculators or non-commercials (for-profit traders) as well as the commercial traders (hedgers & traders for business purposes) were positioned in the futures markets. The CFTC categorizes trader positions according to commercial hedgers (traders who use futures contracts for hedging as part of the business), non-commercials (large traders who speculate to realize trading profits) and nonreportable traders (usually small traders/speculators). Find CFTC criteria here: (http://www.cftc.gov/MarketReports/CommitmentsofTraders/ExplanatoryNotes/index.htm).
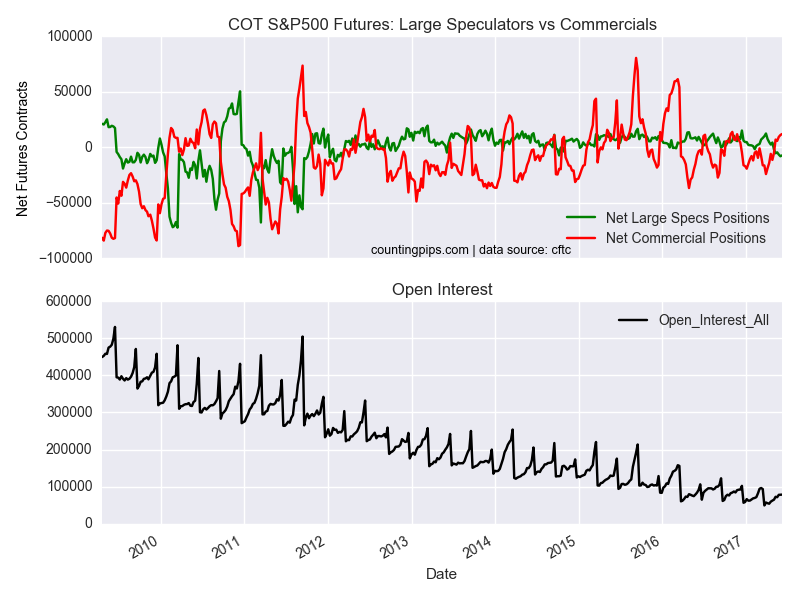
Large speculators slightly increased their bets in favor of the S&P500 stock futures markets last week, according to the latest Commitment of Traders (COT) data released by the Commodity Futures Trading Commission (CFTC) on Friday.
The non-commercial futures contracts of S&P500 futures, traded by large speculators and hedge funds, totaled a net bearish position of -7,343 contracts in the data reported through June 6th. This was a weekly increase of 742 contracts from the previous week which had a total of -8,085 net contracts.
Large speculator positions had fallen for the previous two weeks and landed at the most bearish overall position since March 6th 2012 when net positions totaled -8,949 contracts before this week’s slight uptick.
S&P500 Commercial Positions:
The commercial traders position, categorized by the CFTC as hedgers or traders engaged in buying and selling for business purposes, totaled a net position of 11,894 contracts last week. This is a weekly gain of 915 contracts from the total net of 10,979 contracts reported the previous week.
S&P500 Stock Market Index:
Over the same weekly reporting time-frame, from Tuesday to Tuesday, the S&P500 index closed at approximately 243.21 which was a rise of 1.71 from the previous close of 241.5, according to market data.
*COT Report: The COT data, released weekly to the public each Friday, is updated through the previous Tuesday (data is 3 days old) and shows a quick view of how large speculators or non-commercials (for-profit traders) as well as the commercial traders (hedgers & traders for business purposes) were positioned in the futures markets. The CFTC categorizes trader positions according to commercial hedgers (traders who use futures contracts for hedging as part of the business), non-commercials (large traders who speculate to realize trading profits) and nonreportable traders (usually small traders/speculators). Find CFTC criteria here: (http://www.cftc.gov/MarketReports/CommitmentsofTraders/ExplanatoryNotes/index.htm).
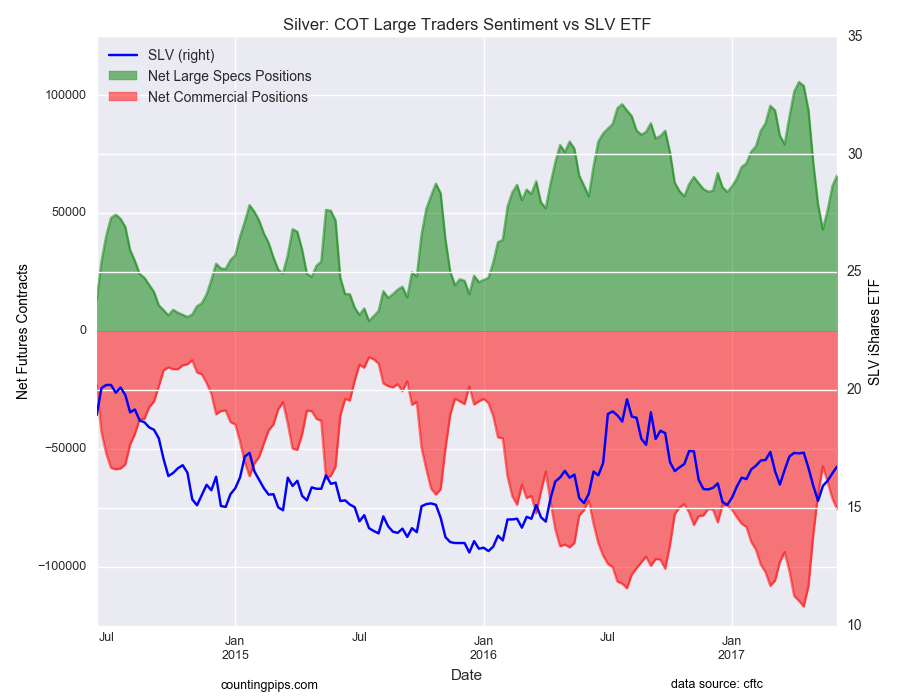
Large speculators increased their bullish net positions for a third straight week in the silver futures markets last week, according to the latest Commitment of Traders (COT) data released by the Commodity Futures Trading Commission (CFTC) on Friday.
The non-commercial futures contracts of Comex silver futures, traded by large speculators and hedge funds, totaled a net position of 65,941 contracts in the data reported through June 6th. This was a weekly rise of 4,527 contracts from the previous week which had a total of 61,414 net contracts.
Speculator positions, having risen by over 22,937 contract in the past three weeks, are now at the highest net position since May 2nd when net positions totaled +71,367 contracts .
Silver Commercial Positions:
The commercial traders position, categorized by the CFTC as hedgers or traders engaged in buying and selling for business purposes, totaled a net position of -75,624 contracts last week. This is a weekly decline of -4,542 contracts from the total net of -71,082 contracts reported the previous week.
Silver ETF:
Over the same weekly reporting time-frame, from Tuesday to Tuesday, the SLV ishares ETF, which tracks the price of silver, closed at approximately $16.76 which was an increase of $0.29 from the previous close of $16.47, according to ETF financial market data.
*COT Report: The weekly commitment of traders report summarizes the total trader positions for open contracts in the futures trading markets. The CFTC categorizes trader positions according to commercial hedgers (traders who use futures contracts for hedging as part of the business), non-commercials (large traders who speculate to realize trading profits) and nonreportable traders (usually small traders/speculators). Find CFTC criteria here: (http://www.cftc.gov/MarketReports/CommitmentsofTraders/ExplanatoryNotes/index.htm).
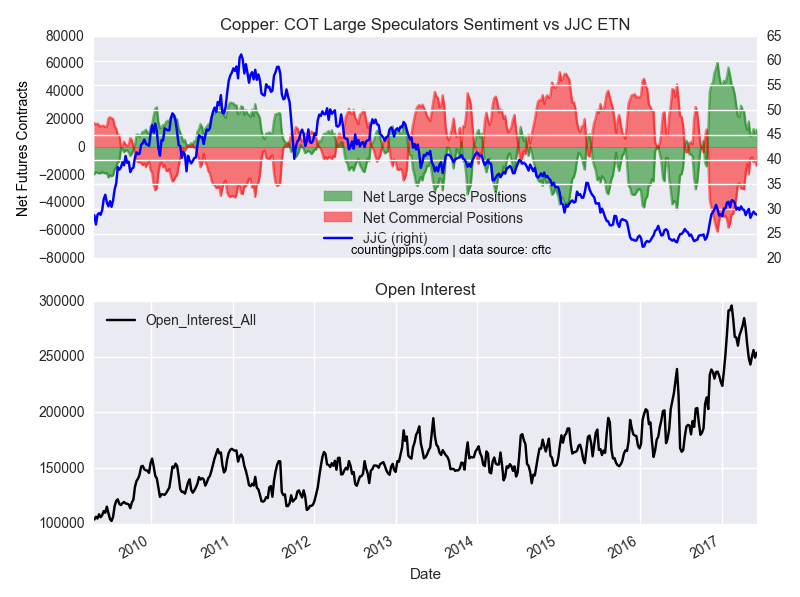
Large speculators increased their net bullish positions in the copper futures markets last week as sentiment for the metal has improved in recent weeks, according to the latest Commitment of Traders (COT) data released by the Commodity Futures Trading Commission (CFTC) on Friday.
The non-commercial futures contracts of copper futures, traded by large speculators and hedge funds, totaled a net position of 12,726 contracts in the data reported through June 6th. This was a weekly gain of 3,082 contracts from the previous week which had a total of 9,644 net contracts.
Copper speculators have now pushed their bullish bets higher for three out of the past four weeks. Positions had been on a consistent downtrend in recent months and bullish positions had fallen to the lowest level of the year on May 9th at 8,081 net contracts.
Copper Commercial Positions:
The commercial traders position, categorized by the CFTC as hedgers or traders engaged in buying and selling for business purposes, totaled a net position of -13,326 contracts last week. This was a weekly decline of -3,763 contracts from the total net of -9,563 contracts reported the previous week.
Copper ETN:
Over the same weekly reporting time-frame, from Tuesday to Tuesday, the JJC iPath Bloomber Copper ETN, which tracks the price of copper, closed at approximately $28.87 which was a edge lower of $-0.21 from the previous close of $29.08, according to financial market data.
*COT Report: The COT data, released weekly to the public each Friday, is updated through the previous Tuesday (data is 3 days old) and shows a quick view of how large speculators or non-commercials (for-profit traders) as well as the commercial traders (hedgers & traders for business purposes) were positioned in the futures markets. The CFTC categorizes trader positions according to commercial hedgers (traders who use futures contracts for hedging as part of the business), non-commercials (large traders who speculate to realize trading profits) and nonreportable traders (usually small traders/speculators). Find CFTC criteria here: (http://www.cftc.gov/MarketReports/CommitmentsofTraders/ExplanatoryNotes/index.htm).
The GBP/USD pair is under significant pressure on Friday influenced by parliamentary elections in the United Kingdom.
At the end of the week, the British Pound was shocked. Even before that, the results of preliminary surveys indicated that the difference between supporters of Conservative and Labor parties was very critical, but few people thought that the real results of parliamentary elections might turn out to be so troubled. The current quote for the GBP/USD pair is 1.2734 as the instrument has lost two figures since the moment the trading session opened.
So, according to exit polls, the Conservative Party of the United Kingdom, which is led by Theresa May, will have more seats in the Parliament, but not enough for the absolute majority. The party lacks about 12 seats, and its current results are worse than they were on Monday. These parliamentary elections were early, according to the schedule they were to be held in two years, but the Council of Ministers required the absolute majority in order to enforce decisions relating to the Brexit without any complications. It appears that right now they have even more problems than in the past.
In April, when it became known about the necessity of holding early parliamentary elections, investors thought that the Conservative Party was right to risk it all, because their positions were pretty solid. It continued this way until the middle of May, when the difference between numbers of the parties started to reduce.
The political factor will remain the main one for the Pound in the near future and any bad political news will make the GBP weaken significantly.
The statistics published by the UK today was disappointing and fell through the cracks. The Industrial Production expanded only by 0.2% m/m in April, although it was expected to add 0.7% m/m. On YoY, the numbers are even worse: the indicator lost 0.8%, which is much worse than expected. The Manufacturing Production added the same 0.2% m/m against the expected reading of +0.8% m/m.
Attention! Forecasts presented in this section only reflect the author’s private opinion and should not be considered as guidance for trading. RoboForex LP bears no responsibility for trading results based on trading recommendations described in these analytical reviews.
The EUR/USD pair is consolidating and forming a structure of a continuation pattern at 1.1207. If later the market breaks this consolidation range to the downside, the instrument may reach 1.1130; if to the upside – start another correction with the target at 1.1242.
GBP USD, “Great Britain Pound vs US Dollar”
The GBP/USD pair has reached the target of the fifth descending wave. We think, today the price may extend this structure towards 1.2678. Later, the market may be corrected to return to 1.2894.
USD CHF, “US Dollar vs Swiss Franc”
The USD/CHF pair has completed the ascending wave and right now is consolidating. If later the market breaks this consolidation range to the upside, the instrument may grow to reach 0.9757; if to the downside – start another correction with the target at 0.9646.
USD JPY, “US Dollar vs Japanese Yen”
Being under pressure, the USD/JPY pair is growing. Possibly, the price may test 110.47 form below. After that, the instrument may fall to reach the target of the third wave at 108.87. Later, in our opinion, the market may be corrected towards 110.47.
AUD USD, “Australian Dollar vs US Dollar”
The AUD/USD pair is forming the first descending wave. Possibly, the price may reach 0.7513 and then grow towards 0.7540. Later, in our opinion, the market may break this level to the downside and then continue moving downwards with the target at 0.7460.
USD RUB, “US Dollar vs Russian Ruble”
The USD/RUB pair is trading above 56.50. We think, today the price may grow to reach 57.20. After that, the instrument may fall towards 55.50.
XAU USD, “Gold vs US Dollar”
Gold is trading to rebound from 1281.80 downwards. Possibly, the price may complete the correction at 1267.10. Later, in our opinion, the market may grow towards 1281.76, thus forming another consolidation range. If later the market breaks this consolidation range to the upside, the instrument may move upwards to reach 1320.00; if to the downside – start another decline with the target at 1255.00.
BRENT
Brent is still consolidating near its lows. Possibly, today the price may grow towards 49.48 and then fall to reach 46.60, thus forming another consolidation range. After breaking this consolidation range to the upside, the instrument may grow to reach 51.33.
Attention! Forecasts presented in this section only reflect the author’s private opinion and should not be considered as guidance for trading. RoboForex LP bears no responsibility for trading results based on trading recommendations described in these analytical reviews.
Trading in the market has become incredibly popular over the years, and for good reason. If done properly, trading is a great way to earn money in the market quickly, rather than investing and holding onto stocks for months, years, or even decades. However, trading does take some skill, and one of the most important skills to posses is the ability to time your entries. After all, entering into a trade at the wrong time could lead to smaller profits or worse, losses. Today, we’ll talk about 3 different ways to go about identifying trade entries.
However, before we get into how to identify trade entries, it’s important that you know that trading is always a speculative process and there is always risk involved. While you will have more successful trades with a solid strategy for identifying entries, there is no strategy that’s 100% correct. With that said, let’s get into how to identify trade entries.
Trade Entry Strategy #1: Breakout Trading
In the technical trading world, there is always a trend. The trend includes a support point, a resistance point, and a spread. Support is the low side of the trend, resistance is the high side of the trend. A breakout is when the asset trades above resistance or below support. This action generally suggests that the stock is going to make a strong run in the direction of the breakout.
Taking advantage of this strategy is relatively simply. First and foremost, add support and resistance lines to your trading chart. After you do so, pay close attention to the value of the asset when it nears either the support or resistance line. If the asset breaks below the support line, it’s a signal that the value is likely to take a dive. If the asset breaks above the resistance line, it’s an entry signal suggesting that the value of the asset is going to climb. Simply make your trade based on what the breakout is telling you.
Trade Entry Strategy #2: Moving Average Trading
A moving average is an average price of the stock over a predetermined period of time. With every new day, the last number in the average is removed and the new price is added, which is why it’s called a moving average. Using multiple moving averages, a trading strategy known as moving average crossover trading emerges. Here’s how it all works…
Start by opening your trading chart and adding the 30 day moving average trend line to the chart. Now, add a 90 day moving average line to the chart. These lines will generally follow each other but rarely touch. When the lines touch, the action is known as a moving average crossover, and proves to be an entry signal for traders.
When the 30 day, or shorter, moving average crosses above the 90 day, or longer, moving average, it is a bullish signal, suggesting that the value of the asset is headed for an upward trend. On the other hand, when the shorter moving average crosses below the longer moving average, it is a sign that the value of the stock is likely to go on a decline. Following the signals, make your trade accordingly.
Strategy #3: Trend Based Trading
At the end of the day, successful trading can be as simple as following a trend. For example, let’s say that a financial asset is trending upward. This is seen when the asset’s value sees a series of higher highs and higher lows. In this particular situation, it’s a good idea to enter a bullish trade than a bearish one. Particularly, the trade would be entered when the value of the asset touches or comes very close to the support trend line on a pullback.
When the trend is downward, it’s better to look for bearish trading opportunities. This trend is identified through a series of lower highs and lower lows. When the value of the asset nears the resistance trend line on a climb, it’s a signal for a bearish entry. Just remember, the trend is your friend. It will tell you when to make your move.
Final Thoughts
At the end of the day, trading isn’t a difficult process. While it does take knowledge of the market, by understanding entry and exit strategies, making a good amount of money in a short amount of time is definitely possible. So, what are you waiting for? It’s time to start trading!
Macroeconomic overview: Yesterday, market attention was squarely on ECB communication, particularly on the forward guidance. The only relevant change to the European Central Bank guidance was the decision to drop the reference to the possibility of lower policy rates, which Draghi justified with the disappearance of deflation risks. This is in line with our expectations. The other key parts of ECB communication remain unchanged. These include: 1. The exit sequence (rate hikes only after QE is over); 2. The expected time lag between the end of QE and the first rate hike (the “well past the horizon” language was confirmed); 3. The easing bias on asset purchases (the ECB restated “we stand ready to increase our asset purchase program in terms of size and/or duration”). In a nutshell, we think the ECB made the smallest possible changes to its communication considering the unambiguous brightening of the growth outlook.
The new macroeconomic forecasts revealed slightly stronger growth but weaker inflation. The GDP forecasts were revised upward by 0.1 percentage point in each year of the forecast horizon, now showing growth of 1.9% this year, 1.8% in 2018 and 1.7% in 2019. This more constructive assessment is not surprising and seems to mainly reflect the ongoing improvement in global trade.
Also the inflation forecasts moved in the direction we had predicted – down – but the revisions were larger than expected. Headline inflation is now seen at 1.5% in 2017 (-0.2 percentage point), 1.3% in 2018 (-0.3 percentage point) and 1.6% in 2019 (-0.1 percentage point), with revisions mainly due to lower oil prices. Although Draghi dismissed it, we note that the core inflation path for 2018-2019 was lowered by 0.1 percentage point in each year, respectively to 1.4% and 1.7%. This revision is important because it comes while the ECB raises its growth forecasts. Given that second-round effects from lower commodity prices are unlikely to have been the main trigger, this is probably telling us that the ECB has started to have a hard look at its models to correct some of their overly optimistic price outputs.
Where do we go from here? Draghi was clear: the ECB has a price mandate and more patience is needed before stronger economic growth puts upward pressure on core inflation and wages. Unless economic growth starts losing momentum, we think the Governing Council remains on track for a tapering announcement in September, with implementation starting next year. Technical constraints will play a key role in the decision to taper, and recent experience (i.e. December 2016) shows that the ECB can announce a reduction in the pace of purchases even when lowering its forecasts for core inflation. That said, it is becoming increasingly clear that policy normalization in 2018 will happen at a slow pace.
FBI Director James Comey accused President Donald Trump of firing him to try to undermine the bureau’s investigation into possible collusion between his 2016 presidential campaign team and Russia, but did not say whether he thought the president sought to obstruct justice. But currency markets had already largely shrugged off Thursday’s testimony by Comey, which had been seen as the week’s other big event.
Technical analysis: The EUR/USD broke below 14-day exponential moving average and is testing 23.6% fibo of May rally today. A close below this level would be a bearish signal. We think that a corrective move to 50% fibo (at 1.1061) is likely in the coming days.
Short-term signal: As we expected, yesterday’s ECB statement spurred some profit taking on recent EUR/USD rise. We stay short (at 1.1235) for 1.1070. The short-term correction does not change our long-term bullish view.
Long-term outlook: Bullish
GBP/USD: Hung parliament generates huge political uncertainty
Macroeconomic overview: Theresa May’s Conservative party has surprisingly lost its majority in the House of Commons. It’s a disaster for her. She called this snap general election to give her a stronger hand in Brexit negotiations. Instead she is substantially weakened by the result and is facing pressure to resign as Conservative party leader. The result has generated huge political uncertainty.
The share of the popular vote is Conservatives 42.4% (up from 36.8% in 2015), Labour 40.1% (up from 30.5% in 2015), Lib Dems 7.2% (down from 7.9% in 2015), SNP 3.1% (down from 4.7% in 2015), and UKIP 1.9% (down from 12.7% in 2015). The Labour party under Jeremy Corbyn’s leadership performed much better than expected, increasing their number of seats and vote share. The pro-EU Lib Dems failed to make a breakthrough, while the biggest change compared to the last election in 2015 was the widely expected collapse of the UKIP vote. More former UKIP voters switched to Labour than expected. Turnout was high at 68.7%, up from 66.4% in 2015, suggesting many more young voters than usual turned out to vote, mostly for Labour.
The result raises a lot of questions, the answers to which will only become clear in the hours, days and months ahead.
Who will form the next government? The Conservatives are still by far the biggest party and will try to form a minority government, likely with support from the DUP on the basis of confidence and supply (rather than a formal coalition). A coalition of Labour, SNP and the Lib Dems would fall short of a majority (and the seat tally of the Conservatives), as well as being politically difficult. However, a Conservative government would be substantially weakened, relying on other parties to pass legislation, substantially raising the probability that new elections will be called.
What happens with Brexit? negotiations with the EU on Brexit were due to start in just over a weak, but the election result is likely to delay this. If the Conservatives indeed form a minority government, with support from the pro-Brexit DUP, it would likely result in an even harder Brexit. The hard-line eurosceptics in the Conservative party would continue to have a lot of bargaining power, making an orderly withdrawal from the EU less likely. According to Article 50, the UK falls out of the EU in March 2019 irrespective of whether there is a withdrawal agreement, unless there is unanimous agreement to extend the talks. On the other hand, the result strengthens the opposition to a very hard Brexit with Labour, SNP, and the Lib Dems, when taken together, increasing their number of seats in the House of Commons.
Following results of the general elections, we expect UK risky assets to come under pressure, as markets will start pricing in a scenario of high political uncertainty, a growth slowdown and possibly disorderly Brexit. The currency market has responded in a rather predictable fashion to the prospects of a UK hung parliament: GBP/USD fell below 1.2700, levels not seen since mid-April while EUR/GBP rallied strongly above 0.8800, its highest rate since early January.
Technical analysis: Today’s drop in the GBP/USD was stopped at 61.8% fibo of April-May rise. Daily cloud base at 1.2578 could be another bear target.
Short-term signal: We stay sideways as huge political uncertainty makes GBP trading too risky.
Long-term outlook: Flat
TRADING STRATEGIES SUMMARY:
FOREX – MAJOR PAIRS:
FOREX – MAJOR CROSSES:
PRECIOUS METALS:
How to read these tables?
1.Support/Resistance – three closest important support/resistance levels 2. Position/Trading Idea: BUY/SELL – It means we are looking to open LONG/SHORT position at the Entry Price. If the order is filled we will set the suggested Target and Stop-loss level. LONG/SHORT – It means we have already taken this position at the Entry Price and expect the rate to go up/down to the Target level. 3. Stop-Loss/Profit Locked In – Sometimes we move the stop-loss level above (in case of LONG) or below (in case of SHORT) the Entry price. This means that we have locked in profit on this position. 4. Risk Factor – green “*” means high level of confidence (low level of uncertainty), grey “**” means medium level of confidence, red “***” means low level of confidence (high level of uncertainty) 5. Position Size (forex)– position size suggested for a USD 10,000 trading account in mini lots. You can calculate your position size as follows: (your account size in USD / USD 10,000) * (our position size). You should always round the result down. For example, if the result was 2.671, your position size should be 2 mini lots. This would be a great tool for your risk management! Position size (precious metals) – position size suggested for a USD 10,000 trading account in units. You can calculate your position size as follows: (your account size in USD / USD 10,000) * (our position size). 6. Profit/Loss on recently closed position(forex) – is the amount of pips we have earned/lost on recently closed position. The amount in USD is calculated on the assumption of suggested position size for USD 10,000 trading account. Profit/Loss on recently closed position (precious metals) – is profit/loss we have earned/lost per unit on recently closed position. The amount in USD is calculated on the assumption of suggested position size for USD 10,000 trading account. About the Author:
On Thursday, trading on the Euro closed down. The single currency slid in response to the EBC’s decision to maintain key rates at their current levels as well a reduced inflation forecast.
This year’s inflation forecast for the Eurozone has been downgraded from 1.7% to 1.5% and for 2018 from 1.6% to 1.3%. By 2019, inflation is forecast to be around 1.6%. The forecast for economic growth in 2017 has increased from 1.8% to 1.9%.
Mario Draghi’s press conference sparked a surge in volatility on the Forex market, but the head of the ECB managed to keep the Euro trading within a 35 pip range.
The market had been bracing itself for former FBI director James Comey’s testimony to the Senate. However, as it turned out, his comments failed to cause much surprise. At the Senate hearing, there was no direct accusation implicating Russia on the question of potential interference from Donald Trump in the FBI’s investigation. Now, Democrats and Republicans will both interpret Comey’s testimony to their own ends.
Market expectations:
In Asia, the Euro/dollar has fallen to 1.1179 while the pound has collapsed by 230 pips. It has now been confirmed that the Conservative Party has failed to win an outright majority, resulting in a hung parliament.
Day’s news (GMT+3):
09:00 Germany: CPI (May), trade balance (Apr);
11:30 UK: manufacturing production (Apr), consumer inflation expectations, industrial production (Apr);
15:30 UK: NIESR GDP estimate (May);
15:30 Canada: net change in employment (May), unemployment rate (May), capacity utilisation (Q1);
Buyers are disappointed by the ECb’s decision to maintain key rates and their QE program at their current levels. James Comey also failed to increase volatility on currency markets.
In Asia, the British pound is currently undergoing some sharp fluctuations. As the votes are being counted, it has now been confirmed that the Conservatives have failed to reach a parliamentary majority and the leader of the Labour Party, Jeremy Corbyn, has called on Prime Minister Theresa May to step down.
The final results are still coming in, but it’s already clear that the pound has dropped by around 1.9% and won’t be coming back any time soon. Buyers have given up. The pound will now dictate the sentiment on all pairs. I imagine that once the EUR/GBP cross calms down, the Euro will fall with the pound against the dollar to 1.1170. It would be better for sellers if this fall extended to 1.1150.
June options expire today. The 1.1253 option level has survived. Now, sellers of Call options with a strike above 1.12 need to keep the rate in the 1.1200 region. In such a case, all options will be out of the money and buyers will lose out on the premium paid when buying the options.
“The stock market is filled with individuals who know the price of everything, but the value of nothing.” – Phillip Fisher
The quotation mentioned above refers to the fact that investing on any one of the global financial markets without researching both the underlying market conditions as well as the price movements of an individual asset can only lead to disastrous investment decisions. Furthermore, research involves far more than just listening to popular opinion; it is about utilising trading tools such as technical indicators, graphs, and charts to help you determine whether it worth investing in a particular asset at any given point in time.
Technical indicators and analysis
A technical indicator is essentially a mathematical calculation based on an asset’s historical price data and volume being sold with the aim of forecasting financial market direction. In other words, it is a study of market-generated data as well as data generated from the actions of market investors. Furthermore, a technical indicator is a crucial part of the whole technical analysis process where the data is usually portrayed as a chart or graph predicting current and future market trends.
Before the art and science of technical analysis using technical indicators sounds too complicated, a financial analyst notes that at its root, technical analysis is nothing more than a method of deciding whether it is worth trading on an asset or not. Furthermore, he is of the opinion that “once you identify whether an asset is trade worthy or not, you are in the enviable position of being an industry leader when constructing a successful investment portfolio.”
Types of technical indicators
There are many technical analysis tools available for analysts to use, with brand new ones being covered on any serious financial blog in the world; however, you mainly need the following information: You need to know where the asset is currently trading and how the asset got to this trading level. Secondly, you need to learn how dominant the price trend is. And finally, you need to compare the asset to the market, its peers in the same niche, as well as to its history.
Consequently, to ensure that you determine the information mentioned above, you need access the following five technical indicator tools:
Relative performance indicators
These indicators show the ratio of an asset’s performance to the relative market index or business category. In other words, when you choose an underlying asset to trade on, you need to look at how it is performing when compared to the financial market as a whole as well as when compared to its industry peers.
Trends and trend lines
In short, it is relatively straightforward to track market trends. Ergo, if you look at a graph or chart of an asset’s price, and you find that the price line indicating the highs and lows keeps on rising as well, then you have a rising trend. The rising trends are the ones that will always be preferred by investors.
Support and resistance levels
In technical analysis, support and resistance are a concept that the movement of the price of an asset will tend to stop and turn back at certain predefined price levels. Furthermore, multiple touches of price denote these levels without a breakthrough of the particular level. In other words, support and resistance levels merely tell us what price levels are likely to draw out the buyers and the sellers.
Moving averages
In essence, a moving average is a statistical calculation that looks at the average price of an asset over a set period, ranging from five days to six months or more. It’s important to note that a moving average is a lagging indicator; it follows an event. Ergo, the mathematical calculation uses historical data to track the trend of the asset.
Momentum and Volume
In summary, a momentum indicator measures the speed at which the asset’s price rises and falls. Furthermore, it is a useful indicator of strength or weakness in the stock’s price. On the other hand, a volume indicator merely shows the numbers of shares that have been traded in a set timeframe.
Final words
Thorough market research is critical as part of your decision-making process when deciding on which underlying asset to trade on. Furthermore, once you have decided on an asset, you will then need to decide on your trading strategy. The good news is that technical indicators, when used correctly, go a long way towards proving the necessary information; thus, allowing you to invest from a strong trading position.
 By CountingPips.com – Get our weekly COT Reports by Email