Author Archive for InvestMacro – Page 547

How One Forecasting Tool Defied the Bull Market Naysayers

Three compelling Elliott wave charts lay it all out

By Elliott Wave International

The Elliott wave model often indicates a stock market outlook that’s at odds with the sentiment of the crowd.

But, that’s okay. The crowd is usually wrong at major market turns.

For example, two years ago on May 9, 2015, the bull market was six years old and the third longest in history. A few days earlier, CNN Money said:

As the bull market gets longer and longer, investors are getting jittery.

A chart we created shows the then six-year uptrend and reiterates the sentiment of that time:

A stock market high did occur in May 2015, but it wasn’t THE high, as many investors expected.

As the chart shows, the S&P 500’s rise through that time completed a third wave, the longest and strongest part of a financial trend. Yet, major trends, whether bull or bear, advance or decline in five waves. Our model expected a wave 4 correction to follow – and then a wave 5 that would take stocks to higher highs.

In the Elliott wave model, waves one, three and five move in the same direction as the main trend. Waves two and four are countertrend moves. On the chart, you can see the decline represented by wave (2). Following the wave (3) advance, as you can see on the next chart, the reversal of wave (4) stretched into the early part of 2016:

Indeed, in February 2016, our Elliott Wave Theorist said:

…we can finally judge wave C …to be complete.

What that meant was that a year and a half ago, wave (4) was complete — and wave (5) up to new highs was set to start.

Even so, around that time, two financial websites showed identical headlines:

  • Is the Bull Market Over? (Motley Fool, Jan. 23, 2016)
  • Is the bull market over? (CNBC, March 9, 2016)

The second headline published on the seventh anniversary of the bull market, prompting market writers to question the sustainability of the bull market.

But the market’s Elliott wave pattern is not beholden to anniversaries or any other such factors.

How has the February 2016 Theorist’s forecast played out? Well, as it’s been said, a picture is worth a thousand words. Take a look:

Yes, since the Theorist nailed the completion of wave (4), the S&P 500 has rallied more than 25%.

You’ve just seen an example of why our subscribers are convinced of the Elliott wave model’s value.

Now, it’s up to you to get the details of what we anticipate next.

Here’s the good news: You can read the entire 10-page March 2017 Elliott Wave Theorist 100% FREE — but only for a limited-time. Read below for details.

Get a free issue of market legend Robert Prechter’s Elliott Wave Theorist now

Read this eye-opening issue now and you’ll get a clear picture of what’s next for stocks, bonds and oil and more to help you jump on opportunities and sidestep risk. This free issue (a $29 value) will show you Prechter’s unique outlook and give you a new perspective on the markets you won’t get anywhere else.

Download your FREE issue from Robert Prechter now – for a limited time.

This article was syndicated by Elliott Wave International and was originally published under the headline How One Forecasting Tool Defied the Bull Market Naysayers. EWI is the world’s largest market forecasting firm. Its staff of full-time analysts led by Chartered Market Technician Robert Prechter provides 24-hour-a-day market analysis to institutional and private investors around the world.


US-China Ties in the Shadow of the Mueller Investigation

By Dan Steinbock

In the foreseeable future, the Trump administration will be constrained by the special counsel’s Russia investigation. How will it impact the White House’s relations with China?

It was a strange month. First, the Department of Justice (DOJ) dismissed James Comey, Director of the Federal Bureau of Investigation (FBI), who the center-right Democrats blame for Hillary Clinton’s 2016 electoral loss. In turn, the center-left Sanders-supporters attribute the loss to Hillary Clinton’s gross abuse of public office and funds, Bill Clinton’s corrupt Global Initiative, collusion with the Democratic Leadership Committee (DLC) and mainstream media.

Barely a week later, the DOJ appointed Robert Mueller, former director of the FBI (2001-13), as special counsel overseeing the investigation into Russian interference in the 2016 elections. Meanwhile, Hillary Clinton claimed she was “right” about the “vast Russia conspiracy.”

Of course, there is little doubt about the ultimate outcome of the Mueller investigation. He served loyally under President George W. Bush and Vice President Dick Cheney. So from the Trump White House perspective, the end is pretty much known. It is the process that has potential to undermine his presidency.

But what will happen to Trump’s ties with China as White House begins its fight for political survival? The short answer is that those areas of the Trump agenda that require legislation (e.g., tax reforms) will remain more vulnerable to direct and indirect constraints associated with the Mueller investigation. In contrast, those areas of his agenda, which can be implemented mainly through executive action (e.g., trade policy), will be less exposed to such constraints. Finally, those areas of the agenda that are somewhere between executive and legislative action may prove easier to implement as well (e.g., sanctions).

Commercial ties with China

During the 2016 campaign, Trump threatened to use high import tariffs against nations that have a significant trade surplus with the US, particularly China ($347 billion), Japan ($69 billion), Germany ($65 billion), Mexico ($63 billion), and Canada ($11 billion). Nevertheless, trade pragmatism prevailed in the Mar-a-Lago meeting, where Trump and President Xi Jinping announced a 100-day plan to improve strained trade ties and boost cooperation between two nations. But if the plan cannot offer major breakthroughs after the summer, trade hawks may return and deficit rhetoric could escalate toward the year-end.

Right after his inauguration day, just as he had pledged, President Trump used executive order to pull out of the Trans-Pacific Partnership (TPP), President Obama’s legacy deal. In his campaign, Trump had promised to renegotiate key US free trade agreements, including the North American Free Trade Agreement (NAFTA). Indeed, as trade policy relies mainly on executive action, the administration may try to renegotiate deals rather than to reject them, if only to minimize the downside risk.

The positive spin has already been introduced. As US Trade Representative, Robert Lighthizer, puts it, the administration will not seek to “overturn” NAFTA trade but to “expand” it. NAFTA renegotiations are set to start soon. When the talks begin after mid-August, they will be followed closely by other bilateral trade agreements that will soon be on the table (South Korea, Japan, and Taiwan). Since negotiations are likely to endure through the fall, major trade friction that would undermine global growth prospects may not be likely until 2018.

The proposed tax reforms are a different story. Mueller’s investigation is likely to overshadow Trump efforts at tax overhaul, which relies on legislative consensus and the perceived strength of the Trump administration. Yet, legislative support will be challenging in the current conditions, and the administration’s staying power is now subject to both counsel’s investigation and political speculation.

Moreover, even if the Trump plan could reduce US corporate rates significantly, that might not be adequate to “reshore” US companies’ overseas profits and corporate operations. There has been no major outflux of foreign firms from large emerging economies, which offer 3-4 times faster growth than the US or Europe.

Fiscal policy requires consensus among the Senate, House and Executive branch of the government, which are internally divided and externally under extensive scrutiny. In the long run, inadequate fiscal support could undermine Trump’s huge $1 trillion infrastructure initiative, affecting the dollar and import growth – and thus the Chinese renminbi, Chinese exports and investment.

Strategic ties with China

Recently, a US Navy destroyer sailed close to a disputed South China Sea island controlled by China. It was the first time under President Trump. Intriguingly, USS Dewey’s “freedom of navigation” (FON) operations were timed right after China and ASEAN agreed to draft a code of conduct in the South China, which has potential to reduce the risk of military clashes in one of the world’s busiest waterways.

As Trump hopes to launch a Reagan-style military rearmament program, some observers expect him to push assertive military measures around the world. However, they may ignore the fact that the “America First” program is focused on domestic priorities, as evidenced by Trump’s tougher stance against German trade surpluses and EU members’ “free riding” behind the US-funded NATO.

Since sanctions and other economic coercive measures fall under executive actions, Trump’s strategic maneuverability is less restricted in these areas. Then again, both Republican neoconservatives and Democratic liberal internationalists support sanctions against North Korea, and, with some qualifications, against Iran.

North Korea’s nuclear blackmail is strongly opposed by the White House and objectionable in Beijing as well. In the case of Russia, sanctions will prevail and possibly broaden. Trump’s reset efforts are likely to remain frozen through the special counsel’s investigation and more challenging to implement after that investigation. In the case of Iran, Trump is likely to push sanctions outside the nuclear deal as far as possible, which will be cheered by Iran’s hardliners who oppose the recently re-elected moderate President Hassan Rouhani.

Nevertheless, Trump’s hard stance is in line with his rearmament program and closer ties with the Gulf Cooperation Council, Israel and particularly Saudi Arabia with which he recently signed a huge $110 billion weapons deal.

The Pandora’s Box

As far as the White House is concerned, the Mueller investigation may well undermine Trump’s most ambitious strategic goal: the Russia reset. As he pledged in 2016, Trump has sought, publicly and privately, an anti-terrorism coalition with President Putin. At each stage of the talks, the mainstream media’s “Russiagate” narrative — allegations that Trump himself or his “associates” have been treasonously compromised by the Kremlin, and for which no actual evidence has yet been produced — “has intervened in ways that jeopardize, if not sabotage, the diplomatic process,” as veteran Russia expert Stephen F. Cohen has noted.

Seeking to revive his stalled policy agenda in Congress, Trump is developing his “war room” within the White House to combat leaks, disclosures and the investigation about his associates and Russia. That means the return of his toughest and most confrontational campaign aides, including former campaign manager Corey Lewandowski, deputy manager David N. Bossie and, of course, chief strategist Stephen K. Bannon, his rough radical-right champion.

If necessary, the war room could go offensive. Since the 1990s, Bossie has used the darkest Clinton controversies to battle both Bill and Hillary Clinton and, when warranted, could resort to the controversial “nuclear card,” which rests on the controversial Wikileaks disclosures and associated testimonies, to steer public spotlight toward the gross abuse of public funds by the Clintons, Democratic leadership, and the 2016 deaths of Democratic operatives who were hoping to testify against such abuses and corruption before their odd deaths (including Seth Rich, Shawn Lucas, John Ashe and Victor Thorn).

Historically, the appointment of special counsel has often been accompanied by unintended consequences and collateral damage. The Mueller investigation is not likely to be an exception. When necessary, Trump’s war room will resort to offensive actions that will drag into the daylight the darker side of the Democratic leadership. As a result, America’s international clout, which has eroded almost two decades, may suffer new, more extensive, even irreparable harm.

Since the Mueller investigation is likely to slow down those parts of the Trump agenda that require legislative support, it may well steer the administration’s interest toward bold, executive actions. As long as the White House and Beijing can concentrate on cooperation, the constrained focus could take the bilateral ties on a new, broader level faster than anticipated. However, if cooperative benefits are seen as inadequate in the White House, Beijing or both, the result could be a challenging lose-lose scenario. Consequently, failure in US-Chinese talks is not an option.

About the Author:

Dan Steinbock is the founder of the Difference Group and has served as the research director at the India, China, and America Institute (USA) and a visiting fellow at the Shanghai Institutes for International Studies (China) and the EU Center (Singapore). For more information, see http://www.differencegroup.net/ 

The original commentary was released by China-US Focus on June 9, 2017.


Ichimoku Cloud Analysis 12.06.2017 (GBP/USD, GOLD)

Article By RoboForex.com

GBP USD, “Great Britain Pound vs US Dollar”

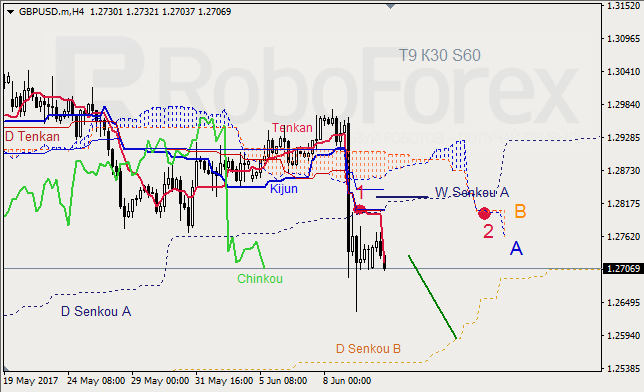
GBP USD, Time Frame H4. Indicator signals: Tenkan-Sen and Kijun-Sen intersected below Kumo Cloud and formed “Dead Cross” (1). Ichimoku Cloud is heading down (2), Chinkou Lagging Span is below the chart, and the price is on Tenkan-Sen. Short-term forecast: we can expect resistance from Tenkan-Sen, and decline of the price up to the daily cloud’s downside border.

GBP USD, Time Frame H1. Indicator signals: Tenkan-Sen and Kijun-Sen ran into one another below Kumo Cloud, they may intersect and form “Dead Cross” (1). Ichimoku Cloud is going down (2), Chinkou Lagging Span is on the chart, and the price is below the lines. Short-term forecast: we can expect resistance from Tenkan-Sen and Kijun-Sen, and decline of the price.


XAU USD, “Gold vs US Dollar”

XAU USD, Time Frame H4. Indicator signals: Tenkan-Sen and Kijun-Sen intersected above Kumo Cloud and formed “Dead Cross” (1). Ichimoku Cloud is closed (2), Chinkou Lagging Span is below the chart, and the price is inside the cloud. Short‑term forecast: we can expect support from Senkou Span B, resistance from Tenkan-Sen, and decline of the price.


RoboForex Analytical Department

Article By RoboForex.com

Attention!
Forecasts presented in this section only reflect the author’s private opinion and should not be considered as guidance for trading. RoboForex LP bears no responsibility for trading results based on trading recommendations described in these analytical reviews.

Forex Technical Analysis & Forecast 12.06.2017 (EUR/USD, GBP/USD, USD/CHF, USD/JPY, AUD/USD, USD/RUB, GOLD, BRENT)

Article By RoboForex.com

EUR USD, “Euro vs US Dollar”

After opening today’s trading session with a gap up, the EUR/USD pair continues moving upwards; it looks like the pair has already completed the first wave. Possibly, the price may be corrected towards 1.1242. Later, in our opinion, the market may fall to break the low of the first wave and form a continuation pattern. After that, the instrument may move with the target at 1.1100.


GBP USD, “Great Britain Pound vs US Dollar”

The GBP/USD pair has completed the ascending impulse and right now is consolidating. Possibly, the price may break this consolidation range to upside and continue the current correction towards 1.2900. Later, the market may move downwards to reach 1.2630.


USD CHF, “US Dollar vs Swiss Franc”

The USD/CHF pair has completed the first ascending impulse. We think, today the price may be corrected towards 0.9660. After that, the instrument may form the third ascending structure with the target at 0.9800.


USD JPY, “US Dollar vs Japanese Yen”

The USD/JPY pair is falling. Possibly, the price may form the descending structure to reach the local target at 108.70. Later, in our opinion, the market may be corrected towards 110.42.


AUD USD, “Australian Dollar vs US Dollar”

The AUD/USD pair has broken its ascending channel, and right now is consolidating and forming the first descending impulse. The main scenario implies that the price may fall to reach 0.7506. After that, the instrument may grow towards 0.7540.


USD RUB, “US Dollar vs Russian Ruble”

The USD/RUB pair is consolidating below 57.00. If the price breaks it to the upside, it may grow and extend the current correction towards 57.88 (an alternative scenario). The main scenario implies that the instrument may fall towards 55.50.


XAU USD, “Gold vs US Dollar”

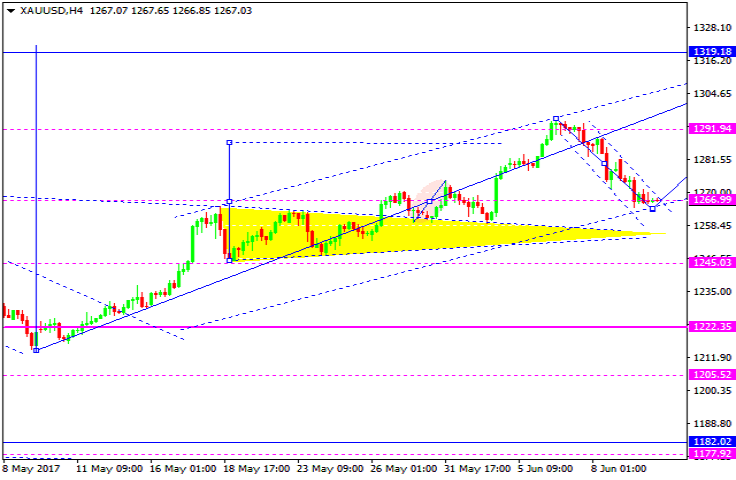
Gold has returned to 1267 and right now is consolidating. If later the market breaks this consolidation range to the upside, the instrument may move upwards to reach 1291; if to the downside – start another decline with the target at 1255.


BRENT

Brent is still falling and forming another consolidation range.  If later the market breaks this consolidation range to the upside, the instrument may grow and reach 50.25; if to the downside – continue falling with the target at 46.40.


RoboForex Analytical Department

Article By RoboForex.com

Attention!
Forecasts presented in this section only reflect the author’s private opinion and should not be considered as guidance for trading. RoboForex LP bears no responsibility for trading results based on trading recommendations described in these analytical reviews.

EURUSD: Euro trading at the balance line

By Gabriel Ojimadu, Alpari

Previous:

On Friday, the Euro was down at the end of the trading session. The Euro fell against the dollar to 1.1166 during trading in New York. After the news that Theresa May had agreed to a “supply and confidence” arrangement with the Democratic Unionist Party of Northern Ireland, as well as a slide in US bond yields, our pair restored to 1.1204.

Market expectations:

The Euro has started the week with an attempt to consolidate above 1.12. At the time of writing this review, the Euro was trading at 1.1208. The fight is taking place around the lb balance line. I’d like to note that in Asia, the Euro has been rising along with US bond yields. US 10Y bond yields have risen by 0.7% to 2.219%. If US bonds grow any further, the Euro will not be able to follow suit.

I’m allowing for a strengthening of the Euro up to 1.1225, but I’m expecting the session to close down. If the price immediately rebounds as trading gets underway in Europe, then we could see the rate fall as far as 1.1176. The calendar is empty, so I don’t see Friday’s minimum being updated.

Day’s news (GMT+3):

  • 09:00 Japan: machine tools orders (May);
  • 11:30 Australia: RBS assistant governor Debelle’s speech;
  • 20:35 Canada: BoC deputy governor Wilkins’ speech;
  • 21:00 USA: monthly budget statement (May).

EURUSD rate on the hourly. Source: TradingView

Intraday forecast: low: 1.1194, high: 1.1225, close: 1.1194.

My expectations for Friday rang true. The Euro exchange rate reached its target of 1.1175. From a low of 1.1166, the pair restored to 1.1212, including Asia’s trades. Price movement slowed down around the lb balance line. The price has stabilised on the hourly timeframe and is ready to stray from this line.

The economic calendar is empty. due to this, I’m expecting the rate to restore to the upper boundary of the downwards channel at 1.1225. I propose that we will see renewed selling from the 45th degree. Buyers have potential control over the situation. In order for buyers to take control, they need to consolidate at around 1.1125/35 level. Cycles on the hourly timeframe are reversing upwards such that my minimum is at 1.1195 and not 1.1175. It’s hardly worth expecting any sharp fluctuations before the FOMC sits down.

How to Exit Your Trades Successfully

By Adinah Brown

There are two crucial decisions to make when you trade fx: when you enter and when you exit. The term “trade exit” refers to the way in which a trader manages his Stop Loss/Take Profit target levels, in order to end a live trade. Before we begin to discuss the best ways in which a trader should exit a trade in order to minimize losses and maximize profits, here are some things you need to know:

1. Don’t be greedy. You will never be able to squeeze every single drop out of every trade. Think of the saying “bulls and bears make money, but pigs get slaughtered.”

2. Losses are part of the deal. Sometimes, you are going to have to accept the fact that not every trade is a winner, and developing a plan to deal with losses will help you avoid blowing your account while hoping things will turn around.

3. The market will not move in your favored direction forever. This goes back to point 1, don’t be greedy. Learn when to take your profits.

4. You’ll win some and you’ll lose some, but you are still a profitable trader as long as you win more than you lose.

Now let’s get to the nitty gritty. Five ways in which to successfully exit a trade:

Stop losses. Determine the amount of trading capital you are willing to risk on any given trade. Place a stop loss, and when you have lost that amount of money, get out. Setting stop losses and understanding volatility are two key factors in proper risk management.

Trailing stop. One of the best known techniques for profit extraction, a trailing stop allows you to set a certain amount of money as a trailing stop, so if a trade moves in your favor, the trailing stop moves proportionately in the same direction, but if the trade moves against you, it pulls you out, essentially allowing your profits to run through, but not your losses.

Price target. Particularly useful for traders who are unable to constantly monitor their trades because they allow you to walk away knowing that eventually, either your stop loss or your take profit order will be filled, price target is used for trading chart patterns, with the price target being based on the pattern’s size.

Let’s say you open a trade with a risk of $100, and set your target at $500, you know that your reward outweighs your risk 5:1. Use Fibonacci Extensions or support/resistance levels to set price targets, so in the event that the price of a currency is struggling to rise (resistance), you can place a price target right under the area of resistance.

The why is gone. Even if you are in a profitable trade, if the reasons for which you entered, disappear, then this may be an indicator to get out. If the indicator you used gave you positive signals to enter, but you see the indicator flip, the trends may be over, so take your profit and find the next great trade.

Something better came along. If you find something better, with a better probability of success, there is no shame in jumping ship, selling your current position and opening a new, more promising one.

The key to a successful trade exit is to have a plan to get out, even before you get in. Once the trade goes live, so do your emotions, so establishing an exit strategy before you open a trade is a key ingredient in your risk management plan.

About the Author:

Adinah Brown is a professional writer who has worked in a wide range of industry settings, including corporate industry, government and non-government organizations. Within many of these positions, Adinah has provided skilled marketing and advertising services and is currently the Content Manager at Leverate.


COT Reports: US Dollar bets edge up, Gold & Crude Oil rise bets sharply

By CountingPips.com

Here is a short summary and this week’s links (below) to the latest Commitment of Traders changes.

– Speculators raised US dollar bets after two down weeks, positions remain under +$10 billion

WTI crude oil speculators pushed bullish positions sharply higher, gain for 4th week

– The 10-year note speculators sharply decreased bullish bets for 2nd week

Gold speculative bets jumped higher for 3rd week, to over +200,000 contracts

Silver bets rose again for 3rd week to highest since May 2nd

Copper speculative bets rose for 3rd out of last 4 weeks

– Large S&P500 speculative bets edged higher after falling to lowest since 2012 previously


FX Speculators raised US Dollar bullish bets for 1st time in 3 weeks

US Dollar net speculator positions leveled at $8.0 billion last week

The latest data for the weekly Commitment of Traders (COT) report, released by the Commodity Futures Trading Commission (CFTC) on Friday, showed that large traders and currency speculators increased their bullish bets in favor of the US dollar for the first time in three weeks last week. See full article


WTI Crude Oil Speculators raised bullish net positions for 4th week

The non-commercial contracts of WTI crude futures totaled a net position of 382,469 contracts, according to data from last week. This was a rise of 8,714 contracts from the previous weekly total. See full article


Gold COT Speculator positions rose sharply, up for 3rd straight week

The large speculator contracts of gold futures advanced to a total net position of 204,465 contracts. This was a weekly boost of 37,375 contracts from the previous week. See full article


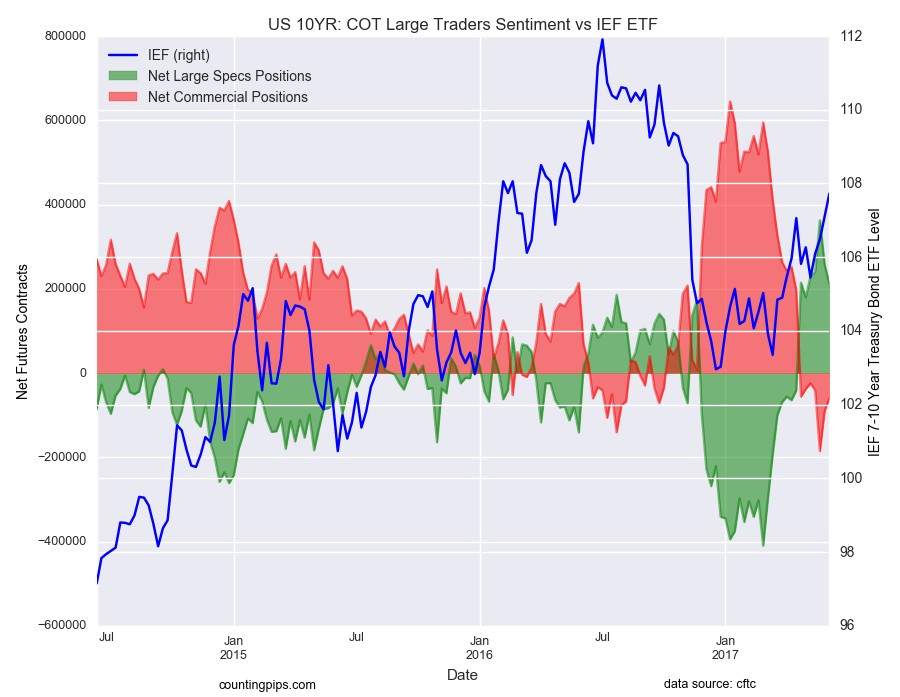
10 Year Treasury Note Speculators pulled back on bullish positions for 2nd week

The large speculator contracts of 10-year treasury note futures totaled a net position of 212,066 contracts. This was a weekly drop of -46,099 contracts from the previous week. See full article


Large S&P500 Speculator bearish positions edged higher last week

The large speculator contracts of S&P 500 futures totaled a net position of -7,343 contracts. This was an edge higher of 742 contracts from the reported data of the previous week. See full article


Silver Speculators continued to raise bullish net positions for 3rd week

The non-commercial contracts of silver futures totaled a net position of 65,941 contracts, according to data from last week. This was a weekly advance of 4,527 contracts from the previous totals. See full article


Copper Speculators added to bullish net positions last week

The large speculator contracts of copper futures totaled a net position of 12,726 contracts. This was a weekly rise of 3,082 contracts from the data of the previous week. See full article


Article by CountingPips.com

The Commitment of Traders report data is published in raw form every Friday by the Commodity Futures Trading Commission (CFTC) and shows the futures positions of market participants as of the previous Tuesday (data is reported 3 days behind).

To learn more about this data please visit the CFTC website at http://www.cftc.gov/MarketReports/CommitmentsofTraders/index.htm


FX Speculators raised US Dollar bullish bets for 1st time in 3 weeks


By CountingPips.comGet our weekly COT Reports by Email

US Dollar net speculator positions rose to $8.00 billion last week

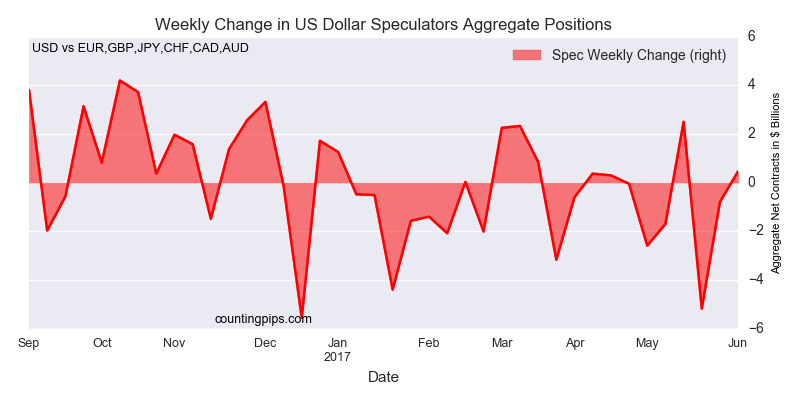
The latest data for the weekly Commitment of Traders (COT) report, released by the Commodity Futures Trading Commission (CFTC) on Friday, showed that large traders and currency speculators increased their bullish bets in favor of the US dollar for the first time in three weeks last week.

Non-commercial large futures traders, including hedge funds and large speculators, had an overall US dollar long position totaling $8.0 billion as of Tuesday June 6th according to the latest data from the CFTC and dollar amount calculations by Reuters. This was a weekly gain of $0.47 billion from the $7.53 billion total long position that was registered the previous week, according to the Reuters calculation (totals of the US dollar contracts against the combined contracts of the euro, British pound, Japanese yen, Australian dollar, Canadian dollar and the Swiss franc).

The aggregate US dollar positions, despite the weekly gain, remain below the $+10 billion level for a third consecutive week after staying above that level from September 27th 2016 to May 23rd.

Weekly Speculator Contract Changes:

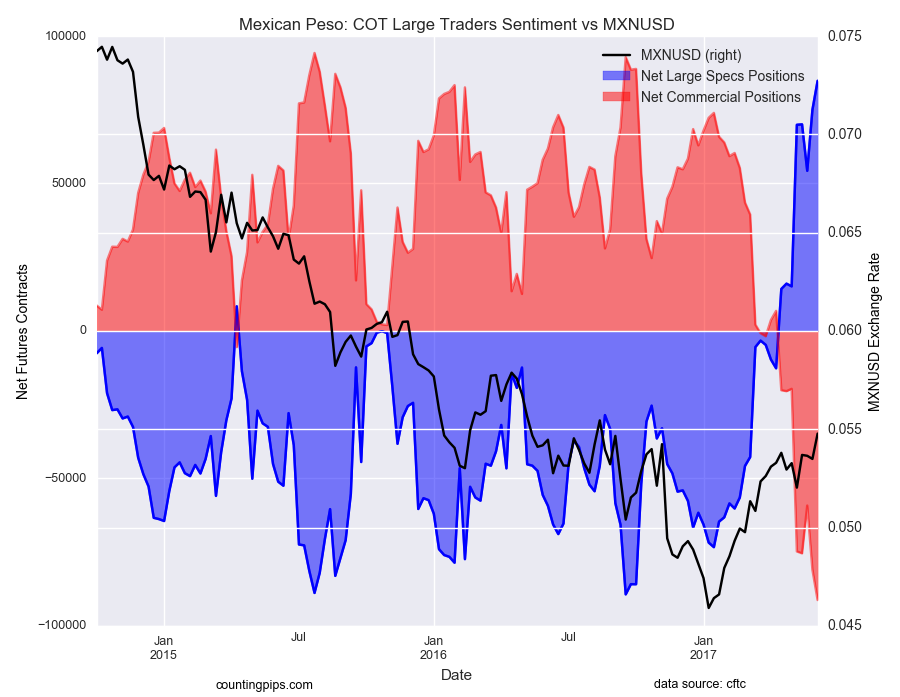
The individual major currency contracts movements this week were highlighted by continuing positive sentiment for the euro and the Mexican peso.

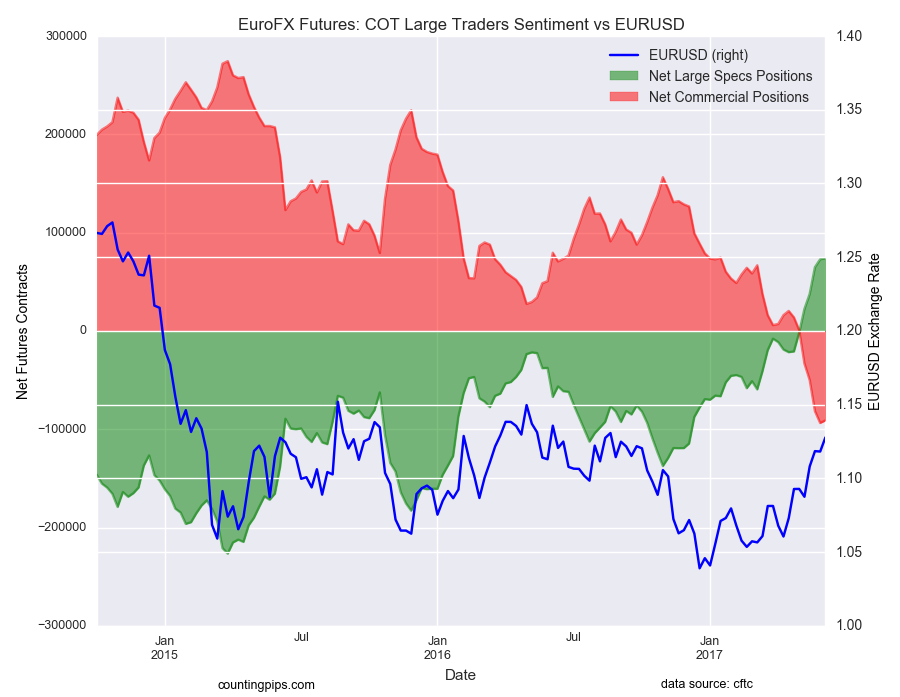
The euro speculator bids continued to gain for a seventh straight week and sent euro positions to the highest net bullish position since May 3rd 2011 when net positions totaled +99,516 contracts.

The Mexican peso positions rose for a second straight week and fourth out of the last fifth to the highest level since June 10th 2014 when net positions equaled +90,203 contracts.

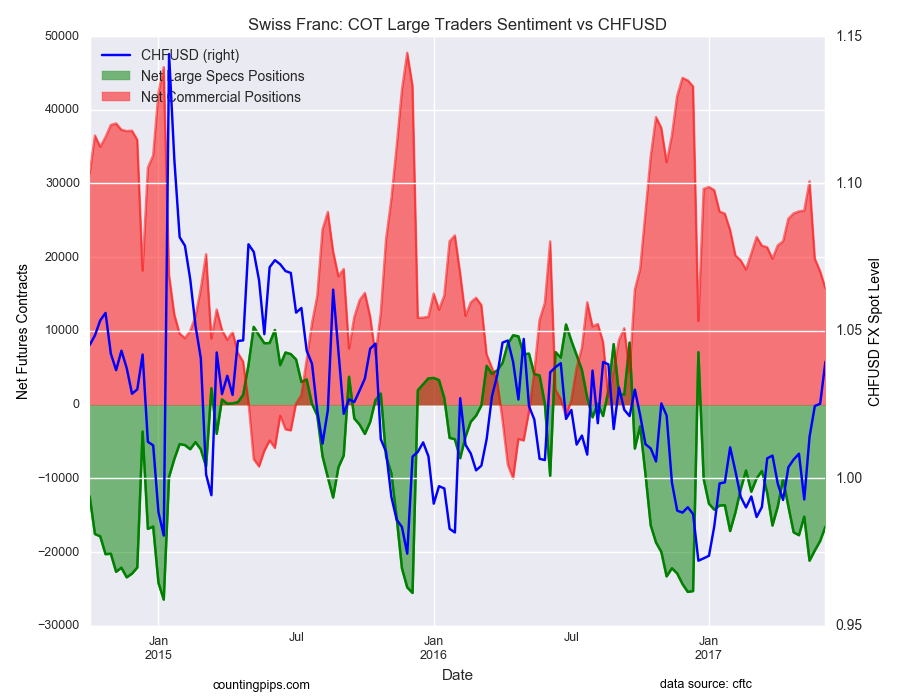
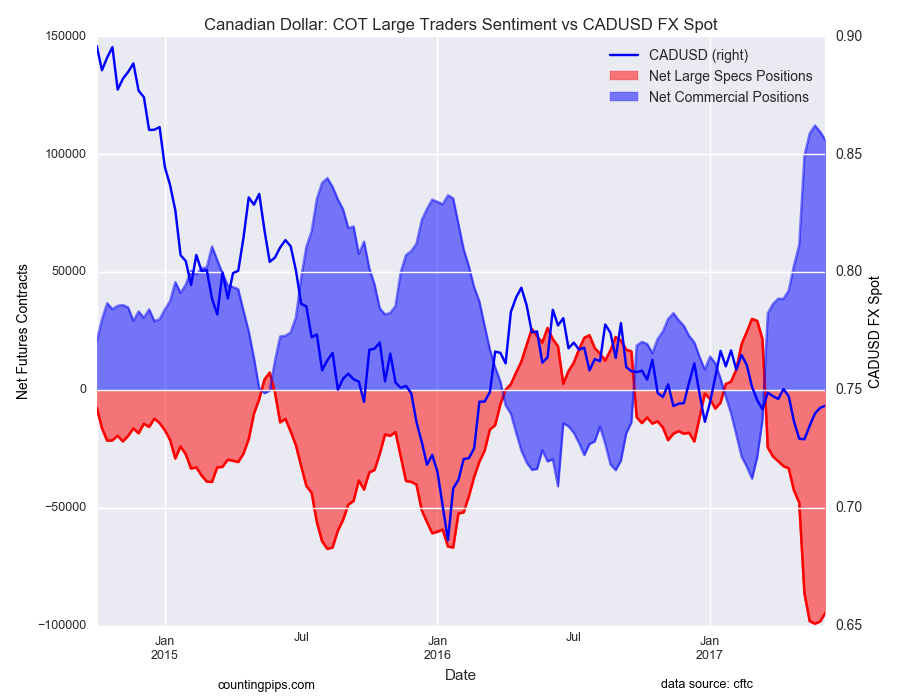
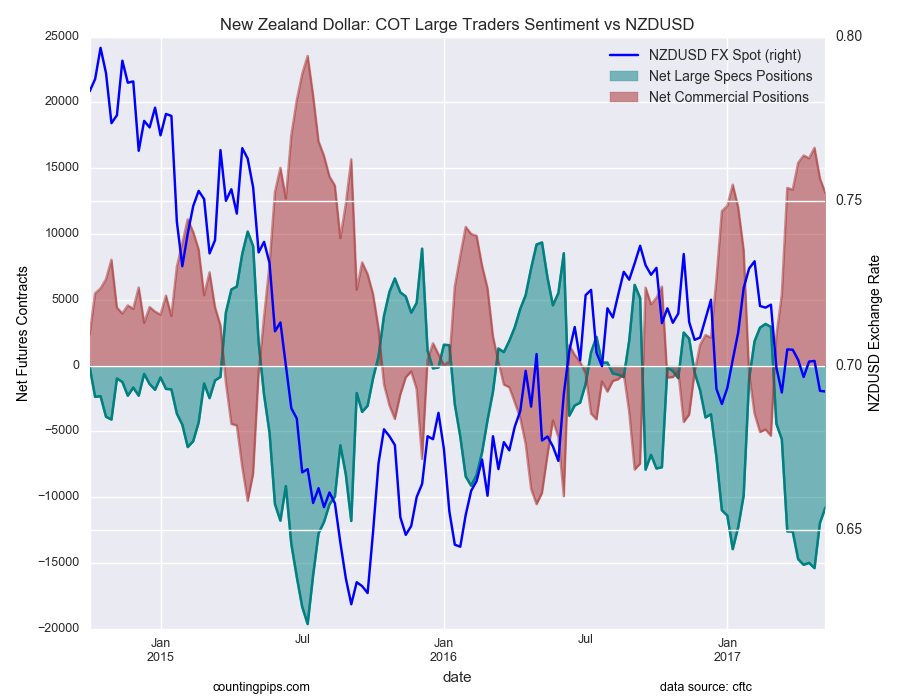
Overall, the major currencies that improved against the US dollar last week were the euro (1,140 weekly change in contracts), Swiss franc (1,957 contracts), Canadian dollar (3,686 contracts), New Zealand dollar (1,184 contracts) and the Mexican peso (9,819 contracts).

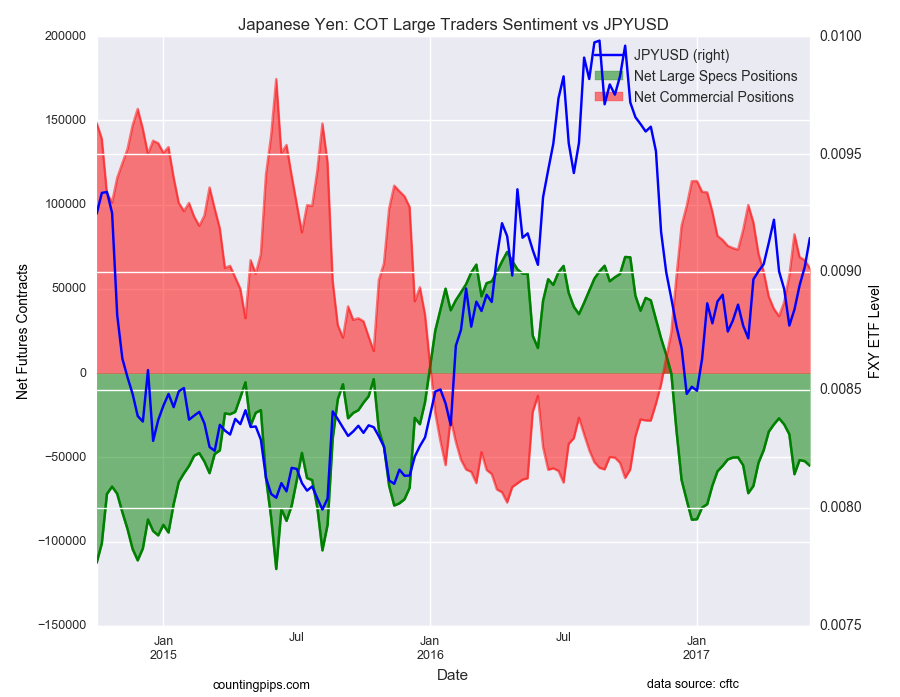
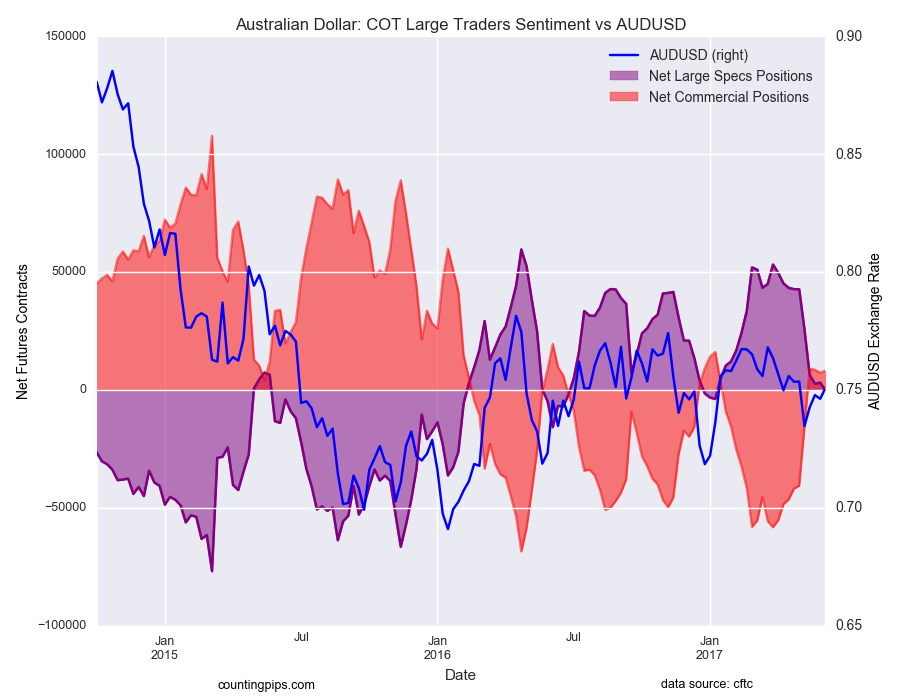
Meanwhile, the currencies whose speculative bets declined last week versus the dollar were the British pound sterling (-7,065 weekly change in contracts), Japanese yen (-2,752 contracts) and the Australian dollar (-3,181 contracts).


Table of Weekly Commercial Traders and Speculators Levels & Changes:

CurrencyNet CommercialsComms Weekly ChgNet SpeculatorsSpecs Weekly Chg
EuroFx-910052635740091140
GBP387485283-36716-7065
JPY62302-4722-55027-2752
CHF15813-2294-165551957
CAD105838-3536-945013686
AUD8219937-114-3181
NZD13108-1119-107861184
MXN-91251-10264848219819


This latest COT data is through Tuesday and shows a quick view of how large speculators or non-commercials (for-profit traders) as well as the commercial traders (hedgers & traders for business purposes) were positioned in the futures markets. All currency positions are in direct relation to the US dollar where, for example, a bet for the euro is a bet that the euro will rise versus the dollar while a bet against the euro will be a bet that the dollar will gain versus the euro.


Weekly Charts: Large Trader Weekly Positions vs Price

EuroFX:


British Pound Sterling:


Japanese Yen:


Swiss Franc:


Canadian Dollar:


Australian Dollar:


New Zealand Dollar:


Mexican Peso:

*COT Report: The weekly commitment of traders report summarizes the total trader positions for open contracts in the futures trading markets. The CFTC categorizes trader positions according to commercial hedgers (traders who use futures contracts for hedging as part of the business), non-commercials (large traders who speculate to realize trading profits) and nonreportable traders (usually small traders/speculators). Find CFTC criteria here: (http://www.cftc.gov/MarketReports/CommitmentsofTraders/ExplanatoryNotes/index.htm).

The Commitment of Traders report is published every Friday by the Commodity Futures Trading Commission (CFTC) and shows futures positions data that was reported as of the previous Tuesday (3 days behind).

Each currency contract is a quote for that currency directly against the U.S. dollar, a net short amount of contracts means that more speculators are betting that currency to fall against the dollar and a net long position expect that currency to rise versus the dollar.

(The charts overlay the forex closing price of each Tuesday when COT trader positions are reported for each corresponding spot currency pair.) See more information and explanation on the weekly COT report from the CFTC website.

Article by CountingPips.com


WTI Crude Oil Speculators raised bullish net positions for 4th week

By CountingPips.comGet our weekly COT Reports by Email

WTI Crude Oil Non-Commercial Positions:

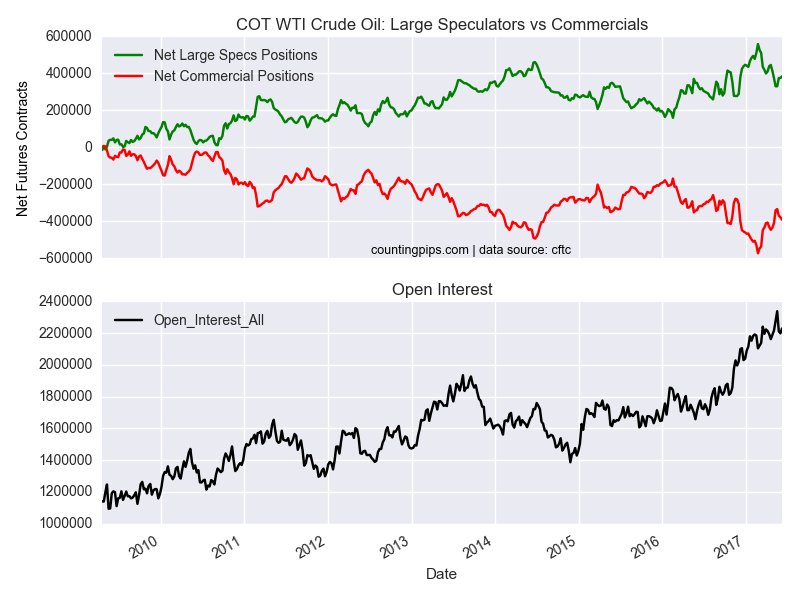
Large speculators added to their bullish net positions in the WTI crude oil futures markets last week for a fourth consecutive week, according to the latest Commitment of Traders (COT) data released by the Commodity Futures Trading Commission (CFTC) on Friday.

The non-commercial contracts of WTI crude futures, traded by large speculators and hedge funds, totaled a net position of 382,469 contracts in the data reported through June 6th. This was a weekly gain of 8,714 contracts from the previous week which had a total of 373,755 net contracts.

Speculative net positions in WTI crude have advanced by +53,718 net contracts in the past four weeks and are now at their highest level since April 25th when the net level totaled +411,822 contracts.

WTI Crude Oil Commercial Positions:

The commercial traders position, categorized by the CFTC as hedgers or traders engaged in buying and selling for business purposes, totaled a net position of -390,819 contracts last week. This was a weekly increase of -13,054 contracts from the total net of -377,765 contracts reported the previous week.

USO Crude Oil ETF:

Over the same weekly reporting time-frame, from Tuesday to Tuesday, the USO Crude Oil ETF, which tracks the price of WTI crude oil, closed at approximately $9.97 which was a decrease of $-0.27 from the previous close of $10.24, according to ETF market data.

*COT Report: The COT data, released weekly to the public each Friday, is updated through the previous Tuesday (data is 3 days old) and shows a quick view of how large speculators or non-commercials (for-profit traders) as well as the commercial traders (hedgers & traders for business purposes) were positioned in the futures markets. The CFTC categorizes trader positions according to commercial hedgers (traders who use futures contracts for hedging as part of the business), non-commercials (large traders who speculate to realize trading profits) and nonreportable traders (usually small traders/speculators). Find CFTC criteria here: (http://www.cftc.gov/MarketReports/CommitmentsofTraders/ExplanatoryNotes/index.htm).

Article by CountingPips.com


10 Year Treasury Note Speculators pulled back on bullish positions for 2nd week

By CountingPips.comGet our weekly COT Reports by Email

10 Year Treasury Note Non-Commercial Positions:

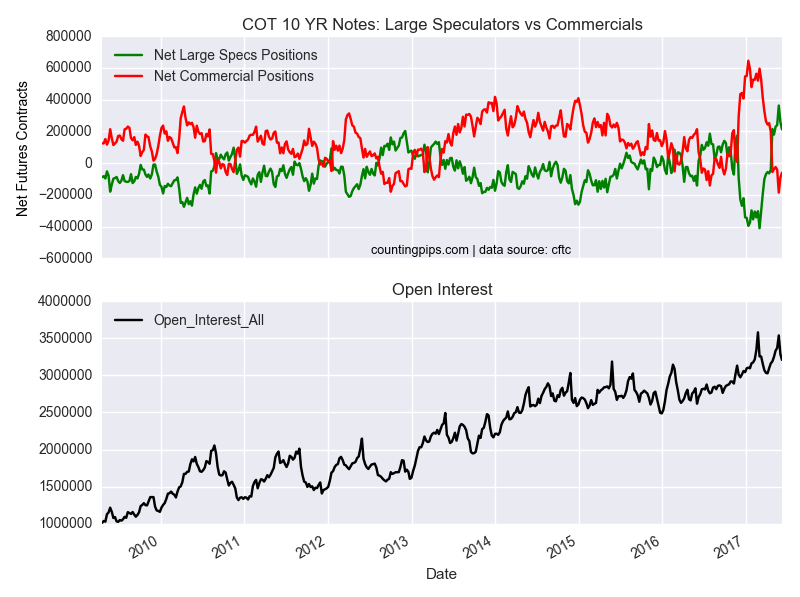
Large speculators reduced their net positions in the 10-year treasury note futures markets last week for a second straight week, according to the latest Commitment of Traders (COT) data released by the Commodity Futures Trading Commission (CFTC) on Friday.

The non-commercial futures contracts of 10-year treasury note futures, traded by large speculators and hedge funds, totaled a net position of 212,066 contracts in the data reported through June 6th. This was a weekly decline of -46,099 contracts from the previous week which had a total of 258,165 net contracts.

Speculative positions have now dropped by -150,435 net contracts over the past two weeks after bullish bets had surged to their best position since 2007 on May 23rd at +362,501 contracts.

10 Year Treasury Note Commercial Positions:

The commercial traders position, categorized by the CFTC as hedgers or traders engaged in buying and selling for business purposes, totaled a net position of -59,974 contracts last week. This was a weekly rise of 30,139 contracts from the total net of -90,113 contracts reported the previous week.

IEF 7-10 Year Bond ETF:

Over the same weekly reporting time-frame, from Tuesday to Tuesday, the 7-10 Year Treasury Bond ETF (IEF) closed at approximately $107.73 which was a gain of $0.62 from the previous close of $107.11, according to ETF market data.

*COT Report: The COT data, released weekly to the public each Friday, is updated through the previous Tuesday (data is 3 days old) and shows a quick view of how large speculators or non-commercials (for-profit traders) as well as the commercial traders (hedgers & traders for business purposes) were positioned in the futures markets. The CFTC categorizes trader positions according to commercial hedgers (traders who use futures contracts for hedging as part of the business), non-commercials (large traders who speculate to realize trading profits) and nonreportable traders (usually small traders/speculators). Find CFTC criteria here: (http://www.cftc.gov/MarketReports/CommitmentsofTraders/ExplanatoryNotes/index.htm).

Article by CountingPips.com