Author Archive for InvestMacro – Page 542

Black Box Vs Know-How Trading In Forex

By ProfessionalTradingSystems.com

Searching in Internet you can find a lot of algorithmic systems vendors who offer so called black box strategies. Black box means that the purchaser buys only a strategy code written for a particular trading platform. So during the trading you don’t know what is happening, why a trade has been opened and closed, you can`t set up the strategy parameters except for the Money management part in most cases.

On the other hand there are people who share their know how with the other traders. They reveal all trading rules and the concepts behind them. Buying this type of product a trader knows exactly why a particular trade has been opened and closed and more importantly he/she can make some changes in order for the system to fit his/her personality.

For example a trader with a short-term mentality can adjust the inputs so the system will produce more trades or change the Stop Loss size so that the strategy will become more aggressive or less aggressive.

I personally avoid buying systems which I cannot control during live trading that’s why our site offers know-how based Forex strategies and reveals all trading rules on the systems for sale.

Buying a black box you cannot verify the validity of any backtested results which is one more pitfall of blackbox trading. There are many examples of great looking backtest results and poor live results because of manipulation of the strategy code or curvefitting.

Usually when a trader purchases a Forex mechanical system he/she eventually makes changes to the rules. It is a rare occasion when a trader trades exactly the same rules as the systems suggest. That is normal and it is OK because as the trader gains more and more experience with the rules he/she starts to have ideas for improving it.

All above mentioned options are impossible with black box trading. So as a bottom line conclusion: buy only systems with revealed trading rules. Black box is a very risky endeavor and should be avoided.

Article by Professional Trading Systems –  Forex Mechanical and Automated Systems


Short-term trading idea FX AUDCAD – bull speculation: price to restore to 1.0327

By Gabriel Ojimadu, Alpari

Trading opportunities for the currency pair: The price has twice rebounded from the S1 line. Because of this, the Aussie dollar is expected to strengthen against its Canadian counterpart as far as the TL1 line with targets of 1.0211 (high point from the 7th of June) and 1.0327. This scenario will not play out if the daily candlestick closes below 0.9948.

Background

The previous idea for the AUDCAD pair was published on 12/09/16. At the time of its publication, the Aussie was trading at 0.9833 against the Canadian. The pair has been caught in a sideways trend for the last 15 weeks. I was expecting the price to exit downwards from there. This prediction should have played out when the price broke into the 0.9780 – 0.9799 range with targets of 0.9718 and 0.9668. This didn’t happen, however, as the price exited a 4-week flat upwards instead.

Current situation

The AUDCAD cross has been in a sideways trend since the 20th of March this year, trading between 0.9925 and 1.0346 (421 pips). In this idea, I’m not expecting the price to exit this range despite the fact that the pair is definitely ready for a new trend.

On Friday, the price closed in the middle of the triangle formation. The price rebounded twice from the S1 line. This shows that buyers don’t want the price to go any lower than this.

The idea is that the Aussie dollar will strengthen against the Canadian up to the TL1 line with targets of 1.0211 (high point from the 7th of June) and 1.0327. A breakout of 1.0107 (high point from the 16th of June) and 1.0123 (S1) will indicate movement in the right direction. This will not play out, however, if the daily candlestick closes below 0.9948.

Notation: TL – trend line, R – resistance, S – support.

Daily chart. Source: TradingView

Is There Still Hope For Higher Oil Prices?

By OilPrice.com

Oil prices have cratered in recent weeks, dipping to their lowest levels in more than seven months and any sense of optimism has almost entirely disappeared. All signs point to a period of “lower for longer” for oil prices, a refrain that is all too familiar to those in the industry.

WTI dipped below $44 per barrel on Tuesday, and the bearish indicators are starting to pile up.

Libya’s production just topped 900,000 bpd, a new multi-year high that is up sharply even from just a few weeks ago. Libyan officials are hoping that they will hit many more milestones in the coming months. Next stop is 1 million barrels per day (mb/d), which Libya hopes to breach by the end of July.

U.S. shale is arguably the biggest reason why prices are floundering again. The rig count has increased for 22 consecutive weeks, rising to 747 as of mid-June, up more than 100 percent from a year ago. Production continues to rise, with output expected to jump by 780,000 bpd this year, according to the IEA. Ultimately, the shale rebound appears to have killed off yet another oil price rally, the latest in a series of still-born price rebounds since the initial meltdown in 2014.

Hedge funds and other money managers slashed their bullish bets on crude oil futures in the latest data release. Sentiment is profoundly pessimistic at this point, and because the IEA, OPEC and EIA recently published very downbeat assessments about the pace of rebalancing, a grim mood will be sticking around for a little while. The next reports from those energy watchers won’t come out for almost another month.

In the meantime, the weekly EIA data on production and inventories will have outsized importance, mainly because it is one of the few concrete indicators that comes out on a routine basis. Analysts are now worried that a string of bearish data could push prices down even further. “We cannot afford to have another build in crude or gasoline,” Bob Yawger, director of futures at Mizuho Securities USA Inc., told Bloomberg before the latest data release. “The market’s just dying for a reason to buy this thing, but you can’t really do that before” the EIA publishes its next batch of weekly data on Wednesday. Gasoline demand also looks weak, just as the summer driving season in the U.S. gets underway, a period of time that typically sees demand rise.

The market got a bit of a reprieve on Wednesday when the EIA reported some decent figures – a drawdown in crude oil inventories by 2.5 million barrels. Also, imports were flat and gasoline stocks fell slightly.

Still, the figures aren’t enough to put the market at ease.

Amid all this doom and gloom, Saudi Arabia’s energy minister Khalid al-Falih tried to put on a brave face, arguing on Monday that the market will “rebalance in the fourth quarter of this year taking into account an increase in shale oil production.” He waved away the recent price drop, dismissing the importance of such short-term movements in the market.

But with WTI dropping below $45 per barrel, most sober oil market analysts are not nearly as sanguine. OPEC’s objective of bringing global crude oil inventories back into five-year average levels is looking increasingly difficult to achieve, at least in the timeframe laid out by the cartel. “There seems to be very low conviction in the market that there really will be any inventory drawdown in the second half of the year,” said Bjarne Schieldrop, chief commodities analyst at SEB AB.

This is like a falling knife right now, I genuinely haven’t seen sentiment this bad ever,” Amrita Sen, the co-founder and chief oil analyst at Energy Aspects, told CNBC on Wednesday. “We have had clients emailing saying they have been trading this for 20 or 30 years and they have never seen something like this.

One pivotal factor that could really cause prices to plunge is if compliance with the agreed upon cuts starts to fray. There are several reasons why some participants might start to abandon their pledges. Russia, for example, tends to produce more oil in summer months, a fact that might tempt them to boost output. Iraq is also eyeing higher production capacity this year. In addition, weak prices could start to undermine the group’s resolve. “Lack of major upside price response to the OPEC output cuts upping the odds of reduced compliance to the agreement in our opinion,” Jim Ritterbusch, president of energy advisory firm Ritterbusch & Associates, wrote in a research note.

Moreover, simmering conflict in the Middle East could continue to grow, threatening to derail cooperation between OPEC members. The conflict between Saudi Arabia and its Gulf allies on the one hand, and Qatar and Iran on the other, could deteriorate. Although that could spark some price gains for crude oil if supplies are affected, it could also undermine the OPEC deal.

One unknown factor that could prevent oil prices from falling further is the possibility that prices floundering in the mid-$40s actually puts a lid on shale production. If U.S. shale underperforms over the next year, the OPEC deal could succeed in balancing the market. But if U.S. shale continues to rise, and OPEC fails to extend its deal beyond the first quarter of 2018, oil could fall to $30 per barrel, according to Fereidun Fesharaki, chairman of consultants FGE.

Link to original article: http://oilprice.com/Energy/Oil-Prices/Is-There-Still-Hope-For-Higher-Oil-Prices.html

By Nick Cunningham of Oilprice.com


Murrey Math Lines 26.06.2017 (EUR/USD, GBP/JPY)

Article By RoboForex.com

EUR USD, “Euro vs US Dollar”

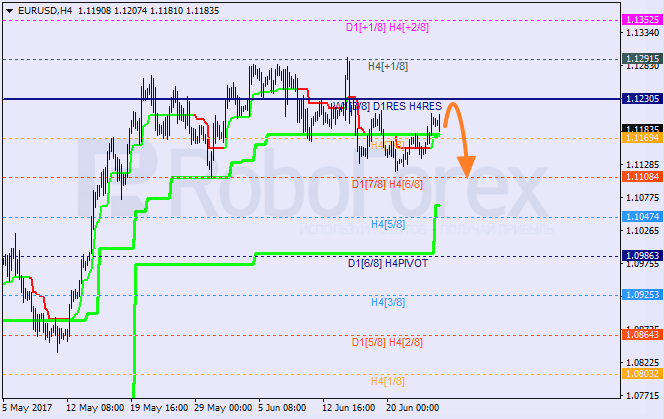
The EUR/USD pair is consolidating above the 8/8 level between Super Trends. On Monday, the price may test the 8/8 level. If the pair rebounds from this level, the market may start a new descending correction towards the 6/8 one.

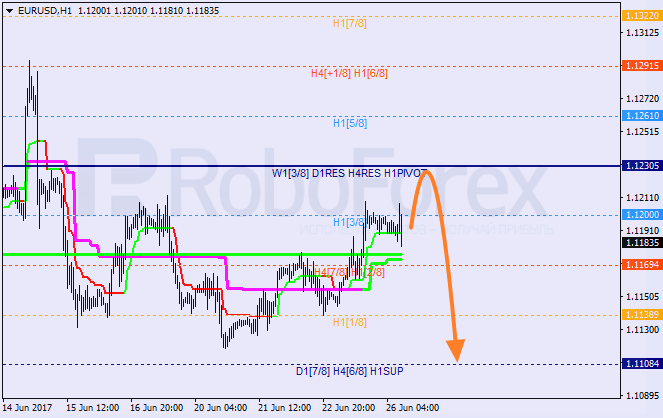
As we can see at the H1 chart, Super Trends formed “bullish cross”. As a result, in the nearest future the price may test the 4/8 level. If the pair rebounds from this level, it will resume falling. In this case, the closest target will be at the 0/8 level.


GBP JPY “Great Britain Pound vs Japanese Yen”

The GBP/JPY pair is testing he 3/8 level and the daily Super Trend again. If the price breaks these levels, the market may start moving upwards to reach the 4/8 level. After reaching it, the pair may start a new local correction.

At the H1 chart, the pair is trying to enter the “overbought zone”. Earlier, Super Trends formed “bullish cross”. On Monday, the price may continue growing towards the +2/8 level. If later this level is broken, the lines at the chart will be redrawn.


RoboForex Analytical Department

Article By RoboForex.com

Attention!
Forecasts presented in this section only reflect the author’s private opinion and should not be considered as guidance for trading. RoboForex LP bears no responsibility for trading results based on trading recommendations described in these analytical reviews.

Short-term trading idea FX EURGBP – bull speculation: strengthening Euro with a jump to 0.8652 expected

By Gabriel Ojimadu, Alpari

Trading opportunities for the currency pair: A W-model has formed on the weekly timeframe. Keep an eye on 0.9083 level. Cycles suggest a slide to 0.8652 by 10/07/17, followed by growth to 0.9081 by 15/08/17.

Background

The previous idea for this currency pair was published on the 15th of May. At the time of publication, the Euro was trading at 0.8482. I was envisaging a breakout of the 2-2 channel, followed by growth to the upper boundary of the 1-1 channel at 0.8590. This target was reached within 3 days.

Current situation

The French elections are now over, so the level of risk on the market has subsided. Emmanuel Macron has been sworn in as the president of France and his party won the parliamentary election over two rounds. In the recently held snap election in the UK, no party was able to win a majority. After the Conservative Party’s failed election campaign, Theresa May is now trying to strike a deal with the Democratic Unionist Party in order to form a working majority in parliament. Brexit talks have formally begun, but they have gotten off to a difficult start. Because of this, the Euro remains on an upwards trend against the British pound.

EURGBP weekly chart. Source: TradingView

For 9 days, the EURGBP pair has been trading below the resistance at 0.8852 (high point from 10/01/17). A W-model has formed on the weekly timeframe, so traders should keep their sights on 0.9083. It’s unclear, however, how quickly this level will be reached.

The price is trading within two upwards channels; A-A and B-B. The price is currently located at the lower boundary of the A-A channel. I think that the price won’t stay here and will slide to 0.8717. According to cyclical analysis, we have the following scenario: a fall to 0.8652 by 10/07/17, followed by growth to 0.9081 by 15/08/17.

Fast oscillators on the daily and weekly timeframes are pointing downwards. Because of this, I don’t see the resistance at 0.8851 being broken at this stage. It would be better or course if the price stays within the B-B channel. In such a case, the likelihood of reaching 0.9078 will be significantly higher.

Forex Technical Analysis & Forecast 26.06.2017 (EUR/USD, GBP/USD, USD/CHF, USD/JPY, AUD/USD, USD/RUB, GOLD, BRENT)

Article By RoboForex.com

EUR USD, “Euro vs US Dollar”

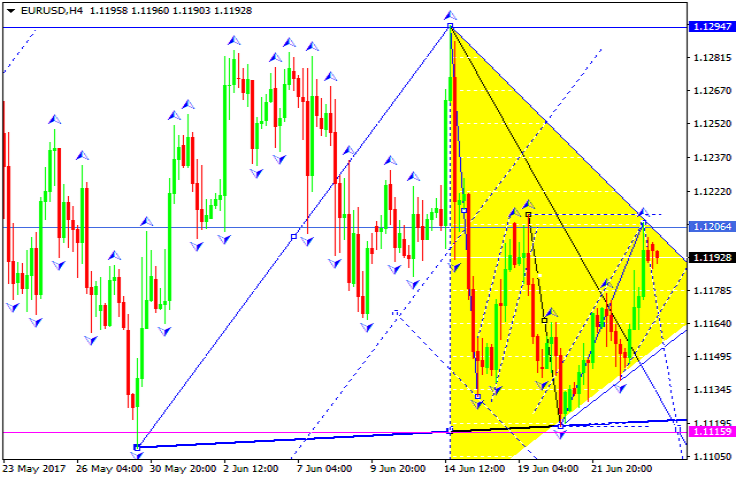
The EUR/USD pair has almost completed the correction at 1.1206. Later, in our opinion, the market may continue moving downwards to reach 1.1116. After breaking it, the price may continue falling inside the downtrend with the local target at 1.1025.


GBP USD, “Great Britain Pound vs US Dollar”

The GBP/USD pair is still being corrected with the target at 1.2759. After that, the instrument may fall towards 1.2698 and then grow to reach 1.2817. Possibly, the price may test 1.2864 from below and then continue falling inside the downtrend to reach 1.2587.


USD CHF, “US Dollar vs Swiss Franc”

The USD/CHF pair has almost completed the correction. We think, today the price may form another ascending structure towards 0.9732. Later, in our opinion, the market may break this level and grow to reach 0.9800 or even the local target at 0.9900.


USD JPY, “US Dollar vs Japanese Yen”

The USD/JPY pair is still consolidating around 111.11. The main scenario implies that the price may fall to reach the target at 109.86.


AUD USD, “Australian Dollar vs US Dollar”

The AUD/USD pair is still consolidating around 0.7566. Possibly, the price may test 0.7585 from below and then continue falling inside the downtrend towards 0.7500.


USD RUB, “US Dollar vs Russian Ruble”

The USD/RUB pair is falling towards 58.86. After that, the instrument may grow to reach 59.60 and then start another decline with the target at 57.60.


XAU USD, “Gold vs US Dollar”

Gold has almost completed the correction. Possibly, the price may fall to reach 1237.31. Later, in our opinion, the market may be corrected towards 1239.15.


BRENT

Brent has almost reached the target of the ascending impulse. Possibly, the price may extend it towards 46.60. After that, the instrument may fall to reach 45.60 and then grow with the target at 49.10.


RoboForex Analytical Department

Article By RoboForex.com

Attention!
Forecasts presented in this section only reflect the author’s private opinion and should not be considered as guidance for trading. RoboForex LP bears no responsibility for trading results based on trading recommendations described in these analytical reviews.

EURUSD: Friday against Monday

By Gabriel Ojimadu, Alpari

Previous:

Trading on the Euro closed up on Friday. The Euro appreciated against the US dollar and British pound during the New York session. The EURUSD rose to 1.1209 and the EURGBP rose to 0.8805.

It was strange for me when the price jumped from 1.1162 for seemingly no reason. That is to say, before the news, buyers neutralized a bearish signal that had been 60% exhausted.

US data provided support for the single currency, which reported a low level of business activity in the country. The PMIs from Markit on the manufacturing and services industries turned out lower than expected. New home sales turned out higher than expected, but this wasn’t enough to stop the dollar from falling.

Day’s news (GMT+3):

  • 11:00 Germany: IFO business climate (Jun);
  • 11:30 UK: BBA mortgage approvals (May);
  • 15:30 USA: durable goods orders ex transportation (May);
  • 15:30 USA: durable goods orders (May);
  • 20:30 Euro zone: ECB president Mario Draghi’s speech.

EURUSD rate on the hourly. Source: TradingView.

Intraday forecast: low: n/a, high: n/a, close: n/a.

The price has restored to the 19th of June’s maximum. The price has been consolidating at 1.1195 level for the last 14 hours. Given that the Euro strengthened on Friday, I’m expecting it to fall today.

I’ve depicted an upwards channel created from three points (H: 1.1178, H: 1.1209, L: 1.11390). My forecast goes as far as the lower boundary of the channel at 1.1177. When the price reaches this level, I’ll continue this forecast.

Cycles indicate that the Euro will weaken before trading closes, so I need to see how quickly it will reach the lb balance line and whether or not it will stop buyers in their tracks. I’m ignoring all news today.

How To Evaluate A Mechanical System

By ProfessionalTradingSystems.com

Every trader has his own set of parameters with which he evaluates whether a particular system is good for real trading or not. Most people use different coefficients and metrics and in this article I`d like to show my own criteria.

Mainly I want to know 4 basic things about every algorithmic trading system:

  • How much can you gain per year – to obtain this measure you just need to calculate the simple  average of the performances of all years included in the backtest. So, if you have 3 years of backtestested period with 30%, 40% and 50%, then obviously the Average Annual Return is 40%. Knowing the the potential without knowing the risk is very dangerous, that`s why we need the second measure.
  • How big is the downside – Actually this is the size of the Maximum Drawdown and is measured from the peak-to-trough. Here we understand what risk is involved in trading the system, assuming of course that MaxDD could be bigger or smaller in the future. Here are are talking about the MaxDD for the entire period of testing not drawdown for any particular year.
  • The above mentioned measures are united in one single coefficient –  Return-to-Risk-Ratio. When you divide Average Annual Return to MaxDD you can see the quality of any mechanical system much better. Now you know how much you can gain adjusted to the risk you have to take trading the system.
  • How much the strategy depends on brokers quality – When a system makes 1-2 pips per trade on average it is very dependent on broker`s quality, its spreads and trades`filling. Slippage of 0.5 pips per trade is normal for some strategies and you can wipe out half of your gain when you subtract slippage form your backtestetd results. Usually this kind if strategies are scalpers.  The more you gain in pips on average, the better. Our Portfolio for example has 7-8 pips per trade on average, so if you subcontract a very big slippage of 1 pip it will still remain a very profitable set of systems.

As every part of my trading I try to stick to very simple rules and measures. I am focusing only on the most important things which I`d like to be answered and then I find a simple way to answer to my questions via math ratios.

So with our example I want to know much can I gain per year, how much is the risk and how much I depend on choosing a broker.

Remember that when you see an equity curve you almost instantaneously know whether a system is good and bad for real trading. Nice growing line is invaluable. The measures are just tools to qualify and compare different systems with more ease.

Article by Professional Trading Systems –  Forex Mechanical and Automated Systems


COT: US Dollar, 10YR bets rise. Gold, Crude Oil, Silver bets drop sharply

By CountingPips.com

Here is a short summary and this week’s links (below) to the latest Commitment of Traders changes.

– Speculators slightly boosted USD bullish bets last week

WTI crude oil speculator bets have fallen 2 weeks and by over -50,000 contracts

– The 10-year note speculators added to bullish bets for 2nd week, above +300,000 contracts

Gold speculative bets fell for 2nd week and by over -53,000 contracts in 2 weeks

Silver bets dropped for a 2nd week and to the lowest level in five weeks

Copper spec bets continued to stay above the +10,000 level for the past three weeks

– Large S&P500 raised bets for 3rd week and into bullish territory


FX Speculators raised US Dollar bullish bets, Euro & Peso bets drop

US Dollar net speculator positions leveled at $7.82 billion last week

The latest data for the weekly Commitment of Traders (COT) report, released by the Commodity Futures Trading Commission (CFTC) on Friday, showed that large traders and currency speculators slightly raised their bullish bets for the US dollar last week. See full article


WTI Crude Oil Speculators sharply dropped bullish bets for 2nd week

The non-commercial contracts of WTI crude futures totaled a net position of 328,764 contracts, according to data from last week. This was a change of -30,235 contracts from the previous weekly total. See full article


Gold Speculators sharply reduced bullish net positions for 2nd week

The large speculator contracts of gold futures declined to a total net position of 150,675 contracts. This was a weekly change of -39,599 contracts from the previous week. See full article


10-Year Note Speculators sharply boosted bullish net positions for 2nd week

The large speculator contracts of 10-year treasury note futures totaled a net position of 345,172 contracts. This was a weekly change of 71,203 contracts from the previous week. See full article


S&P500 Speculators lifted bets into a new bullish position

The large speculator contracts of S&P 500 futures totaled a net position of 1,746 contracts. This was a change of 7,212 contracts from the reported data of the previous week. See full article


Silver Speculators sharply decreased bullish positions, down for 2nd week

The non-commercial contracts of silver futures totaled a net position of 46,681 contracts, according to data from last week. This was a weekly change of -13,977 contracts from the previous totals. See full article


Copper Speculators decreased bullish net positions

The large speculator contracts of copper futures totaled a net position of 12,779 contracts. This was a weekly change of -6,019 contracts from the data of the previous week. See full article


Article by CountingPips.com

The Commitment of Traders report data is published in raw form every Friday by the Commodity Futures Trading Commission (CFTC) and shows the futures positions of market participants as of the previous Tuesday (data is reported 3 days behind).

To learn more about this data please visit the CFTC website at http://www.cftc.gov/MarketReports/CommitmentsofTraders/index.htm


FX Speculators raised US Dollar bullish bets, Euro & Peso bets drop

By CountingPips.comGet our weekly COT Reports by Email

US Dollar net speculator positions rose to $7.82 billion last week

The latest data for the weekly Commitment of Traders (COT) report, released by the Commodity Futures Trading Commission (CFTC) on Friday, showed that large traders and currency speculators slightly raised their bullish bets for the US dollar last week.

Non-commercial large futures traders, including hedge funds and large speculators, had an overall US dollar long position totaling $7.82 billion as of Tuesday June 20th, according to the latest data from the CFTC and dollar amount calculations by Reuters. This was a weekly gain of $1.34 billion from the $6.48 billion total long position that was registered the previous week, according to the Reuters calculation (totals of the US dollar contracts against the combined contracts of the euro, British pound, Japanese yen, Australian dollar, Canadian dollar and the Swiss franc).

The dollar speculative position has remained under the $10 billion level for the past five weeks after staying above that level for a span of thirty-three straight weeks from October 4th 2016 to May 15th 2017.


Weekly Speculator Contract Changes:

The individual major currency contracts saw some sharp movements this week with five major currencies seeing weekly changes above the 10,000 contract mark.

  • The euro saw its speculator position fall for the first time in nine weeks and after rising to the best position since 2011.
  • The Mexican peso positions dropped very sharply after it had reached its highest speculator position level since May of 2013 and had risen for the previous three weeks.
  • The Australian dollar rose back into an overall bullish position after a few weeks in bearish territory while the New Zealand dollar rose higher into bullish territory with its fifth straight week gain in spec positions.
  • The Swiss franc speculator positions gained for a fifth week as well and are now at the least bearish level since December 2016.

The list of all the major currencies that improved against the US dollar last week includes the British pound sterling (1,837 weekly change in contracts), Japanese yen (594 contracts), Swiss franc (11,478 contracts), Canadian dollar (5,714 contracts), Australian dollar (16,544 contracts) and the New Zealand dollar (19,860 contracts).

The currencies whose speculative bets declined last week versus the dollar were the euro (-34,201 weekly change in contracts) and the Mexican peso (-46,829 contracts).


Table of Weekly Commercial Traders and Speculators Levels & Changes:

CurrencyNet CommercialsComms Weekly ChgNet SpeculatorsSpecs Weekly Chg
EuroFx-60,15529,77344,852-34,201
GBP42,276-1,616-37,6041,837
JPY68,0127,116-49,959594
CHF2,455-12,261-2,98211,478
CAD85,766-12,327-82,8815,714
AUD-14,197-20,72215,03316,544
NZD-22,739-20,39621,45519,860
MXN-55,82446,87448,985-46,829


This latest COT data is through Tuesday and shows a quick view of how large speculators or non-commercials (for-profit traders) as well as the commercial traders (hedgers & traders for business purposes) were positioned in the futures markets. All currency positions are in direct relation to the US dollar where, for example, a bet for the euro is a bet that the euro will rise versus the dollar while a bet against the euro will be a bet that the dollar will gain versus the euro.


Weekly Charts: Large Trader Weekly Positions vs Price

EuroFX:


British Pound Sterling:


Japanese Yen:


Swiss Franc:


Canadian Dollar:


Australian Dollar:


New Zealand Dollar:


Mexican Peso:


*COT Report: The weekly commitment of traders report summarizes the total trader positions for open contracts in the futures trading markets. The CFTC categorizes trader positions according to commercial hedgers (traders who use futures contracts for hedging as part of the business), non-commercials (large traders who speculate to realize trading profits) and nonreportable traders (usually small traders/speculators). Find CFTC criteria here: (http://www.cftc.gov/MarketReports/CommitmentsofTraders/ExplanatoryNotes/index.htm).

The Commitment of Traders report is published every Friday by the Commodity Futures Trading Commission (CFTC) and shows futures positions data that was reported as of the previous Tuesday (3 days behind).

Each currency contract is a quote for that currency directly against the U.S. dollar, a net short amount of contracts means that more speculators are betting that currency to fall against the dollar and a net long position expect that currency to rise versus the dollar.

(The charts overlay the forex closing price of each Tuesday when COT trader positions are reported for each corresponding spot currency pair.) See more information and explanation on the weekly COT report from the CFTC website.

Article by CountingPips.com