Author Archive for InvestMacro – Page 543

10-Year Note Speculators sharply boosted bullish net positions for 2nd week

By CountingPips.comReceive our weekly COT Reports by Email

10-Year Note Non-Commercial Speculator Positions:

Large speculators sharply pushed bullish net positions in the 10-Year Note futures markets higher this week, according to the latest Commitment of Traders (COT) data released by the Commodity Futures Trading Commission (CFTC) on Friday.

The non-commercial futures contracts of 10-Year Note futures, traded by large speculators and hedge funds, totaled a net position of 345,172 contracts in the data reported through Tuesday June 20th. This was a weekly advance of 71,203 contracts from the previous week which had a total of 273,969 net contracts.

Speculative 10-year note positions have rebounded strongly in the past two weeks and by over at total of +130,000 contracts after falling sharply on May 30th (-104,336 contracts) and June 6th (-46,099 contracts). Overall spec positions are now at the highest level in a month and back over the +300,000 contract mark for the second time in five weeks.

10-Year Note Commercial Positions:

The commercial traders position, categorized by the CFTC as hedgers or traders engaged in buying and selling for business purposes, totaled a net position of -200,875 contracts on the week. This was a weekly drop of -84,582 contracts from the total net of -116,293 contracts reported the previous week.

IEF ETF:

Over the same weekly reporting time-frame, from Tuesday to Tuesday, the 7-10 Year Treasury Bond ETF (IEF) closed at approximately $107.68 which was a boost of $0.40 from the previous close of $107.28, according to unofficial market data.

*COT Report: The COT data, released weekly to the public each Friday, is updated through the most recent Tuesday (data is 3 days old) and shows a quick view of how large speculators or non-commercials (for-profit traders) as well as the commercial traders (hedgers & traders for business purposes) were positioned in the futures markets. The CFTC categorizes trader positions according to commercial hedgers (traders who use futures contracts for hedging as part of the business), non-commercials (large traders who speculate to realize trading profits) and nonreportable traders (usually small traders/speculators). Find CFTC criteria here: (http://www.cftc.gov/MarketReports/CommitmentsofTraders/ExplanatoryNotes/index.htm).

Article by CountingPips.comWeekly COT Report


Silver Speculators sharply decreased bullish positions, down for 2nd week

By CountingPips.comReceive our weekly COT Reports by Email

Silver Non-Commercial Speculator Positions:

Large speculators cut back on their net positions in the Silver futures markets this week, according to the latest Commitment of Traders (COT) data released by the Commodity Futures Trading Commission (CFTC) on Friday.

The non-commercial futures contracts of Silver futures, traded by large speculators and hedge funds, totaled a net position of 46,681 contracts in the data reported through Tuesday June 20th. This was a weekly lowering of -13,977 contracts from the previous week which had a total of 60,658 net contracts.

Silver speculative positions have now fallen for two straight weeks and to the lowest level in five weeks.

Silver Commercial Positions:

The commercial traders position, categorized by the CFTC as hedgers or traders engaged in buying and selling for business purposes, totaled a net position of -58,834 contracts on the week. This was a weekly increase of 13,079 contracts from the total net of -71,913 contracts reported the previous week.

SLV ETF:

Over the same weekly reporting time-frame, from Tuesday to Tuesday, the SLV ishares ETF, which tracks the price of silver, closed at approximately $15.59 which was a decrease of $-0.36 from the previous close of $15.95, according to unofficial market data.

*COT Report: The COT data, released weekly to the public each Friday, is updated through the most recent Tuesday (data is 3 days old) and shows a quick view of how large speculators or non-commercials (for-profit traders) as well as the commercial traders (hedgers & traders for business purposes) were positioned in the futures markets. The CFTC categorizes trader positions according to commercial hedgers (traders who use futures contracts for hedging as part of the business), non-commercials (large traders who speculate to realize trading profits) and nonreportable traders (usually small traders/speculators). Find CFTC criteria here: (http://www.cftc.gov/MarketReports/CommitmentsofTraders/ExplanatoryNotes/index.htm).

Article by CountingPips.comWeekly COT Report


S&P500 Speculators lifted bets into a new bullish position

By CountingPips.comReceive our weekly COT Reports by Email

S&P500 Non-Commercial Speculator Positions:

Large speculators boosted their net positions in the S&P500 futures markets this week and turned their overall positions back into a bullish net standing, according to the latest Commitment of Traders (COT) data released by the Commodity Futures Trading Commission (CFTC) on Friday.

The non-commercial futures contracts of S&P500 futures, traded by large speculators and hedge funds, totaled a net position of 1,746 contracts in the data reported through Tuesday June 20th. This was a weekly increase of 7,212 contracts from the previous week which had a total of -5,466 net contracts.

The large SP500 speculators have raised their bets for three straight weeks and have now brought the net position into bullish territory for the first time since April 25th (a span of seven weeks in bearish territory).

S&P500 Commercial Positions:

The commercial traders position, categorized by the CFTC as hedgers or traders engaged in buying and selling for business purposes, totaled a net position of -8,380 contracts on the week. This was a weekly loss of -8,639 contracts from the total net of 259 contracts reported the previous week.

SPY ETF:

Over the same weekly reporting time-frame, from Tuesday to Tuesday, the SPY ETF, which tracks the price of S&P500 Index, closed at approximately $243.01 which was a fall of $-0.35 from the previous close of $243.36, according to unofficial market data.

*COT Report: The COT data, released weekly to the public each Friday, is updated through the most recent Tuesday (data is 3 days old) and shows a quick view of how large speculators or non-commercials (for-profit traders) as well as the commercial traders (hedgers & traders for business purposes) were positioned in the futures markets. The CFTC categorizes trader positions according to commercial hedgers (traders who use futures contracts for hedging as part of the business), non-commercials (large traders who speculate to realize trading profits) and nonreportable traders (usually small traders/speculators). Find CFTC criteria here: (http://www.cftc.gov/MarketReports/CommitmentsofTraders/ExplanatoryNotes/index.htm).

Article by CountingPips.comWeekly COT Report


Ichimoku Cloud Analysis 23.06.2017 (GBP/USD, GOLD)

Article By RoboForex.com

GBP USD, “Great Britain Pound vs US Dollar”

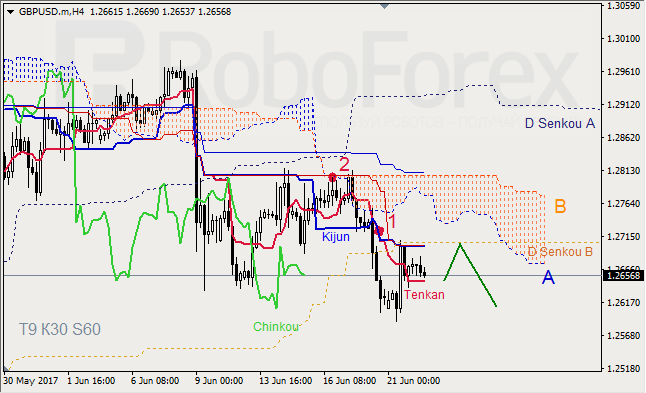
GBP USD, Time Frame H4. Indicator signals: Tenkan-Sen and Kijun-Sen ran into one another below Kumo Cloud, they may intersect and form “Golden Cross” (1). Ichimoku Cloud is closed (2), Chinkou Lagging Span is close to the chart, and the price is near the cloud’s downside border. Short-term forecast: we can expect resistance from Senkou Span A and support from D Senkou Span B.

GBP USD, Time Frame H1. Indicator signals: Tenkan-Sen and Kijun-Sen intersected near Kumo’s upside border and formed “Golden Cross” (1). Ichimoku Cloud is going up (2), Chinkou Lagging Span is above the chart, and the price is above the lines. Short-term forecast: we can expect support from Tenkan-Sen, and growth of the price.


XAU USD, “Gold vs US Dollar”

XAU USD, Time Frame H4. Indicator signals: Tenkan-Sen and Kijun-Sen are intersecting below Kumo Cloud and forming “Golden Cross” (1); Tenkan-Sen is directed to the upside. Ichimoku Cloud is still moving downwards (2), Chinkou Lagging Span is on the chart, and the price is on D Tenkan-Sen. Short‑term forecast: we can expect resistance from Senkou Span A, support from Tenkan-Sen, and attempts of the price to fix inside the cloud.


RoboForex Analytical Department

Article By RoboForex.com

Attention!
Forecasts presented in this section only reflect the author’s private opinion and should not be considered as guidance for trading. RoboForex LP bears no responsibility for trading results based on trading recommendations described in these analytical reviews.

EURUSD: Euro has stalled around 1.1140

By Gabriel Ojimadu, Alpari

Previous:

On Thursday, trading on the EURUSD pair closed down. The Euro fell against the dollar, but it was a reluctant retreat. US 10Y bond yields didn’t manage to consolidate above 2.166% and fell to 2.145%. In the end, the price rebounded from 1.1139 and returned to 1.1155.

Data from the US session:

  • The index of leading indicators in the US grew by 0.3% in May (forecast: 0.4%, previous reading: 0.2%).
  • The number of work unemployment benefit claimants in the US rose to 241,000 (forecast: 240,000, previous reading: 238,000).
  • The retail sales index in Canada grew by 0.8% for the month (forecast: 0.2%, previous reading: 0.5%). The retail sales index ex autos grew by 1.5% (forecast: 0.7%, previous reading: -0.1%).

Day’s news (GMT+3):

  • 10:30 Germany: Markit services PMI (Jun), Markit manufacturing PMI (Jun);
  • 11:00 Euro zone: Markit services PMI (Jun), Markit manufacturing PMI (Jun);
  • 15:30 Canada: CPI (May), CPI core (May);
  • 16:45 USA: Markit services PMI (Jun), Markit manufacturing PMI (Jun);
  • 17:00 USA: new home sales (May);
  • 18:15 USA: Fed’s Bullard speech;
  • 19:40 USA: FOMC member Mester speech;
  • 20:00 USA: Baker Hughes US oil rig count.

EURUSD rate on the hourly. Source: TradingView.

Intraday forecast: low: n/a, high: n/a, close: n/a.

Since trading opened in Asia, the Euro has restored to 1.1165. The Euro appreciated against the greenback as US 10Y bond yields also grew. I believe that this strengthening was brought about by the bump in oil prices.

I’ve shown two potential scenarios on the chart, both of which are relevant at the time of writing. The main EURGBP cross and 10Y bond yields are both in a sideways trend. Oil is on the rise, which is supporting the commodity currencies. If the EURGBP cross opens up and US bond yields open down, the Euro will move towards 1.12.

I think that it’s better to hold off on making any trading decisions today until the London session opens and the Asian session closes.

I think the scenario in which the Euro slides to the 45th degree at 1.1225 is the most likely outcome. In order for this to happen, we need to see US bond yields and the EURGBP cross grow over the course of the next day. In such a case, the strengthening of commodity currencies on the back of an oil surge won’t be able to stop sellers. Yesterday, they were unable to break out of the lower boundary of the channel. Today, this line runs through 1.1147. The faster this is broken through, the higher the probability of renewing the minimum at 1.1119. If they fail, we can expect a rally for the Euro over the following few days.

Forex Technical Analysis & Forecast 23.06.2017 (EUR/USD, GBP/USD, USD/CHF, USD/JPY, AUD/USD, USD/RUB, GOLD, BRENT)

Article By RoboForex.com

EUR USD, “Euro vs US Dollar”

The EUR/USD pair is still consolidating and right now is forming the ascending structure to reach 1.1180. Later, in our opinion, the market may fall towards the downside border of the range. After breaking it, the price may reach 1.1065 and then start another correction with the target at 1.1190.


GBP USD, “Great Britain Pound vs US Dollar”

The GBP/USD pair is still forming the fifth descending wave with the target at 1.2567 and right now is consolidating below 1.2719. The main scenario implies that the price may and then continue falling inside the downtrend to reach the above-mentioned target. After that, the instrument may be corrected towards 1.2808.


USD CHF, “US Dollar vs Swiss Franc”

The USD/CHF pair has completed the descending structure towards the downside border of the range, but is still consolidating around 0.9724. The main scenario implies that the price may continue growing to reach 0.9785. Later, in our opinion, the market may fall towards 0.9744 and then move upwards with the local target at 0.9850.


USD JPY, “US Dollar vs Japanese Yen”

The USD/JPY pair is falling to reach 110.78. And that’s just a half of the wave. The local target at 109.89. this decline may be considered as the start of the fifth wave towards 106.50.


AUD USD, “Australian Dollar vs US Dollar”

Being under pressure, the AUD/USD pair is moving upwards. Possibly, the price may test 0.7566 from below and then fall towards the local target at 0.7508. Later, in our opinion, the market may grow to reach 0.7566 and then start another decline with the target at 0.7500.


USD RUB, “US Dollar vs Russian Ruble”

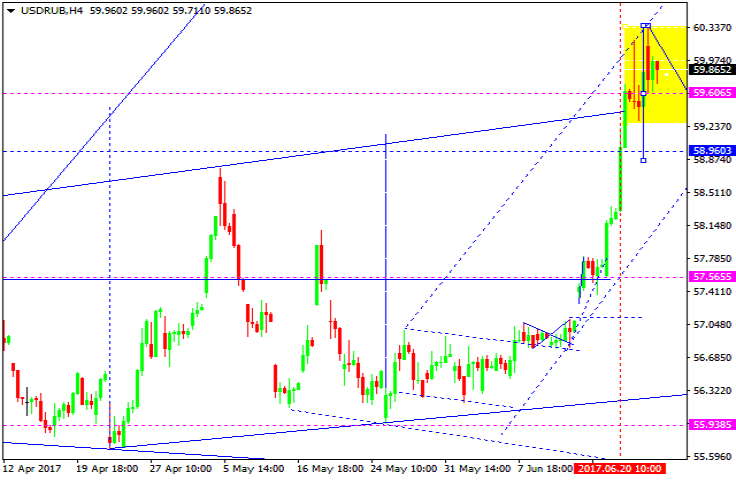
The USD/RUB pair has formed the consolidation range above 59.60. We think, today the price may break it downwards and reach 58.96. After that, the instrument may grow towards 59.60.


XAU USD, “Gold vs US Dollar”

Gold is forming another ascending structure to reach 1255.68. Later, in our opinion, the market may fall towards the local target at 1237.31.


BRENT

Brent is forming the ascending impulse towards 46.11. After that, the instrument may fall to reach 45.60, thus forming another consolidation range. The main scenario implies that the price may break this range upwards. the first upside target is at 48.85.


RoboForex Analytical Department

Article By RoboForex.com

Attention!
Forecasts presented in this section only reflect the author’s private opinion and should not be considered as guidance for trading. RoboForex LP bears no responsibility for trading results based on trading recommendations described in these analytical reviews.

Japanese Candlesticks Analysis 22.06.2017 (EUR/USD, USD/JPY)

Article By RoboForex.com

EUR USD, “Euro vs. US Dollar”

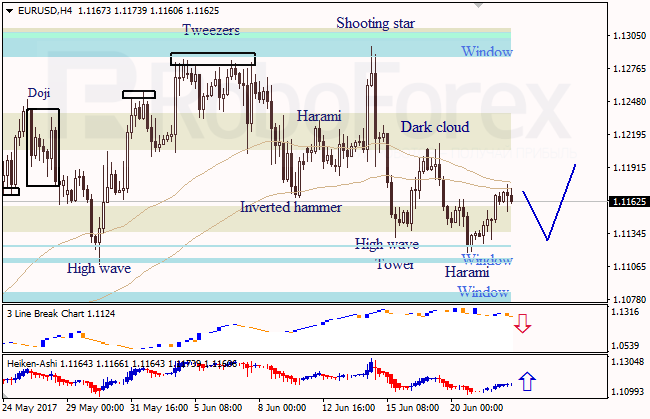
At the H4 chart of EUR USD, bullish Harami pattern indicated an ascending movement. The Window in the middle provided support. Three Line Break chart shows a bearish direction; Heiken Ashi candlesticks confirm the ascending movement.

At the H1 chart of EUR USD, bearish Harami pattern indicates a descending correction. The downside Window provided support. Three Line Break chart and Heiken Ashi candlesticks confirm a bearish direction.


USD JPY, “US Dollar vs. Japanese Yen”

At the H4 chart of USD JPY, bullish High Wave pattern indicates an ascending movement. The upside Window is a resistance level. Three Line Break chart and Heiken Ashi candlesticks confirm a bullish direction.


RoboForex Analytical Department

Article By RoboForex.com

Attention!
Forecasts presented in this section only reflect the author’s private opinion and should not be considered as guidance for trading. RoboForex LP bears no responsibility for trading results based on trading recommendations described in these analytical reviews.

Ichimoku Cloud Analysis 22.06.2017 (GBP/USD, GOLD)

Article By RoboForex.com

GBP USD, “Great Britain Pound vs US Dollar”

GBP USD, Time Frame H4. Indicator signals: Tenkan-Sen and Kijun-Sen intersected below Kumo Cloud and formed “Dead Cross” (1). Ichimoku Cloud is heading down (2), Chinkou Lagging Span is below the chart, and the price is between Tenkan-Sen and Kijun-Sen. Short-term forecast: we can expect resistance from D Senkou Span B, and decline of the price.

GBP USD, Time Frame H1. Indicator signals: Tenkan-Sen and Kijun-Sen intersected below Kumo Cloud and formed “Golden Cross” (1), but right now they are getting closer again. Ichimoku Cloud is going up (2), Chinkou Lagging Span is very close to the chart, and the price is inside Kumo. Short-term forecast: we can expect resistance from Tenkan-Sen and support from the cloud’s downside border.


XAU USD, “Gold vs US Dollar”

XAU USD, Time Frame H4. Indicator signals: Tenkan-Sen and Kijun-Sen are close to each other, they may intersect and form “Golden Cross” (1). Ichimoku Cloud is still moving downwards (2), Chinkou Lagging Span is on the chart, and the price is on Kijun-Sen. Short‑term forecast: we can expect support from D Senkou Span A and resistance from the cloud’s downside border.


RoboForex Analytical Department


Article By RoboForex.com

Attention!
Forecasts presented in this section only reflect the author’s private opinion and should not be considered as guidance for trading. RoboForex LP bears no responsibility for trading results based on trading recommendations described in these analytical reviews.

EURUSD: correctional movement following same path as on the 15th of June

By Gabriel Ojimadu, Alpari

Previous:

The EURUSD pair closed up at the end of Wednesday’s trading. The price has returned below the trend line, which was broken through on the 20th of June. This was brought about by the impact of Andy Haldane’s speech, chief economist at the Bank of England, as well as by US bond yields and US data. The pair spent most of the day in a sideways trend, trading within a 30-pip range.

As sterling was given a boost, the Euro against the dollar rose to 1.1156. It came back down to 1.1130 after certain developments in the news. US data, which saw a higher-than-expected level of existing home sales, provided support for the US dollar. After trading closed in Europe, the trend line was broken through against the backdrop of falling US bond yields. The rate rose to 1.1169.

US data:

There were 5.62 million existing home sales in the US in May (forecast: 5.55, previous reading: 5.56).

Day’s news:

  • 11:00 Euro zone: ECB economic bulletin;
  • 13:00 UK: CBI industrial trend survey – orders (Jun);
  • 15:30 Canada: retail sales (Apr);
  • 15:30 USA: initial jobless claims (16 Jun);
  • 16:00 USA: housing price index (Apr);
  • 17:00 Euro zone: consumer confidence (Jun);
  • 17:00 USA: CB leading indicators (May);
  • 21:00 UK: MPC member Forbes’ speech.

EURUSD rate on the hourly. Source: TradingView.

Intraday forecast: low: 1.1132/19, high: 1.1177, close: n/a.

On Wednesday, sellers tried to launch an assault on 1.11 level, but gave up after the close of the European session. The price restored to 1.1172. The rebound from the low point of 1.1119 amounted to 45 degrees.

After the breakout of the trend line, the situation again became conflicted. On the one hand, the upwards movement is reminiscent of the rise in quotes from the low of 1.1132 (15th of June) to 1.1213. I’ve taken an exact copy of the movement seen during the 15th and 16th of June and imposed it on today’s chart, starting at the low of 1.1119. One should expect a slide from here. Oil is down and the Euro has yet to recover from the effects of its collapse.

On the other hand, gold and yen have appreciated, signaling a move towards safe haven assets. The Euro, as a funding currency, could appreciate against the dollar on the back of a drop in stock indices. Cycles also suggest the Euro will strengthen.

In Asia, US 10Y bond yields are trading down, but their current value is within yesterday’s range. There’s nothing more to say about it at this point. We need to wait until they exit this range.

My position is currently to stay out of the market. However, I would really like to see the historical pattern work out here and to see a rebound from the 45th degree. Given the gentle slope of the upwards movement, I’m staying in the bear camp.

Wave Analysis 21.06.2017 (EUR/USD, GBP/USD, USD/JPY, AUD/USD)

Article By RoboForex.com

EUR USD, “Euro vs US Dollar”

It looks like after completing the diagonal triangle in the wave [5] of c, the EUR/USD pair finished the wave [a] or [w]. Possibly, the wave (i) is taking the form of the wedge. To confirm a new decline, the market has to complete the above mentioned pattern.

More detailed structure is shown on the H1 chart. It’s highly likely that the pair finished the third wave in the wave (i) and right now is being corrected. Later, the price may form the bearish wave v of (i).


GBP USD, “Great Britain Pound vs US Dollar”

It’s highly likely that after completing the zigzag in the wave (4), the GBP/USD pair started falling in the wave (5). As a result, after finishing the correction, the price may continue moving downwards in the wave [iii] of 3 of (5).

As we can see at the H1 chart, after completing the diagonal triangle in the wave [c] of 2 several days ago and then the impulse in the wave [i] of 3, yesterday the pair finished the wave [ii] of 3. Later, after finishing the correction, the market may resume moving downwards in the wave (iii).


USD JPY, “US Dollar vs Japanese Yen”

It’s highly likely that after finishing the ascending impulse in the wave (i), the USD/JPY pair completed the wave (ii) at the end of the last week. Consequently, in the future the market may continue growing in the wave (iii).

At the H1 chart, the price completed the ascending in the wave [1] and then started a new correction. The pair may yet continue forming the wave [2], which may later be followed by a new growth.


AUD USD, “Australian Dollar vs US Dollar”

Probably, the AUD/USD pair completed the wave (y) and the entire double zigzag[ii]. To confirm a new decline, the price has to form the bearish impulse in the wave (i) of [iii].

At the H1 chart, the pair finished the impulse in the wave c of (y) and right now is falling in the wave (i), which may continue during the next several days.


RoboForex Analytical Department


Article By RoboForex.com

Attention!
Forecasts presented in this section only reflect the author’s private opinion and should not be considered as guidance for trading. RoboForex LP bears no responsibility for trading results based on trading recommendations described in these analytical reviews.