Author Archive for InvestMacro – Page 541

Crude Oil Sinks 20%: Why “Oversupply” Isn’t the Half of It

Oil prices have defied bullish efforts to curb oversupply. Here’s our take on why.

By Elliott Wave International

I have a friend… let’s call him Larry. Let’s just say, Larry is not a fan of taking risks. He likes his reflexes fast, his cars slow, and his financial markets secure for the long haul.

So, when Larry called me up at the beginning of this year to say he’s boarding the highly-volatile crude oil market, I was appropriately stunned. But here’s the thing. He was still being “wary Larry,” meticulously weighing the risks. It just so happens they seemed to pale in comparison to the overwhelming rewards.

See, at the time, oil bulls had been served the ultimate bullish advantage on a black-gold platter; namely, the first major oil supply cut in eight years.

To recap: On January 1, the long-awaited agreement between OPEC and its major exporting partners like Russia to curtail production by 1.8 million barrels a day went into effect.

And, according to the mainstream experts, the massive effort to cut the oil glut would also light the fire beneath oil prices. Here, these news items from January 2017 capture the bullish enthusiasm for crude’s upside:

  • “Bullish bets on oil rose to a record in January, reflecting widespread optimism that crude prices are poised to move higher as OPEC starts cutting.” (Jan. 31 Wall Street Journal)
  • “Oil prices are expected to remain on the upside in 2017… supply reduction deal not to disappoint.” (Jan. 21 South China Morning Post)
  • “Crude oil prices have begun the year with a bang. The rally got a boost from the OPEC agreement… The strong rally beyond $50 has wiped out the threat of any sharp fall in price.” (Jan. 3 Hindu Business Line)

Yet — instead of rallying, crude oil prices did the total opposite. After a brief spike, first prices went sideways, and come February, oil prices lost their grip on an 18-month high, falling in a down-up-down series to a 10-month low on June 20.

In fact, since February, oil prices have plummeted 20% to enter official bear-market territory, enduring their worst first half-year in two decades.

It goes without saying that Larry, along with the entire throng of supply-cut-watching-oil-bulls, were caught off guard by oil’s slide. Beckoned a June 21 news source:

“Bulls discount OPEC cuts…as oil set for worst H1 [econ speak for first half of the year] since 1997. The slide in oil prices seems to be unstoppable. The supply deal’s effectiveness is increasingly questioned.” (Reuters)

Wait. Now — six months later and 20% lower in price — the “supply deal’s effectiveness” is questioned? What about before?

See, we believe oil’s selloff was going to occur despite OPEC’s historic cuts. The reason being, the oil cartel does not control the long-term oil price trend; investor psychology, which unfolds as Elliott wave patterns on oil’s price chart, does.

And, right at the onset of oil’s turn down, on February 22 our Energy Pro Service identified a bearish, Elliott wave structure on oil’s price chart. There, Energy Pro Service chief analyst Steve Craig outlined the following long-term course and wrote:

“Repeating: The jury is out, but my working assumption is that wave (A) of triangle wave ((4)) has concluded. If so, the market should trace out a large zigzag for the wave (B) decline that retraces at least 55% of the wave (A) advance.”

The next chart captures the complex unwinding of oil prices into bear market territory:

It’s safe to say, next time wary Larry decides to participate in the oil market, he may think twice about relying 100% on fundamental, news-led analysis as his guide.

Adding Elliott wave analysis into the mix may just give him — and you — that objective, risk-limiting insight into crude oil’s next big move all traders look for.

Get 10 Lessons on The Elliott Wave Principle

Learn how you can apply the Wave Principle to improve your trading and investing in this free 10-lesson tutorial. You’ll learn:

  • What the basic Elliott wave progression looks like
  • Difference between impulsive and corrective waves
  • How to estimate the length of waves
  • How Fibonacci numbers fit into wave analysis
  • Practical application tips for the method
Get Details & Instant Access

Trading the Fakey Pattern

By Adinah Brown

What is it about the Fakey Pattern concept that attracts so many traders’ attention? If you are new to trading and are asking yourself “what is this Fakey Pattern anyway?”, let’s start there.

The Fakey Pattern is the occurrence of sudden price hikes during a false break within the bar structure. In other words, one direction goes down the dumps and within split seconds the other direction rises. One might say, a blessing in disguise for those on the losing end of the trade. The thing to focus on is this:  the price or trade going to the false trade, signals a guaranteed price hike on the opposite side, inside the bar pattern.

Now what causes this false-breakthrough? This is somehow a discovery in a world where good chances are bad ones.

There are two instances that can cause a Fakey Pattern:

1.       The big players in the market like banks and big time traders intentionally force a price reversal. This is possible when the big traders utilize their stop losses on purpose and gather all small retail traders.

2.       When the big players react or retaliate to a significant event or change in the market. The deed then forces an immediate recovery with the price or promising market direction.

These are clear indicators that a Fakey Pattern surfaced. There is no 100% guarantee in trading but the fakey pattern is a close 70% to 80% guarantee that the price will continue to move upward, opposite to the false breakout.

How to Trade a Fakey Pattern?

Traders can make use of the Fakey Pattern in almost all trading platforms like a currency exchange, binary option, trending market, or against a trend. The fakey’s purpose is to provide a green light to an entry point. Many traders have received good profit from these breakouts. The key is to familiarize yourself on several bar patterns. Grasping an accurate understanding of how these patterns work, gives you a higher probability for profit. Don’t grab every opportunity when a breakout presents itself, however. The bar needs to make sense; if there is something wrong with the bar pattern, that’s a red light. If you’re a beginner trader and you already know about the Fakey Pattern, stick to the daily charts. They are easy to understand and easy to monitor. Don’t go diving to lower time frame charts immediately. Familiarize yourself first with Fakey bug signals, Fakey with pin bar, false break and false patterns. These are the indications within a bar pattern, letting you know that you’re on the right track.

The Fakey Pattern is truly a discovery in the price action setup. It says that a decline isn’t always a bad thing. The Fakey setup is predicted to make its biggest impact on Forex or the trending market. Looks like only time will tell.  Just remember, the Fakey Pattern is more accurate in daily charts so don’t go out of zone. One great thing about the Fakey is that it has given more traders the motivation to trade, knowing there is a safe and profitable zone. This is why monitoring and knowing all the components of a trade is important for a successful trading career.

About the Author:

Adinah Brown is a professional writer who has worked in a wide range of industry settings, including corporate industry, government and non-government organizations. Within many of these positions, Adinah has provided skilled marketing and advertising services and is currently the Content Manager at Leverate.


Murrey Math Lines 28.06.2017 (EUR/USD, GBP/JPY)

Article By RoboForex.com

EUR USD, “Euro vs US Dollar”

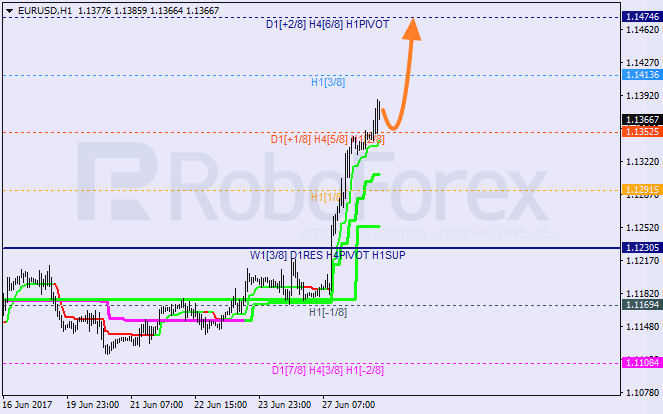
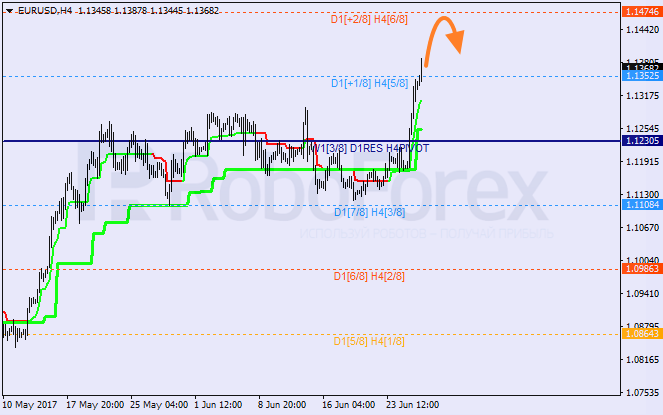
The EUR/USD pair broke the 4/8 level pretty fast and, as a result, started growing significantly. The closest target is at the 6/8 level. If later the pair rebounds from this level, the market may start a new descending correction.

As we can see at the H1 chart, Super Trends formed “bullish cross”. On Wednesday, the pair may test the 2/8 level. If the price rebounds from this level, the market may resume moving upwards to reach the 4/8 one.


GBP JPY “Great Britain Pound vs Japanese Yen”

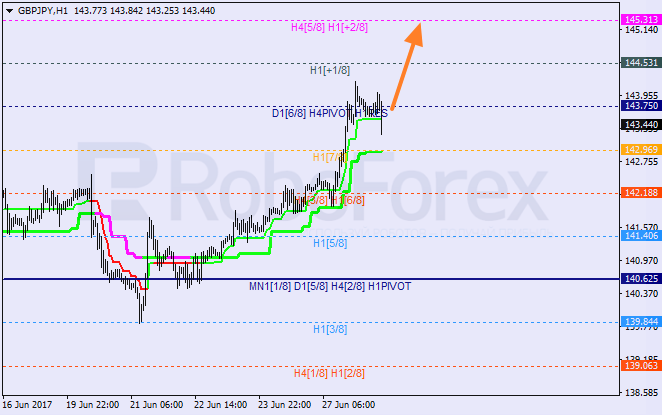
Yesterday, the GBP/JPY pair broke the 3/8 level along with the daily Super Trend and then reached the 4/8 one. Right now, the price is consolidating close to this level. It’s highly likely that later the market may continue moving upwards to reach the 5/8 level.

At the H1 chart, the pair is being corrected below the 8/8 level. If later the price rebounds from the H1 Super Trend, the market may resume growing and test the +2/8 level.


RoboForex Analytical Department

Article By RoboForex.com

Attention!
Forecasts presented in this section only reflect the author’s private opinion and should not be considered as guidance for trading. RoboForex LP bears no responsibility for trading results based on trading recommendations described in these analytical reviews.

Forex Technical Analysis & Forecast 28.06.2017 (EUR/USD, GBP/USD, USD/CHF, USD/JPY, AUD/USD, USD/RUB, GOLD, BRENT)

Article By RoboForex.com

EUR USD, “Euro vs US Dollar”

The EUR/USD pair has broken 1.1200 and then completed the fifth ascending structure with the target at 1.1330. We think, today the price may form another consolidation range and grow towards 1.1370. Later, in our opinion, the market may break the downside border of the range and then fall to reach 1.1200.


GBP USD, “Great Britain Pound vs US Dollar”

The GBP/USD pair has formed an upside continuation pattern at 1.2732 and reached the local target. Possibly, today the price may fall towards 1.2732 to test it from above. After that, the instrument may grow to reach 1.2873 and then start another correction to reach 1.2732.


USD CHF, “US Dollar vs Swiss Franc”

The USD/CHF pair has broken 0.9675 and completed the fifth descending structure. We think, today the price may form another consolidation range at the lows with a reversal pattern. The market is expected to grow with the first target at 0.9700.


USD JPY, “US Dollar vs Japanese Yen”

The USD/JPY pair has broken 111.70 upwards and may yet continue growing to reach 112.72. We think, today the price may grow towards 112.50 and then fall to reach 111.70 to test it from above. Later, in our opinion, the market may move upwards with the target at 112.72. the ascending movement may be considered only as an alternative scenario.


AUD USD, “Australian Dollar vs US Dollar”

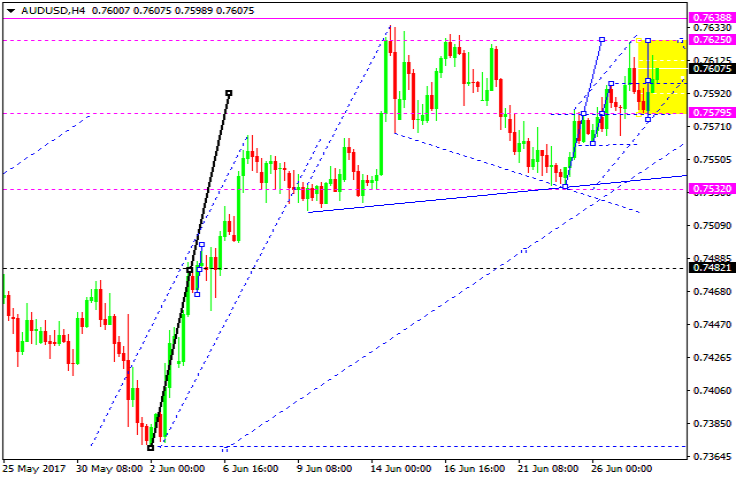
The AUD/USD pair has broken its consolidation range to the upside. Possibly, the price may choose an alternative scenario and grow towards 0.7625. We think, today the price may reach this level. The main scenario implies that the market may continue falling inside the downtrend with the target at 0.7500.


USD RUB, “US Dollar vs Russian Ruble”

The USD/RUB pair has completed only a half of the correction. Possibly, the price may grow towards 59.25. After that, the instrument may fall to break 58.86. The target is at 58.15.


XAU USD, “Gold vs US Dollar”

Gold is forming an upside continuation pattern at 1247.10. Possibly, today the price may reach the local target at 1257.00. Later, in our opinion, the market may be corrected towards 1247.10 and then form the fifth ascending structure to reach 1259.00.


BRENT

Brent has formed another consolidation range at the lows. Possibly, the price may break it and continue growing towards the first target at 49.10. The instrument is expected to start a new ascending wave with the target at 52.00.


RoboForex Analytical Department

Article By RoboForex.com

Attention!
Forecasts presented in this section only reflect the author’s private opinion and should not be considered as guidance for trading. RoboForex LP bears no responsibility for trading results based on trading recommendations described in these analytical reviews.

EURUSD: the rally continues in Asia

By Gabriel Ojimadu, Alpari

Previous:

On Tuesday, the EURUSD instrument closed 156 pips up. Firstly, the euro rose across the market after Mario Draghi’s speech at the ECB forum in Portugal. He painted the recovery of the European economy in a relatively positive light. He talked about the need to adjust some of the parameters of the bank’s monetary policy, but clarified that this wouldn’t amount to it being tightened.

Next, the US dollar continued its slide as Janet Yellen, the Chair of the US Federal Reserve, gave a speech in London. She didn’t say anything new. She repeated that interest rate hikes would be gradual and that the Fed would try to avoid destabilising markets. The president of the Philadelphia Fed, Patrick Harker, also spoke in London and also seems to favour just one more rate hike this year. As such, we can be fairly certain that we won’t see interest rates go up again at least until September. The euro, as such, has decided to venture north.

Day’s news (GMT+3):

  • 09:00 Switzerland: UBS consumption indicator (May);
  • 11:00 Switzerland: ZEW survey – expectations (Jun);
  • 11:00 Eurozone: M3 money supply (May), private loans (May);
  • 15:30 USA: goods trade balance (May), wholesale inventories – prelim (May);
  • 16:30 Various: speeches from the governors of the Bank of Canada (Steven Poloz), Bank of England (Mark Carney), the Bank of Japan (Haruhiko Kuroda) and ECB president Mario Draghi;
  • 17:00 USA: pending home sales (May);
  • 17:30 USA: EIA crude oil stocks change (23 Jun);
  • 21:15 Canada: BoC deputy governor Lynn Patterson’s speech.

EURUSD rate on the hourly. Source: TradingView.

Intraday forecast: low: 1.1330 (22 degrees), high: 1.1384 (225 degrees), close: n/a.

Mario Draghi helped Euro bulls remove the protective stop levels on short positions at 1.1230, opening the way towards 1.13. After Janet Yellen’s speech, the rate stood firmly above 1.13.

The euro rate has restored to the U3 line and has been moving with it for the last 14 hours. The last time the euro reached this level was on the 16th of May this year. Before retreating to the balance line, the price could keep following the U3 line for the next 37 to 40 hours in the form of a sawtooth pattern (look at the price dynamics from the 16-19th of May).

On Tuesday, the upper boundary of the channel was broken through on the daily timeframe. So that you understand, the channel is formed from three values: H – 1.1264 (22/05/17), H – 1.1285 (02/06/17), L – 1.1119 (20/06/17). The upper boundary ran through 1.1320 yesterday.

Judging by the fact that there hasn’t been a rebound from the U3 line since it was reached; buyers have taken 1.1475 as the next target (extension of the channel line on the weekly timeframe). Buyers will meet some resistance on the way at 1.1442, which may stop them from advancing further. In any case, 1.1475 is the highest the euro can currently go.

Based on current buyer activity, I’m forecasting a rebound to the 22nd degree at 1.1329, followed by growth to the 225th degree at 1.1384. The price could exit upwards on yesterday’s euphoria without rebounding.

If, in the end, a rebound does begin during Europe’s session, then we should take note of how the price behaves around 1.1329 and look at what might be forming on the 5-minute and 15-minutes timeframes. The rebound might turn out to be stronger and go as far as the 45th degree at 1.1303. In such a case, it’s impossible to say exactly where the price will stop and a new rally will start.

If traders start selling dollars across the market, and the EURGBP cross grows, we could see the EURUSD hit 1.1445 today.

Adaptability To Volatility

By ProfessionalTradingSystems.com

Financial markets are a constantly changing environment that requires from the successful traders to be adaptable to the changing conditions. Periods of large (volatile) movements are followed by low activity and small movements.


Fig. 1 – Large daily movements. Typical for these periods are large daily fluctuations in price.


Fig. 2 – Small market movements. Typical for these periods are small daily fluctuations in price.

Placing our Stop Loss orders is an important part of a successful trading strategy. These Stop Loss orders should be selected so as to be in line with current market conditions. When we have large movements, we use a large Stop Loss that is far from the market price, and vice versa – when we have small market movements, we use a small Stop Loss that is close to the price.

To do this, it is very appropriate to use the indicator Average True Range – ATR that measures the volatility of the market for N periods backwards. It looks like this:

It is available on any trading platform as a free indicator, so it is applicable by everyone and does not require additional installations.

Returning to Figure 1 that shows a volatile market, we will see that the 10-period ATR has the value of 170-220 pips in this cycle of the market behavior. The same indicator shows a value of about 50 pips when we have a quiet market. Difference reaching 4 times! It is considerable, isn’t it?

If we choose to trade using a fixed Stop Loss in pips – say 40 pips, it would be adequate only when the market is quiet. In a volatile market, we will be often thrown out from the market, which will lead to losing trades. The same applies if we also choose a large Stop Loss – 150 pips. Then it would be inadequately large when we have small market fluctuations.

In order to place an adequate Stop Loss, we from ProfessionalTradingSystems use a ratio of 10-period ATR for its calculation. This ratio varies depending on the trading system, but if we assume that it is 0.5, then in a volatile market we would use a Stop Loss of 85-110 pips, and in a quiet market -25 pips.

The ratio of the 10-period ATR is a very suitable tool that allows us to keep abreast with what is happening in the financial markets in an automatic way, without having to anticipate if we are to have a quiet or volatile market.

Using an appropriate Stop Loss is one of the distinguishing characteristics of successful trading systems.

Adaptability to the volatility is a conception that we from ProfessionalTradingSystems use in all our systems!

Article by Professional Trading Systems –  Forex Mechanical and Automated Systems


Japanese Candlesticks Analysis 27.06.2017 (EUR/USD, USD/JPY)

Article By RoboForex.com
EUR USD, “Euro vs. US Dollar”

At the H4 chart of EUR USD, bullish Three Methods continuation pattern indicated an ascending movement. The upside Window is a resistance level. Three Line Break chart and Heiken Ashi candlesticks confirm the ascending movement.

At the H1 chart of EUR USD, there are no reversal pattern; candlesticks are bullish. The upside Window is a resistance level. Three Line Break chart and Heiken Ashi candlesticks confirm the ascending movement.


USD JPY, “US Dollar vs. Japanese Yen”

At the H4 chart of USD JPY, Engulfing Bearish pattern indicated a descending correction. The upside Window is a resistance level. Three Line Break chart and Heiken Ashi candlesticks confirm a bearish direction.


RoboForex Analytical Department

Article By RoboForex.com

Attention!
Forecasts presented in this section only reflect the author’s private opinion and should not be considered as guidance for trading. RoboForex LP bears no responsibility for trading results based on trading recommendations described in these analytical reviews.

Ichimoku Cloud Analysis 27.06.2017 (GBP/USD, GOLD)

Article By RoboForex.com

GBP USD, “Great Britain Pound vs US Dollar”

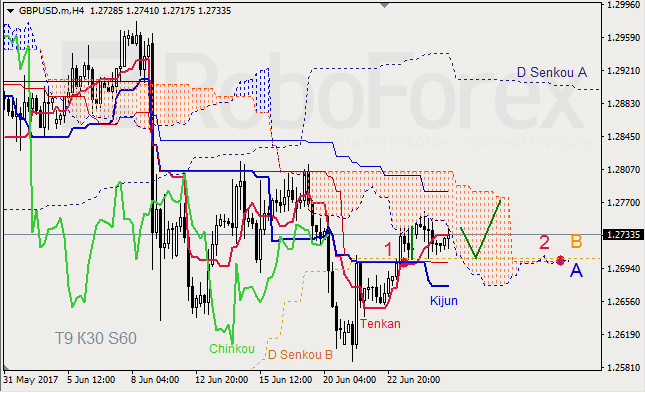
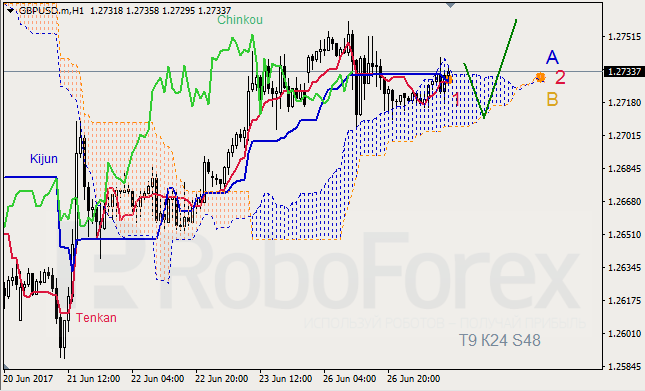
GBP USD, Time Frame H4. Indicator signals: Tenkan-Sen and Kijun-Sen are influenced by “Golden Cross” (1). Ichimoku Cloud is still closed (2), Chinkou Lagging Span is on the chart, and the price is on Tenkan-Sen. Short-term forecast: we can expect resistance from Senkou Span A and support from D Tenkan-Sen – Senkou Span B.

GBP USD, Time Frame H1. Indicator signals: Tenkan-Sen and Kijun-Sen ran into one another inside Kumo Cloud, they may intersect and form “Golden Cross” (1). Ichimoku Cloud is closed (2), Chinkou Lagging Span is on the chart, and the price is on Tenkan-Sen and Kijun-Sen. Short-term forecast: we can expect support from Senkou Span B, and growth of the price.


XAU USD, “Gold vs US Dollar”

XAU USD, Time Frame H4. Indicator signals: Tenkan-Sen and Kijun-Sen ran into one another below Kumo Cloud (1). Ichimoku Cloud is still moving downwards (2), Chinkou Lagging Span is below the chart, and the price is below the cloud. Short‑term forecast: we can expect resistance from D Senkou Span A, and decline of the price.


RoboForex Analytical Department

Article By RoboForex.com

Attention!
Forecasts presented in this section only reflect the author’s private opinion and should not be considered as guidance for trading. RoboForex LP bears no responsibility for trading results based on trading recommendations described in these analytical reviews.

EURUSD: price trading close to the balance line

By Gabriel Ojimadu, Alpari

Previous:

Trading on the EURUSD pair closed down on Monday. Market volatility was high as US data was being published. The EURUSD pair jumped 39 pips on the news. US 10Y bond yields fell by 1.92% to 2.122%. Durable goods orders in the US were significantly lower than expected.

The index for durable goods orders in May was -1.1% (forecast: -0.5%, previous reading: -0.9%).

The dollar eventually recovered all the losses incurred by this news and closed the day up.

Day’s news (GMT+3):

  • 11:00 Eurozone: ECB president Mario Draghi’s speech;
  • 11:05 USA: FOMC member Williams’ speech;
  • 11:30 Australia: RBA deputy governor Debelle’s speech;
  • 11:30 Eurozone: ECB board member Benoît Cœuré’s speech;
  • 12:30 UK: BoE financial stability report;
  • 13:00 UK: BoE governor Mark Carney’s speech;
  • 14:00 Eurozone: ECB board member Peter Praet’s speech;
  • 16:00 USA: S&P/Case-Shiller home prices index (Apr);
  • 17:00 USA: Richmond Fed manufacturing index (Jun);
  • 18:15 USA: FOMC member Harker’s speech;
  • 20:00 USA: Fed’s Yellen speech.

EURUSD rate on the hourly. Source: TradingView.

Intraday forecast: low: n/a, high: n/a, close: n/a.

After the release of US statistics and a jump to 1.1220, the price returned to the balance line at 1.1176. Either the news or statements from central bank representatives should prevent the rate from correcting by 45 degrees. Today is again full of statements from representatives of the major central banks.

I’ve decided not to make a forecast on today’s chart, but I’ve shown a couple patterns on the left that the price could follow on Tuesday. Take a look at the dynamics of the pair from the 13th and 14th of June this year. In one case, the price exited upwards, and in the other, downwards. It will depend on external factors.

1.1200/05 is acting as a resistance on this pattern. Given that Janet Yellen is set to speak today, traders can take a wait-and-see attitude until she speaks. What does this mean for us? It means that we should expect either a flat within a range of 1.1172 – 1.1205 or fluctuations in both directions like on Monday.

Before making any trading decisions today, take a look at the dynamics of US bond yields as well as the EURGBP cross. To buy Euros, the cross should rise and US bonds should fall. For selling Euros, the opposite is true.

The AO indicator is at the zero line, meaning that there is no trend and the indicator has unloaded. The Stochastic oscillator is in the sell zone. When trading opens in Europe, we can expect the rate to return to 1.1178/70.

Why Warren Buffet Is So Rich?

By ProfessionalTradingSystems.com

By far Warren Buffet is the most popular investor in financial markets nowadays. Frequently he tops Fortune`s list for the wealthiest people on Earth. He has built an amazing track record of successful years by doing what he loves doing the most – capital allocation. What is the secret behind his success?

A valid method of investing – you have to have a profitable method when you invest your money in stock market, for sure . His method for searching undervalued stocks is well known to all of us, who are interested in investing and trading. But is that the real trait of his success? NO! Because this method is very simple and available to the public. According to him if you use Greek letters for your investing, you are on the wrong path. Warren doesn’t use any computer or complicated tools for this research. That`s why I can say that his method of investing is not the main root of his success.

For me real key to the golden door is his Emotional stability. On our field of investing and trading  you don’t need super intelligence and great IQ. You need persistence and emotional stability to follow your investment strategy. Almost always you have  to do just the opposite of the what the crowd is doing.

This feature of his character has led him year after year to follow his strategy and to achieve extraordinary results. Below you can see his performance since 1965 as described in “The Warren Buffet Way ” by Robert  Hagstrom:

Year% Gain/LossYear% Gain/LossYear% Gain/Loss
196523.8197935.7199314.3
196620.3198019.3199413.9
196711198131.4199543.1
196819198240199631.8
196916.2198332.3199734.1
197012198413.6199848.3
197116.4198548.219990.5
197221.7198626.120006.5
19734.7198719.52001-6.2
19745.5198820.1200210
197521.9198944.4200321
197659.319907.4
197731.9199139.6
197824199220.3


The average gain during this period is 22.2% annually. To be honest it is not a big yearly performance, we know many traders who have achieved a lot more than 22%. BUT Warren has been doing  it since 1965!!! More than 50 years – as we don’t include his first years on investing running Buffet Partnership! There are many, many traders and investors who has done an amazing job for a short period of time but there are none who have succeeded for that long time.

So the key to wealth is doing a good job for a long time.

Article by Professional Trading Systems –  Forex Mechanical and Automated Systems