Author Archive for InvestMacro – Page 537

3 Wonderful Trading Book Reviews

By ProfessionalTradingSystems.com

In this article I will share with you 3 of my favorite trading books. These books have influenced my trading a lot and I have reread them several times because every time I am reading them I am still learning something new.

  1. Market Wizards by Jack Schwager

This book is a collection of interviews with one of the most successful and profitable traders in the world. Most of them had been unknown to the public before the book has been published. It contains more than 20 interviews.

You can find there mechanical traders, fundamental traders, trend-following trades, stock traders and all kind of traders you can imagine.

From this book I got inspired a lot, reading so many successful stories achieved with different tools and ways of thinking. I learned that there is no a certain method of trading that can only lead to successful trading. You can see form the book that everyone has achieved success using many, many different tools for analysis.

It was funny to read in the book that one certain type of trading is useless according to a trader and then 50 pages later you are reading about a trader succeeded using exactly  the same approach.


  1. Definitive guide to Positions sizing by Van Tharp

This book describes almost all available money management models – 96 and it is an encyclopedia and a piece of art. All you need to know on this topic is collected here. As you read it you will gain all the knowledge a trader has to have in order to be successful. It is one of those books you can reread many, many times. I personally have read it a few times and very often I open it in order to read something specific about a particular topic.

A lot of traders underestimate this topic and think that all you need is a good strategy but the reality doesn’t prove this to be right. Many successful traders share that the most important and underestimated factor of successful trading is exactly money management or position sizing as Van Tharp defines it.

The author takes a very simple strategy and then after describing in detail every of the 31 methods he compared  what it would be the performance of the strategy if the particular money management method has been applied.

You will understand that position sizing is a tool for achieving your objectives and there is no perfect strategy that fits for all of us. There is only a suitable strategy for every occasion.

After reading this book you will know which tool you have to use in order to achieve your desired results.


  1. Short-Term Secrets to Long-Term Trading by Larry Williams

A book full of trading methods by legendary trading champion Larry Williams. You can find there thoughts about breakout methods, and other successful tools that has been used by Larry in his 50+ years of experience.

Worth reading it many times because after that you will know much better the market structure and why the price is moving in a certain way.

If you are interested about trading only during certain days on the week or month only you have to read Williams` book.  There are thoughts about Money Management and Psychology as well.

After reading these books you will be a much better trader and investor for sure.


Article by Professional Trading Systems –  Forex Mechanical and Automated Systems


Don’t Hold Your Breath For Deeper OPEC Cuts

By OilPrice.com

The rally in oil prices over the past two weeks came to a halt on Wednesday on news that OPEC is actually exporting more oil than previously thought.

A month ago, oil prices appeared to be higher than they should have been, with weak demand, elevated inventories, and a recognition that the nine-month OPEC extension would be inadequate to balance the market. Oil sold off and dropped to the mid-$40s and below. Oil traders then bought on the dip, and bid prices back up over the past two weeks. Now, prices again look like they could be reaching an upper limit.

“The air is getting thin for oil prices. The price increase just ran out of steam, which is not very surprising, given the newsflow of rising OPEC supplies,” Carsten Fritsch, senior commodity analyst at Commerzbank, told Reuters.

According to Reuters data, OPEC exports jumped again in June, the second consecutive month of rising exports. Everyone tends to pay attention to the production data, but the volume of exports is arguably much more important. Reuters says that OPEC’s oil exports rose to 25.92 million barrels per day (mb/d) in June, an increase of 450,000 bpd from May.

More importantly, OPEC’s exports are actually 1.9 mb/d higher today than they were a year ago, despite the highly-touted compliance rate with the collective production cuts. Reuters columnist Clyde Russell calls OPEC’s efforts to balance the oil market “an exercise in self-deception.” It appears that OPEC is exporting just as much oil as it was before the November deal was announced, according to a Reuters analysis of oil tanker data. The UAE, for example, exported 2.8 mb/d in the first six months of 2017, higher than the 2.52 mb/d the country averaged in the same period a year earlier. Iran too is exporting more than last year.

Then, of course, there are the countries exempted from the deal – Libya and Nigeria – where exports are rising quickly. Libya’s exports only averaged 243,000 bpd in the first half of 2016, a figure that doubled to 553,000 bpd this year. Libya’s production recently topped 1 mb/d, so its exports are surely set to rise further.

Ultimately, this means that OPEC’s oil exports are not all that different from last year’s figures even though it has claimed success with the collective cuts.

That raises the question about whether or not OPEC should make deeper cuts, an approach that a growing number of analysts say is needed to balance the market.

And as Bloomberg recently noted, another cut would be consistent with OPEC’s own history. In the past, OPEC conducted multiple cuts over a short period of time, tweaking their output levels in order to achieve a targeted outcome. “In the past if it didn’t work, OPEC would adjust lower,” Mike Wittner, head of oil market research at Societe Generale SA, told Bloomberg. “It’s a process. That’s what supply management means.” It would be an “outlier” if this time they cut only once.

However, the one major reason why a follow-up cut would be more difficult is the presence of rapid-response U.S. shale. Shale drillers have already brought back a lot of production since last year, so deeper cuts could simply open up more room for them. While some analysts are pointing to the possibility of shale production starting to slow, that would support the notion that the industry responds very quickly to changing market dynamics. That responsiveness takes away some leverage from OPEC and undercuts the rationale for steeper cuts.

Moreover, it would be very difficult to get all participants on board for deeper reductions. Russia, a crucial non-OPEC producer that has leant weight to the deal, has poured cold water on speculation about the possibility of deeper cuts. Four Russian officials said they would oppose any proposal for more aggressive action.

The officials even argued that another cut so quickly after the group agreed to a nine-month extension could backfire. The hasty move would be viewed by the market as a panicked decision, a recognition that what they have been doing is wholly inadequate to balance the market. Oil traders might interpret an attempt to lower output as very bearish rather than bullish.

As a result, we will probably be stuck with the current trajectory – muddling through for another year or so with modest drawdowns in inventories, and oil prices stuck in its current range between $40 and $60.

Link to original article: http://oilprice.com/Energy/Oil-Prices/Dont-Hold-Your-Breath-For-Deeper-OPEC-Cuts.html

By Nick Cunningham of Oilprice.com


The USD is under pressure of the statistics. Overview for 06.07.2017

Article By RoboForex.com

On Thursday afternoon, the main currency pair resumed growing after the USA published the first block of statistics on the employment.

The USA published first reports on the employment market this month and the EUR/USD pair is back to strengthening again. The current quote for the instrument is 1.1390.

So, today the USA started publishing the June numbers on the employment market. According to the first one, the ADP Non-Farm Employment Change expanded by 158K after adding 230K the month before and against the expected reading of 184K. There is no direct correlation between ADP and NFP, but after seeing the weak ADP reading, investors are automatically expecting the same from NFP.

The Challenger Job Cuts decreased by 19.3% y/y in June, which is pretty good after adding 9.7% y/y the month before. However, this report was barely noticed.

Instead, investors paid quite a lot of attention to the Initial Jobless Claims, which increased up to 248K after being 244K and against the expected reading of        243K.

There will be several other interesting reports later today. For instance, the June reports on the Final Markit Services PMI and the ISM Non-Manufacturing Business Activity.

At the moment, the market situation doesn’t help the USD to get stronger, so the Euro may break 1.14 and fix above it.


RoboForex Analytical Department

Article By RoboForex.com

Attention!
Forecasts presented in this section only reflect the author’s private opinion and should not be considered as guidance for trading. RoboForex LP bears no responsibility for trading results based on trading recommendations described in these analytical reviews.

Forex Technical Analysis & Forecast 06.07.2017 (EUR/USD, GBP/USD, USD/CHF, USD/JPY, AUD/USD, USD/RUB, GOLD, BRENT)

Article By RoboForex.com
EUR USD, “Euro vs US Dollar”

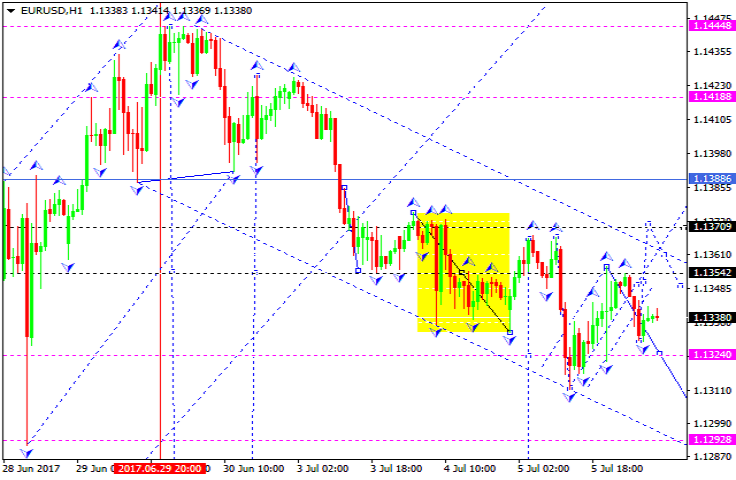
The EUR/USD pair has broken the consolidation range to the downside and completed the correction. We think, today the price may move according to the main scenario and fall towards 1.1293. An alternative scenario suggests that the instrument may continue the correction to reach 1.1380.


GBP USD, “Great Britain Pound vs US Dollar”

The GBP/USD pair has finished the descending wave, which may be considered as the central structure of the downside continuation pattern. Possibly, today the price may rebound from 1.2935. The local target is at 1.2845. Later, in our opinion, the market may be corrected in the fourth wave to reach 1.2935 to test it from below and then start another decline with the target at 1.2817.


USD CHF, “US Dollar vs Swiss Franc”

The USD/CHF pair has completed the descending correctional structure at 0.9638. We think, today the price may continue moving according to the main scenario to reach 0.9665. After breaking it, the instrument may reach 0.9692 and then fall to return to 0.9665. An alternative scenario suggests that the market may continue the correction with the target at 0.9615.


USD JPY, “US Dollar vs Japanese Yen”

The USD/JPY pair is consolidating at the top of the ascending wave; this structure may be followed by a reverse to the downside. Possibly, the price may break the low of this consolidation range. The first target is at 111.94.


AUD USD, “Australian Dollar vs US Dollar”

The AUD/USD pair is trading in the center of the descending wave towards 0.7653. Later, in our opinion, the market may be corrected to reach 0.7650 and then form the third wave with the target at 0.7500.


USD RUB, “US Dollar vs Russian Ruble”

The USD/RUB pair has broken 59.36 to the upside and right now is still being corrected. In fact, the entire range may be considered as the consolidation channel at the top of the ascending wave. After breaking this range to the downside, the price may continue falling inside the downtrend with the target at 55.50.


XAU USD, “Gold vs US Dollar”

Gold is still consolidating near the lows. Possibly, today the price may break 1228.86 to the upside and form the first wave towards 1240.00. After that, the instrument may be corrected to test 1229.00 from above and then start another growth with the target at 1259.15.


BRENT

Brent is forming the fourth correctional structure. Possibly, the price may form another descending structure to reach 47.41. Later, in our opinion, the market may form the fifth structure towards 50.30 and finish the first wave. After that, the instrument may be corrected with the target at 47.40 (an alternative scenario).


RoboForex Analytical Department

Article By RoboForex.com

Attention!
Forecasts presented in this section only reflect the author’s private opinion and should not be considered as guidance for trading. RoboForex LP bears no responsibility for trading results based on trading recommendations described in these analytical reviews.

EURUSD: expecting a 45-degree rebound after the slide

By Gabriel Ojimadu, Alpari

Previous:

Trading on the euro/dollar pair closed slightly up on Wednesday. The rate fell to 1.1312 during the European session on comments from ECB board member Benoît Cœuré. Another contributing factor to the euro’s slide was the collapse in oil prices. This, in turn, weighed down on commodity currencies.

The market got shaken up a bit as the FOMC minutes were published for their June meeting, but the dollar failed to hold on to its gains. By the end of the day, the rate had recovered to 1.1354.

Day’s news (GMT+3):

  • 09:00 Germany: factory orders (May);
  • 10:15 Switzerland: CPI (Jun);
  • 14:30 Eurozone: ECB monetary policy meeting accounts;
  • 14:30 USA: Challenger job cuts (Jun);
  • 15:15 USA: ADP employment change (Jun);
  • 15:30 Canada: trade balance (May), building permits (May);
  • 15:30 USA: initial jobless claims (26 Jun), trade balance (May);
  • 16:45 USA: Markit services PMI (Jun);
  • 17:00 USA: ISM non-manufacturing PMI (Jun), FOMC member Powell speech;
  • 18:00 USA: EIA crude oil stocks change (30 Jun).

EURUSD rate on the hourly. Source: TradingView.

On Wednesday, after falling to 1.1312, the euro/dollar ricocheted up to 1.1355. The 112th degree subdued sellers. Up above, the LB balance line is stopping buyers.

The market is ready for a fall again. The price has rebounded from the LB. At the time of writing this review, the euro is trading for 1.1339 USD. This morning, I entertained the possibility of the euro falling to 1.1290, but remembering yesterday’s rebound to 1.1335, I changed my mind. It was too big a rebound for there to be a further slide. Now, there’s a chance to create a bullish divergence on the AO indicator and move to 1.1365 (45th degree and trend line). If the price rebounds from the 45th degree and falls to 1.1330 on Friday, we can expect the euro to fall to 1.1280.

Today, I’m expecting a slide to 1.1320, followed by growth to 1.1365. I’m not ruling out a return to 1.1312 and the formation of a double base. A drop to 1.1312 isn’t ideal for sellers because if this forms a reversal model, the price will rise to 1.1390.

Japanese Candlesticks Analysis 05.07.2017 (AUD/USD, EUR/USD)

Article By RoboForex.com

AUD USD, “Australian Dollar vs US Dollar”

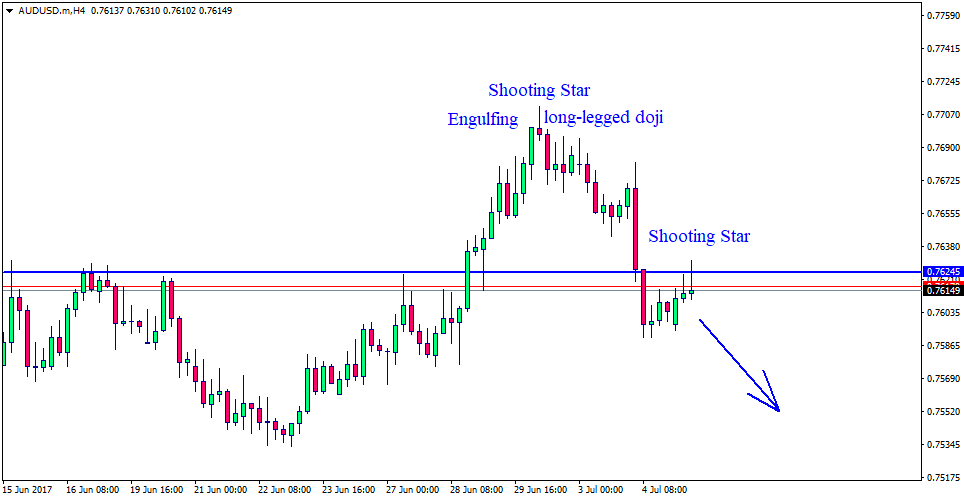
At the H4 chart of AUD USD, the price broke the support level and reached its targets. Right now, the pair is being corrected. Morning Star pattern indicates that the correction may complete soon and then the instrument may continue falling towards the next support level at 0.7540.


EUR USD, “Euro vs. US Dollar”

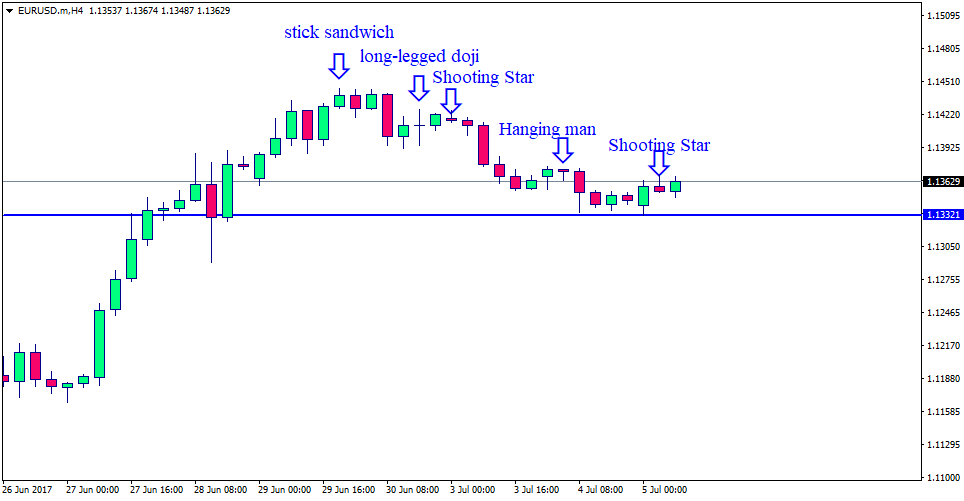
At the H4 chart of EUR USD, the price is still falling. The pair attempted to break the support level, but was stopped. Hanging Man and Morning Star patterns indicate that the instrument may yet break the support level soon and then continue moving downwards.


RoboForex Analytical Department

Article By RoboForex.com

Attention!
Forecasts presented in this section only reflect the author’s private opinion and should not be considered as guidance for trading. RoboForex LP bears no responsibility for trading results based on trading recommendations described in these analytical reviews.

Forex Technical Analysis & Forecast 05.07.2017 (EUR/USD, GBP/USD, USD/CHF, USD/JPY, AUD/USD, USD/RUB, GOLD, BRENT)

Article By RoboForex.com

EUR USD, “Euro vs US Dollar”

The EUR/USD pair is consolidating around 1.1355. If later the market breaks this range to the upside, the instrument may be corrected towards 1.1414; if to the downside – continue its decline with the target at 1.1266. The main scenario implies that the downtrend may continue. An alternative scenario suggests that the pair may be corrected to the upside.


GBP USD, “Great Britain Pound vs US Dollar”

The GBP/USD pair is consolidating around 1.2929. If later the market breaks this range to the upside, the instrument may be corrected towards 1.2970; if to the downside – continue its decline with the target at 1.2860. The main scenario implies that the price may continue falling inside the downtrend.


USD CHF, “US Dollar vs Swiss Franc”

The USD/CHF pair is trading around 0.9640. If later the market breaks this range to the upside, the uptrend may continue towards 0.9680; if to the downside – start another correction with the target at 0.9600.


USD JPY, “US Dollar vs Japanese Yen”

The USD/JPY pair is consolidating around 113.10. The main scenario implies that the price may break the low and fall towards the first target at 111.95. After that, the instrument may be corrected to reach 112.50.


AUD USD, “Australian Dollar vs US Dollar”

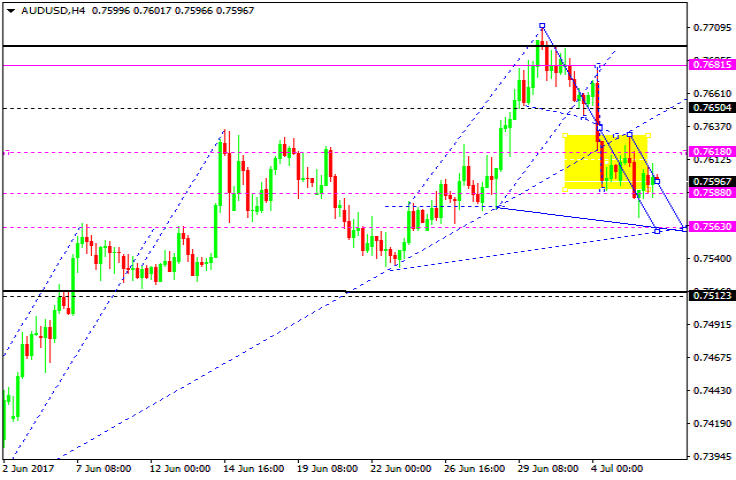
The AUD/USD pair is consolidating and growing towards 0.7633. Later, in our opinion, the market may fall to reach 0.7563 and then move upwards with the target at 0.7650.


USD RUB, “US Dollar vs Russian Ruble”

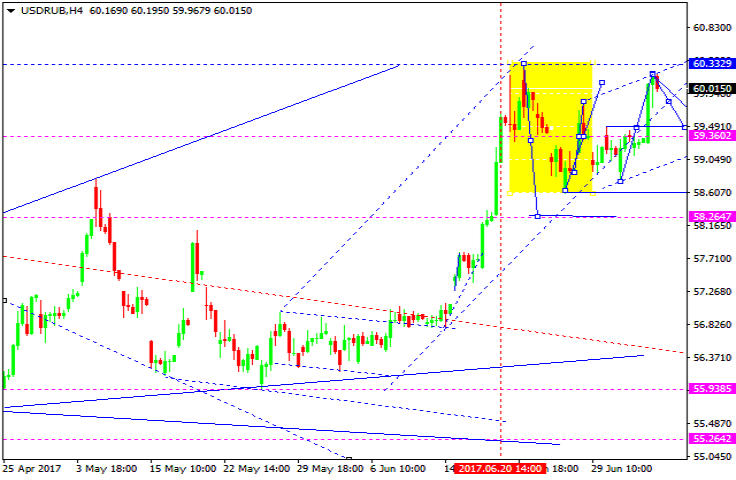
The USD/RUB pair is still trading around 59.30. After breaking this range to the downside, the price may reach 58.26 and complete the fifth descending wave. Later, in our opinion, the market may be corrected towards 59.30 and then continue falling inside the downtrend with the target at 55.50.


XAU USD, “Gold vs US Dollar”

Gold has completed the first impulse and right now is being corrected. Possibly, today the price may break 1228.00 to the upside. The target of the wave is at 1237.20. After that, the instrument may be corrected towards 1228.00.


BRENT

Brent is trading at the top of the third ascending wave. Possibly, the price may consolidate and move downwards a bit to reach 48.50. If later the market breaks this range to the upside, the instrument may reach 50.30; if to the downside – be corrected with the target at 47.40.


RoboForex Analytical Department

Article By RoboForex.com

Attention!
Forecasts presented in this section only reflect the author’s private opinion and should not be considered as guidance for trading. RoboForex LP bears no responsibility for trading results based on trading recommendations described in these analytical reviews.

EURUSD: still on downwards course towards 1.1312

By Gabriel Ojimadu, Alpari

Previous:

Yesterday, the single currency closed down against the US dollar for the third session in a row. After falling to 1.1336, trading on the pair levelled out and was trading at around 1.1347 until the end of the session. Activity on the Forex market yesterday was minimal due to there being a national holiday in the US.

Day’s news (GMT+3):

  • 10:55 Germany: Markit service PMI (Jun);
  • 11:00 Eurozone: Markit services PMI (Jun);
  • 11:30 UK: Markit services PMI (Jun);
  • 12:00 Eurozone: retail sales (May);
  • 17:00 USA: factory orders (May), IBD/TIPP economic optimism (Jul);
  • 21:00 USA: FOMC minutes.

EURUSD rate on the hourly. Source: TradingView.

My expectations for yesterday came off in full. The 90th degree stopped sellers at 1.1336. Until the end of the day, the pair traded at around 1.1347. After a 12-hour flat, the euro rate corrected in Asia to 1.1369. At the time of writing, the euro was trading at 1.1355.

Technical analysis on the hourly timeframe gives an ambiguous picture. Cyclical analysis on the 4-hour and daily timeframes points to the continuation of the downwards correction. Some bullish divergences have formed on the hourly AO oscillator.

Given that the AO indicator has unloaded to zero, and the Stochastic is looking down, I’m expecting the support at 1.1343 to be broken and for the euro to fall to 1.1312 (112 degrees). The slide could stop at 1.1328, where there is a daily support that buyers will have to defend; otherwise we’ll see increased closing of long positions.

Today, on the 5th of July, trader attention will be focused on the FOMC’s minutes as well as Britain’s services PMI. The UK statistics will have an effect on GBP currency pairs. If the index is better than expected, the euro/dollar will be flat until the FOMC’s minutes are published.

Today, I think it better to watch the market from the sidelines. If the hourly candlestick closes above 1.1382, better not to sell your euros.

Are Advanced Economies Ready for Recovery, Really?

Or Global Reflation As China Begins Tightening

By Dan Steinbock

Until recently, the conventional wisdom was that China’s contribution to global reflation would be increasingly accompanied by those of the US and Europe. Yet, the realities may look grimmer than anticipated.

Usually, the term ‘reflation’ is used to describe the first phase of economic recovery after a period of contraction. More recently, ‘global reflation’ has been deployed to refer to the post-crisis past decade, which has been characterized by lingering recovery from the global crisis, despite ultra-low rates and quantitative easing.

During the global crisis, China accounted for much of global growth prospects, while the US, Europe and Japan coped with the Great Recession. Even today, China continues to drive a disproportionately large share of global growth.

However, as deleveraging has now started in the mainland, China can no longer raise future optimism single-handedly.

From debt to deleveraging

Today, China has its debt challenge. It evolved in just a decade. And while it can still be supported by catch-up growth and productivity, it is untenable over time.

In 2007, China’s total debt was 136 percent, of which most was private non-financial debt (115%). By 2015, Chinese debt had soared to 221 percent of GDP, of which most could be attributed to private debt (205%), as opposed to central government debt (16%).

China could continue to take debt, which would eventually end in a crisis, as evidenced by many advanced economies. Instead, since late 2016, the central bank has adopted a tighter monetary stance. Indeed, recent data on the decline of total social financing and broad money supply suggests that deleveraging has begun.

China’s debt burden is the result of the 2009 stimulus package, which contributed to infrastructure but unleashed huge liquidity and speculation, and the 2016 credit expansion, which heated property markets, despite tougher regulation.

Setting aside excessive leverage, both surges have had beneficial impacts internationally. The 2009 stimulus ensured global growth prospects and probably spared the world from a global depression. The 2016 credit surge allowed China to stabilize economy and markets, which, in turn, supported lingering recovery globally.

The big question is, if China accounts for much of recent global reflation, can the latter be sustained as deleveraging accelerates in the mainland?

Dreams and realities of global reflation

Not so long ago, there were still great hopes about sustained ‘global reflation.’ Last fall, the Trump triumph in the US elections unleashed great expectations about the coming of fiscal expansion, tax reforms, and deregulation. As a result, markets soared, which lifted confidence internationally.  Thereafter, European recovery has been faster than in years, thanks to the French election, expectations of a ‘soft Brexit’, and Chancellor Merkel’s anticipated victory in German election later in fall.

Today, half a year later, it is clear that Trump’s fiscal expansion will move ahead far slower than anticipated and the administration’s credibility, perhaps even its future, is likely to be suppressed by the impending Mueller investigation, while the Federal Reserve is planning a third date hike in the fall.

In Europe, rising confidence ignores the fact that current growth rates remain predicated on ultra-low rates and tens of billions of euros for quantitative easing on a monthly basis. It may under-estimate the adverse impact of the lingering Brexit story, the challenges associated with French President Macron’s proposed labor reforms, as well as the potential implications of the struggling two mid-sized Italian banks. It is a recovery that, at least for now, relies on artificial lungs.

In the past decade, much of global growth prospects and recent global reflation can be attributed to China. In the next few years, China will continue to support global economic integration through the One Road and One Belt program and many other initiatives. But it can no longer fuel global growth and reflation on its own.

So the question is, have advanced economies really surpassed secular stagnation and are they today willing, but also able to do their share for global growth prospects?

About the Author:

Dr Dan Steinbock is the founder of Difference Group and has served as research director at the India, China and America Institute (USA) and visiting fellow at the Shanghai Institutes for International Studies (China) and the EU Center (Singapore). For more, see http://www.differencegroup.net/ 

The original, slightly shorter version was released by Shanghai Daily on July 3, 2017


Ichimoku Cloud Analysis 04.07.2017 (AUD/USD, NZD/USD, USD/CAD)

Article By RoboForex.com

AUD USD, “Australian Dollar vs US Dollar”

The AUD/USD pair is trading at 0.7613; it is still moving above Ichimoku Cloud, which means that it may continue growing. We should expect the price to test the upside border of the cloud close to 0.7600 and then continue moving upwards above 0.7670. However, this scenario may be cancelled if the price breaks the downside border of the cloud and fixes below 0.7580. In this case, the instrument may continue falling towards 0.7525 and lower.


NZD/USD, “New Zealand Dollar vs US Dollar”

The NZD/USD pair is trading at 0.7285; it broke the upside border of Ichimoku Cloud and right now moving inside the cloud, which means that it is moving sideways. We should expect the price to test the downside border of the cloud at 0.7270 and then continue moving upwards to reach the upside one at 0.7300. If the pair breaks the upside border and fixes above 0.7320, the price may continue moving upwards. However, the scenario that implies further growth may be cancelled if the price breaks the downside border of the cloud and fixes below 0.7250. In this case, the instrument may continue falling towards 0.7180 and lower.


USD/CAD, “US Dollar vs Canadian Dollar”

The USD/CAD pair is trading at 1.2981; it is still moving below Ichimoku Cloud, which means that it may continue falling. We should expect the price to test Tenkan-Sen and Kijun-Sen at 1.3035 and then continue moving downwards to reach 1.2840. However, this scenario may be cancelled if the price breaks the upside border of the cloud and fixes above 1.3190. In this case, the instrument may continue growing towards 1.3320 and higher.


RoboForex Analytical Department

Article By RoboForex.com

Attention!
Forecasts presented in this section only reflect the author’s private opinion and should not be considered as guidance for trading. RoboForex LP bears no responsibility for trading results based on trading recommendations described in these analytical reviews.