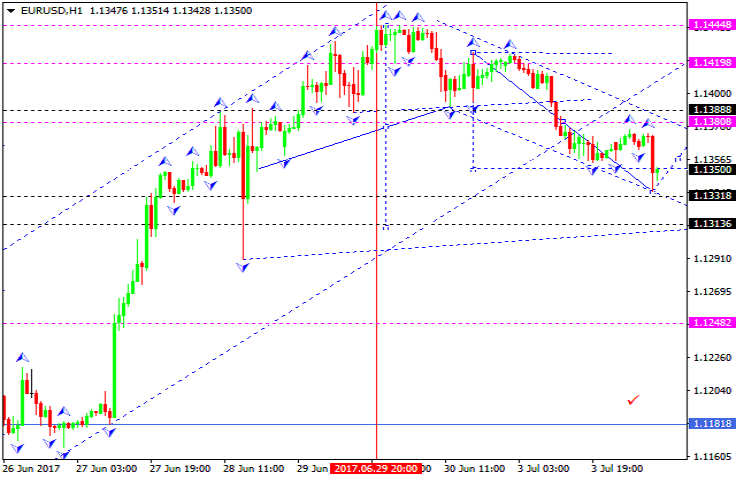
The EUR/USD pair has reached the local target at 1.1340. We think, today the price may grow towards 1.1380 to test it from below. Later, in our opinion, the market may move downwards to reach 1.1313 and then start another correction with the target at 1.1380.
GBP USD, “Great Britain Pound vs US Dollar”
The GBP/USD pair is trading to break the low of the first impulse and expected to form another consolidation range near 1.2927. The local target of this wave is at 1.2860. After that, the instrument may grow towards 1.2927 and then start another decline with the target at 1.2817.
USD CHF, “US Dollar vs Swiss Franc”
The USD/CHF pair has reached the target of the third ascending wave. Possibly, today the price may fall to reach 0.960 and then start the fifth wave towards 0.9666. After that, the instrument may be corrected to reach 0.9600.
USD JPY, “US Dollar vs Japanese Yen”
The USD/JPY pair has extended its ascending wave. Possibly, today the price may fall towards 111.95 and then start another correction to reach 112.70.
AUD USD, “Australian Dollar vs US Dollar”
The AUD/USD pair is falling towards 0.7588. Later, in our opinion, the market may grow to reach 0.7650 and then fall to break 0.7588. The local target is at 0.7500.
USD RUB, “US Dollar vs Russian Ruble”
The USD/RUB pair is still forming in the center of the descending wave. After breaking this range to the downside, the price may reach the first target at 58.26. Later, in our opinion, the market may be corrected towards 59.30.
XAU USD, “Gold vs US Dollar”
Gold has broken its consolidation range to the downside and completed the descending wave by reaching 1222.22. After the market opening, the instrument is expected to grow towards 1259.10.
BRENT
Brent has extended the third ascending structure towards 49.60. Possibly, today the price may fall to reach 47.50 and the form the fifth structure with the target at 50.30. Later, in our opinion, the market may start another correction to reach 47.50.
Attention! Forecasts presented in this section only reflect the author’s private opinion and should not be considered as guidance for trading. RoboForex LP bears no responsibility for trading results based on trading recommendations described in these analytical reviews.
On Monday, the 3rd of July, the euro/dollar rate closed down. The US dollar rose against the single currency on the back of a technical correction, the closing of short positions on the dollar and low trading activity ahead of today’s national holiday in the US.
The dollar received additional support from some optimistic manufacturing PMI data. In June, the PMI for the manufacturing sector grew to 57.8, exceeding expectations of 55.0 and reaching its highest level since August 2014.
Day’s news (GMT+3):
USA: Independence Day;
11:30 UK: PMI construction (Jun);
12:00 Eurozone: PPI (May);
15:30 EU: ECB board member Praet’s speech;
16:30 Canada: Markit manufacturing PMI (Jun);
20:40 EU: ECB board member Yves Mersch’s speech.
EURUSD rate on the hourly. Source: TradingView.
Canada had a national holiday yesterday, while the US had a half day. US markets closed 3 hours early. On the 4th of July, Americans celebrate Independence Day. With a low trading volume expected, it’s possible that we’ll see some sharp price fluctuations in both directions in the hunt for stop levels.
Sellers have regained 76 pips of ground in the last 2 days. It’s not much, but I can assure you that the road is now open towards the support zone at 1.1330/38. A breakout here would trigger a mass closing of long positions and we would start to see the formation of a head and shoulders model with a target of 1.1152 (take a look at the daily chart).
At the time of writing this review, the euro is trading at 1.1369. The pair has been in a correctional phase for the last 13 hours. The market’s behavior is reminiscent of the correction from the 1.1392 low. I’m forecasting a fall for the euro to 1.1338 to complete its downward pivot. I’m not ruling out that this could turn into a complex structure with a target below 1.12. The market is thin, so keep an eye on the price’s behavior around 1.1332. With the euro/pound cross, keep an eye on 0.8720 – 0.8730.
The new rapprochement between Brussels and Beijing involves converging economic interests between Europe and China – and diverging strategic interests between Europe and America.
A day after the terror attacks of September 11, 2001, Le Monde declared that “we are all Americans.” But the honeymoon of shared suffering ended quickly when US military revenge raged across Afghanistan, Iraq, and elsewhere. Instead, a deep and broad transatlantic rift emerged, thanks to bitter disagreements about President Bush’s foreign policy revolution.
Today, many feel an odd sense of déjà vu.
Transatlantic rift déjà vu
A while ago, President Trump had barely left Europe to cope with the Russia debacle at home before German Chancellor Angela Merkel suggested that Trump’s America was no longer a reliably close ally. An outcry ensued, with analysts on both sides of the Atlantic warning about an epochal shift in relations. Afterwards, Chinese Premier Li Keqiang called for joint efforts to promote globalization during his visit to Germany.
It was that consensus that led China and the European Union (EU) to begin to pave a way to save a global pact against climate change from which Trump said he will withdraw. In a statement, by European Council President Donald Tusk, European Commission President Jean-Claude Juncker and Premier Li, the EU and China pledged they would commit to full implementation of the Paris Climate Agreement.
Concurrently, Washington grew apprehensive. The somber mood was reflected by the New York Times headline, “China Sees an Opening in Rift Between Trump and Germany.” As always, the shift was conceptualized as a reaction to a policy vacuum created by Trump. In reality, the ties between Brussels and Beijing have grown steadily since the 1990s, even when US-Chinese ties have fallen under pressures.
Like the US, the EU does believe in the West’s unique values and interests. But unlike Washington, Brussels does not believe that Europe should serve as a “shining light” to the rest of the world. Brussels does not share Washington’s strategic interest in global military superiority. Europe has occasionally supported America’s messianic regime changes, but usually with costly political aftermaths.
Just think of Tony Blair’s political collapse after the Iraq invasion; or French President Hollande’s drastic plunge in ratings after the French interventions in North Africa and the Middle East; or Prime Minister Matteo Renzi’s periodic military support for US “democracy promotion.” In the UK, the first paved way to David Cameron’s conservatives, whose continued reliance on US contributed to UK Brexit. In France, the second ensured Socialist fragmentation and Emmanuel Macron’s election triumph. And in Italy, the third opened the door to Beppe Grillo’s radical center-to-left Five Star Movement and Matteo Salvini’s radical center-to-right Northern League.
Shifts in China-EU-US Trade and Investment
In the past two decades, China has become a key trade partner to both the US States and the EU (see Figure 1).
Figure 1US and EU Economic Ties with China
Sources: EU data: European Commission. US data: (a) US International Trade Commission (USITC) DataWeb. (b)(c) Bureau of Economic Analysis (BEA). Note: There are significant differences between Chinese, US and EU data, due to the fact that same things are defined in a slightly different way. Also, US investment figures tend to be more conservative than some other estimates, for instance those by the Rhodium Group.
—————————-
In goods trade, both the US and the EU have a significant deficit with China. In both cases, Chinese imports exceed hundreds of billions of dollars. Yet, the US deficit is almost twice as large as that between the EU and China. Although China has become one of America’s fastest-growing export destinations, EU companies export to China almost twice as much as US multinationals.
In services trade, both the US and EU have a significant trade surplus with China. This is typical to economic cooperation between advanced economies, which are closer to the innovation frontier, and emerging economies, which seek to catch up the technology gap. Yet, in both cases, the surpluses were far bigger in the past. As Chinese companies become more competitive, the gap is shrinking.
While China would like the US to open its technology sector more broadly to Chinese firms, this has been challenging, due to Washington’s views about Chinese technology espionage and national security, as evidenced by high-profile merger and acquisitions (M&A) conflicts in the US, from the Chinese oil giant CNOOC in the early 2000s to its ICT giant Huawei in the early 2010s.
In foreign direct investment (FDI) stocks, both the US and the EU have significant deficits but those of the EU are three times larger than America’s, not least because EU companies have been far more eager to invest in China. Although EU firms have invested more in China than vice versa, this status quo has been shifting since the early 2010s as Chinese capital has begun to flow abroad. In the process, Chinese companies have been able to invest in Europe relatively far more than in the US.
Shifts in EU Members’ Trade Exposure
These trends are even more prominent if we shift focus from the EU toward its individual member states.
In the postwar era, when the United States briefly dominated almost half of the world economy, it was the leading exporter. With China, the picture has dramatically shifted in the past 15 years, ever since its membership in the World Trade Organization (WTO) – as evidenced by a comparison of the major EU member states’ trade exposure to the US and China.
The comparison suggests that, while the top-8 EU member economies, which account for more than 80 percent of the EU GDP, continue to export more to the US than to China in relative terms, Chinese imports are thriving in Europe. UK may export more to US than China, but imports are at the same level. The same goes for Germany, Europe’s largest growth engine, which is importing as much from China as it is exporting to China; and so is France. In Italy, this dialectic is even more prominent. And Europe’s smaller economies – Spain, Netherlands, Sweden, and Poland – reflect similar trends (Figure 2).
Figure 2 Top-8 EU Member States’ Trade Exposure to US and China
Note: Red balloons indicate trade exposure to China; blue balloons to the US.
Source: Data on US and Chinese exports and imports from CIA Country Book
In the coming years, Sino-EU trading ties are likely to increase via goods and services trade, as well as foreign investment. Moreover, as China is moving from net exports and investment toward consumption and innovation, the role of European technology companies and brands is likely to increase in China, while Sino-EU innovation cooperation could thrive as well.
Convergence of Sino-EU Economic Interests
In the Bush era, America and Europe nearly divorced because of disagreements about security. Today, the calls for annulment are fueled by a bitter split about economic ties and climate change. This was signaled particularly strongly by a recent report by Pew, which suggests that, in the Trump era, US image has suffered dramatically among publics around the world. Yet, the view is misguided because it suggests that the trend is recent and reflects mainly opposition to President Trump.
In reality, there is a longstanding US trend from postwar internationalism and free trade to post-Cold War nationalism and neo-protectionism. Trump’s election triumph was based on taking advantage of the trend, but he did not create it. While this trend did surface in the aftermath of Vietnam, following the 9/11 attacks and the 2008 Iraq troop surge, it has progressively strengthened since the 1990s, as evidenced by longitudinal polls of US publics. I is this trend that both European and Chinese leaders regard as America’s global risk (Figure 3).
Figure 3 From Postwar Internationalism to Post-Cold War Nationalism
Survey Question: “The U.S. should mind its own business internationally and let other countries get along the best they can on their own.”
Note: Post-1964 data from “Public Uncertain, Divided Over America’s Place in the World,” Pew Research Center, April 2016.
Source: Exploring America’s Role in a Turbulent World, RAND, Research Brief, 2017.
————————
It is not just Trump that is pushing Chancellor Merkel toward China, but almost three decades of neoconservative dreams of American Empire, Democrats’ liberal interventionism, and the progressive dissolution of American welfare state since the Reagan revolution. None of these ideas – imperial fantasies, regime change policies, and laissez-faire conservatism – have substantial support in Europe.
While the transatlantic economies tend to share similar values, their interests are diverging, even as those between China and the EU are converging. In the latter case, Beijing, particularly due to the mainland’s interest in global economic integration and climate change mitigation, shares far more with the EU than Washington with Brussels. This shift is not something that should be attributed to Trump alone. It is a divide that, historically, originates from the Reagan revolution.
About the Author:
Dan Steinbock is the founder of the Difference Group and has served as the research director at the India, China, and America Institute (USA) and a visiting fellow at the Shanghai Institutes for International Studies (China) and the EU Center (Singapore). For more information, see http://www.differencegroup.net/
This commentary was initially released by China-US Focus, July 1, 2017
At the daily chart of AUD USD, the price reached the resistance level. At the H4 chart, the pair formed several reversal patterns. The downside target is the closest support level at 0.7624.
EUR USD, “Euro vs. US Dollar”
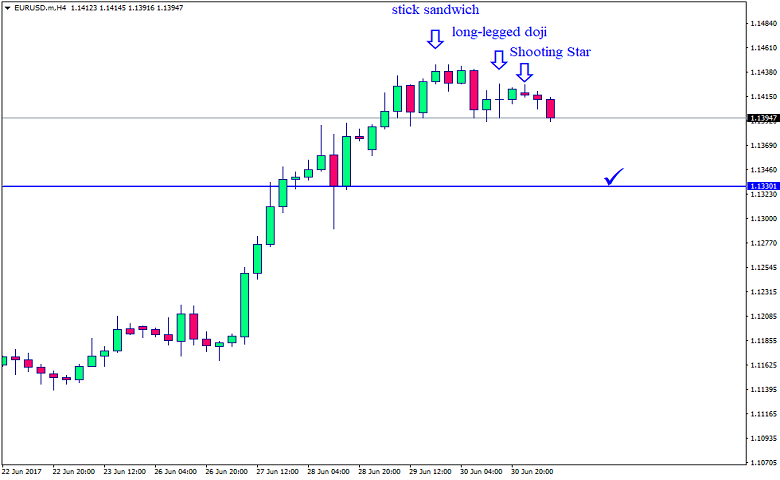
At the daily chart of EUR USD, the price completed Hanging Man reversal pattern, which is also confirmed by several patterns from the H4 chart – Stick Sandwich, Long-legged Doji, and Shooting Star. The downside target is the support level at 1.1330.
Attention! Forecasts presented in this section only reflect the author’s private opinion and should not be considered as guidance for trading. RoboForex LP bears no responsibility for trading results based on trading recommendations described in these analytical reviews.
The EUR/USD pair has rebounded from its highs, finished another descending impulse, and right now is forming the second one. After breaking 1.1388 to the downside, the instrument may fall to reach 1.1332 and, as a result, break the channel of the fifth ascending wave and complete the current growth. Later, in our opinion, the market may move downwards with the target at 1.0900. The first predicted target is at 1.1180. while moving inside the ascending channel, the pair may choose an alternative scenario and grow to reach 1.1466.
GBP USD, “Great Britain Pound vs US Dollar”
The GBP/USD pair is forming the second descending impulse. Possibly, today the price may break 1.2940 to the downside. The local target is at 1.2860.
USD CHF, “US Dollar vs Swiss Franc”
The USD/CHF pair is forming the second ascending impulse. Possibly, the price may reach 0.9640 and then start another correction towards 0.9596. After that, the instrument may start a new ascending wave with the first predicted target at 0.9775.
USD JPY, “US Dollar vs Japanese Yen”
The USD/JPY pair has returned to 111.80 and right now is forming another correction towards 112.66. Possibly, today the price may complete the current growth and start forming another descending impulse. Later, in our opinion, the market may break 111.80 and then continue falling to reach 110.70.
AUD USD, “Australian Dollar vs US Dollar”
The AUD/USD pair is consolidating at the top of the ascending wave. We think, today the price may fall towards 0.7650 and then grow to reach 0.7680. After breaking 0.7650 to the downside, the instrument may continue falling inside the downtrend with the target at 0.7500.
USD RUB, “US Dollar vs Russian Ruble”
The USD/RUB pair is still forming the fifth descending structure with the target at 58.25. We think, today the price may reach the above-mentioned target. Later, in our opinion, the market may be corrected to reach 59.30.
XAU USD, “Gold vs US Dollar”
Gold has reached the target of another five-wave descending structure. We think, today the price may grow to reach 1246.70. If later the market breaks 1247.00 to the upside, the instrument may be corrected towards 1259.15; if it breaks 1238.25 to the downside, it may continue its decline with the target at 1222.22.
BRENT
Brent has reached the local predicted target. Possibly, the price may extend this structure towards 49.40. Later, in our opinion, the market may start another correction with the target at 47.36 and then resume moving upwards to reach 50.25.
Attention! Forecasts presented in this section only reflect the author’s private opinion and should not be considered as guidance for trading. RoboForex LP bears no responsibility for trading results based on trading recommendations described in these analytical reviews.
It is beyond debate that the disciplined trader is the long term successful trader, but how to maintain discipline, through the early fledgling part of your trading career, is one of the key challenges we all face as traders. And unless we get this aspect of our trading right (from the very start) then it’s unlikely we’ll ever enjoy trading success. How we work on our discipline is a relatively simple process, but similar to creating a trading plan, it’s often overlooked as one of essential ingredients required.
Trading plan
The trading plan offers an unbeatable anchor for your discipline; it provides focus, precision and certainty. If you set out your basic trading plan blueprint and then continue to refine it until it represents a bulletproof document that you have faith in, then it’s a lot easier to maintain your discipline. Within your plan, if you’re trading manually, should be: a limit on your losses, the times you trade, the risk per trade you take, the risk per day you take etc. It’s essential that you make a commitment to never breach this plan during trading times, you only ever adjust it on an EOD (end of day) basis, when you’re free to make adjustments.
Automation
By association, automating or semi-automating your trading plan, should cause discipline to then also become automatic. Emotions can interfere with your trading in many ways, in removing any temptation to manually interfere in your trading, you’re indirectly obtaining the immediate benefit of automation. Your discipline is then concentrated on simply observing and occasionally overriding your automation.
Letting trades come to you
We need to develop the discipline of not chasing the market and instead think about letting the market come to us. We can do this by setting market entry orders, or perhaps by creating alerts and alarms, to be triggered on our smartphones.
Never panic, never manually intervene
As we’re often fond of repeating; once you’ve committed to take a trade then you’re already invested, you need to consider the risk you’ve taken as the price you’re paying to do business in our business. Never alter your stop by widening it, because you become convinced that a trade that’s looking bad will eventually turn in your favor. If you do then you’re automatically interfering in the often random distribution between winners and losers, and you’ll be abusing and corrupting any trading edge that you may have developed.
Walk away
There are times when you simply need to walk away from your computer and trading platform and take a short break. Trading can (very quickly) become a business that you begin to dislike if you’re experiencing an overload of stress, or incurring large and avoidable losses. And enthusiasm is essential to maintain our healthy involvement in the industry. If you find that you’re intervening in trades, corrupting your trading plan, panicking and overall losing your discipline then take a break. If you find yourself (as a manual trader), constantly chained to your desk and your personal trading computer, then you’re trading in a way that is common to novice traders who initially discover trading as a potential career and you’re making a classic mistake that needs correcting ASAP.
You will not engineer trading success and profitability by spending hours staring at charts, the time you spend immersed in the market needs to be far better utilized. Spend it applying fundamental research into what moves the Forex markets or spend it experimenting on a demo account with various alternative trading strategies, but overall spend it wisely.
Do you think that you should play the field a bit, sew your wild oats? Or are you the committed type, wishing to settle down? Maybe you’re the single friend with commitment issues that is sporting a new squeeze every night of the week, or the marry-the-high-school-sweetheart type?
Well, wouldn’t you know it? In trading you can just as naturally choose to be monogamous or polygamous. Though, admittedly, not with the same consequences.
Whilst there are advantages to being polygamous, there are also advantages to being a monogamous trader.
Trading is clearly a very dynamic enterprise. Markets are never static, some can heat up, whilst others drop off. Think about recent trends in world share markets, where every few cycles there is a new emerging market that displaces the more mature market. The financial newspapers are full of them, calling the new trends and putting a fork in the old ones.
Because of this, there is a natural tendency to act polygamously and jump to each new market that shows promise of an uptrend (or downtrend). Money managers beat their competitors by finding the new growth markets and directing their assets towards the areas of growth. One need only think of the not too recent BRIC fascination to remember how fund allocations were geared toward these “growth” markets.
Even if you are not the dynamic, risk seeking trader, most traders don’t want to get caught trading in a quiet, non-growth market. It is easier to ride a wave than sit in a paddle boat pushing yourself along. And smarter too.
But there is one main reason to not necessarily ditch your paddleboat and stay with your high school sweetheart of a market.
That reason is experience.
The main advantage of monogamous trading is that you have developed a deep understanding of the market that you are trading. In forex, its years spent developing an intimate knowledge of the fundamental aspects of the pair. You know the movements of the markets, the size of the daily variations. The times where volatility is best for trading. When the news comes out. After a while you know this like the back of your hand. You can anticipate because you have immersed yourself in the charts, the news and have the strong unassailable advantage of this experience.
The same holds true for market segments, or stocks. If you have an expertise in a market area, intimate knowledge of the market shares of each company, the market caps, how they work and their comparative strengths and weaknesses, you have something that cannot be duplicated in another segment without a lot of effort.
And the importance is more than simply a deep capability and understanding. The issue with polygamous trading is that it encourages over-analysis, as you make up for a lack of knowledge or feel or understanding of the variables and trade inefficiently. Monogamous trading avoids overtrading, in a sense the opposite of over analysis, where your lack of knowledge lets you make foolish trades. Monogamy helps prevent the temptation to trade by following the next shiny new market and jumping in, effectively controlling risk better.
So, whilst there are many fine reasons to trade like a polygamous trader, it’s always good to remember that sometimes the grass is not always greener. Sometimes it’s best to simply find that one you love and want to spend the rest of your life with.
About the Author:
Adinah Brown is a professional writer who has worked in a wide range of industry settings, including corporate industry, government and non-government organizations. Within many of these positions, Adinah has provided skilled marketing and advertising services and is currently the Content Manager at Leverate.
On Friday the 30th of June, trading on the euro/dollar pair closed down. On the last day of the week, month and quarter, buyers retreated from the 1.1445 high to 1.1392 (-53). During the month of June, the euro appreciated by 1.55% (+175 pips). During the second quarter, it rose by 7.11% (+750 pips). I believe that this is a technical correction that still hasn’t come to an end. Markets ignored the statistics released before the long weekend in the US and Canada.
US statistics:
The personal income index in May grew by 0.4% (forecast: 0.3%, previous reading: 0.4%). The personal spending index for May grew by 0.1% (forecast: 0.1%, previous reading: 0.4%).
The Chicago PMI grew to 65.7% (forecast: 58%, previous reading: 59.4%).
The Michigan University consumer sentiment index fell to 95.1% (forecast: 94.5%, previous reading: 97.1%).
Day’s news (GMT+3):
09:30 Australia: RBA commodity index (Jun);
10:15 Switzerland: real retail sales (May);
10:15 Spain: Markit manufacturing PMI (Jun);
10:30 Switzerland: SVME PMI (Jun);
10:45 Italy: Markit manufacturing PMI (Jun);
10:50 France: Markit manufacturing PMI (Jun);
10:55 Germany: Markit manufacturing PMI (Jun);
11:00 Italy: unemployment (May);
11:30 UK: Markit manufacturing PMI (Jun);
11:30 USA: Fed’s Bullard speech;
12:00 EU: unemployment rate (May);
15:00 UK: BoE’s governor Carney speech;
16:45 USA: Markit manufacturing PMI (Jun);
17:00 USA: ISM prices paid (Jun), ISM manufacturing PMI (Jun), construction spending (May);
20:30 UK: MPC member Haldane’s speech;
22:30 USA: total vehicle sales (Jun).
EURUSD rate on the hourly. Source: TradingView.
The price has corrected by 45 degrees from the 1.1445 high. The LB balance line has provided additional support for the single currency. At the time of writing this review, the pair is trading in sideways trend at around 1.1413.
So, what can we expect from our pair on Monday? The news block is dense, but because of the fact that it’s Monday, I won’t be paying attention to it. Exchanges in the US and Canada are closed today due to national holidays. Because of this, a reduction in trading volume on currency markets is expected.
The euro closed down on Friday, but given that the bearish impulse was exhausted in the first half of the day, and that the pair spent the rest of the day in a sideways trend, I’m not expecting Monday to work against Friday. Still, according to the Stochastic oscillator, we’re going to see a lot of buying over the next 3-4 hours.
I’m forecasting a recovery to 1.1424 (triangular formation) followed by a drop to 1.1365 (67 degrees). Because of the national holidays in the US and Canada, I’m not so sure about my prediction coming true. European traders will have a window for bringing the price down until 15:00 (EEST). If they don’t take this opportunity, however, the price should stay flat until Wednesday. If the hourly candlestick closes above 1.1430, we can forget about the rate dropping.
Key events this week: UK & US PMI indices, RBA rate decision, FOMC meeting minutes, US unemployment rate, nonfarm payrolls.
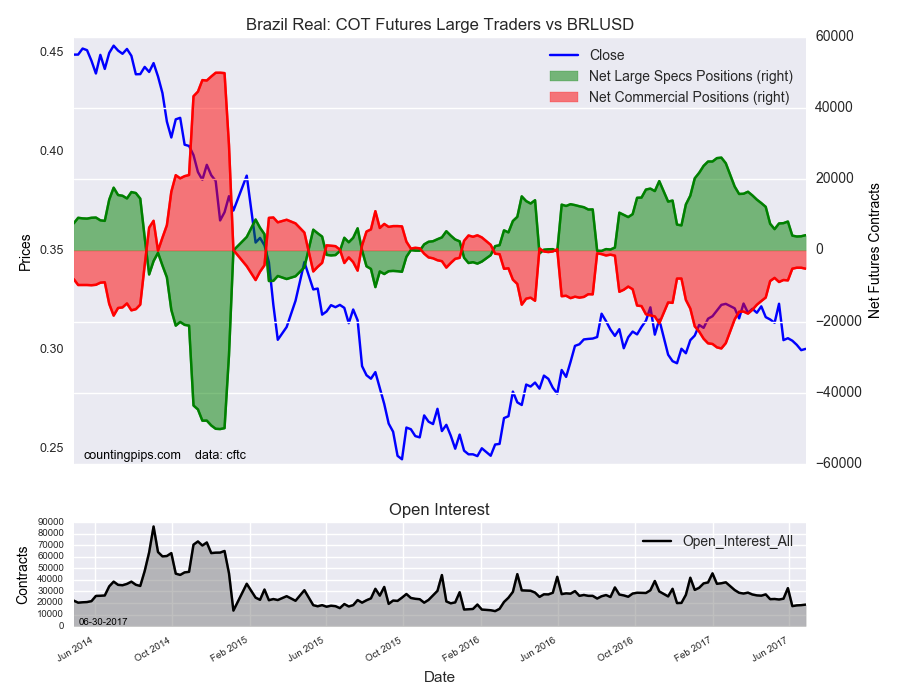
Large speculators increased their net positions in the Brazil Real futures markets for a second straight week this week, according to the latest Commitment of Traders (COT) data released by the Commodity Futures Trading Commission (CFTC) on Friday.
The non-commercial futures contracts of Brazil Real futures, traded by large speculators and hedge funds, totaled a net position of 4,282 contracts in the data reported through Tuesday June 27th. This was a weekly rise of 312 contracts from the previous week which had a total of 3,970 net contracts.
The two small rises in bullish net positions the past two weeks have brought the overall net position to its highest level of the past five weeks. Despite the past weekly rises, the net position has now remained under the +10,000 threshold for nine weeks in a row.
Brazil Real Commercial Positions:
The commercial traders position, categorized by the CFTC as hedgers or traders engaged in buying and selling for business purposes, totaled a net position of -5,145 contracts on the week. This was a weekly decrease of -281 contracts from the total net of -4,864 contracts reported the previous week.
BRLUSD:
Over the same weekly reporting time-frame, from Tuesday to Tuesday, the BRLUSD Currency Pair closed at approximately $0.3006 which was an advance of $0.0007 from the previous close of $0.2909, according to unofficial market data.
*COT Report: The COT data, released weekly to the public each Friday, is updated through the most recent Tuesday (data is 3 days old) and shows a quick view of how large speculators or non-commercials (for-profit traders) as well as the commercial traders (hedgers & traders for business purposes) were positioned in the futures markets. The CFTC categorizes trader positions according to commercial hedgers (traders who use futures contracts for hedging as part of the business), non-commercials (large traders who speculate to realize trading profits) and nonreportable traders (usually small traders/speculators). Find CFTC criteria here: (http://www.cftc.gov/MarketReports/CommitmentsofTraders/ExplanatoryNotes/index.htm).
US Dollar Index Non-Commercial Speculator Positions:
Large speculators reduced their net positions in the US Dollar Index futures markets this week for a third consecutive week, according to the latest Commitment of Traders (COT) data released by the Commodity Futures Trading Commission (CFTC) on Friday.
The non-commercial futures contracts of US Dollar Index futures, traded by large speculators and hedge funds, totaled a net position of 5,458 contracts in the data reported through Tuesday June 27th. This was a weekly decline of -162 contracts from the previous week which had a total of 5,620 net contracts.
The current US Dollar Index speculative level is at its lowest point since June 10th 2014 when speculators held a small bearish position (-38 contracts).
US Dollar Index Commercial Positions:
The commercial traders position, categorized by the CFTC as hedgers or traders engaged in buying and selling for business purposes, totaled a net position of -10,534 contracts on the week. This was a weekly rise of 763 contracts from the total net of -11,297 contracts reported the previous week.
UUP:
Over the same weekly reporting time-frame, from Tuesday to Tuesday, the UUP ETF, which tracks the price of US Dollar Index, closed at approximately $24.91 which was a shortfall of $-0.36 from the previous close of $25.27, according to unofficial market data.
*COT Report: The COT data, released weekly to the public each Friday, is updated through the most recent Tuesday (data is 3 days old) and shows a quick view of how large speculators or non-commercials (for-profit traders) as well as the commercial traders (hedgers & traders for business purposes) were positioned in the futures markets. The CFTC categorizes trader positions according to commercial hedgers (traders who use futures contracts for hedging as part of the business), non-commercials (large traders who speculate to realize trading profits) and nonreportable traders (usually small traders/speculators). Find CFTC criteria here: (http://www.cftc.gov/MarketReports/CommitmentsofTraders/ExplanatoryNotes/index.htm).