Author Archive for InvestMacro – Page 536

Forex Speculators cut US Dollar bullish positions to lowest level in 13 months

By CountingPips.comGet our weekly COT Reports by Email

US Dollar net speculator positions fell to $0.135 billion last week

The latest data for the weekly Commitment of Traders (COT) report, released by the Commodity Futures Trading Commission (CFTC) on Friday, showed that large traders and currency speculators reduced their bullish bets for the US dollar last week for a second straight week and to the lowest level in over thirteen months.

Non-commercial large futures traders, including hedge funds and large speculators, had an overall US dollar long position totaling $0.135 billion ($135 million) as of Tuesday July 3rd, according to the latest data from the CFTC and dollar amount calculations by Reuters. This was a weekly decline of $-4.365 billion from the $4.50 billion total long position that was registered the previous week, according to the Reuters calculation (totals of the US dollar contracts against the combined contracts of the euro, British pound, Japanese yen, Australian dollar, Canadian dollar and the Swiss franc).

The aggregate speculative net position for the dollar has fallen by $-7.685 billion in the last two weeks and is now at the lowest level since May 17th 2016 when the net position totaled $-4.19 billion.


Weekly Speculator Contract Changes:

The individual major currency contract levels saw major movements this week with five major currencies seeing weekly changes above the 10,000 contract mark.

  • The euro saw its speculator position go higher by over +18,000 contracts and pushed its bullish level to the highest since June 13th
  • The British pound sterling rose by over +11,000 contracts this week and its short position fell to its best level in six weeks
  • Canadian dollar positions rose by over +10,000 contracts for a second straight week and CAD bets overall, have increased for the sixth straight week
  • Japanese yen positions dropped sharply for a 2nd straight week and are now at the most bearish level since January 17th 2017
  • Australian dollar positions gained by over +12,000 net contracts this week and pushed the AUD bullish level to its best net position in nine weeks at over +32,000 contracts

The major currencies that improved against the US dollar last week were the euro (18,769 weekly change in contracts), British pound sterling (11,366 contracts), Swiss franc (4,556 contracts), Canadian dollar (10,123 contracts), Australian dollar (12,665 contracts), New Zealand dollar (3,900 contracts) and the Mexican peso (3,852 contracts).

The currency whose speculative bets declined last week versus the dollar was just the Japanese yen (-13,686 weekly change in contracts).


Table of Weekly Commercial Traders and Speculators Levels & Changes:

CurrencyNet CommercialsComms Weekly ChgNet SpeculatorsSpecs Weekly Chg
EuroFx-100,041-24,53677,46418,769
GBP24,751-18,443-27,76711,366
JPY98,18316,173-75,036-13,686
CHF-2,505-5,724-1134,556
CAD32,293-15,685-39,37210,123
AUD-38,910-18,45932,41412,665
NZD-31,299-4,97429,1333,900
MXN-93,985-7,47484,8593,852


This latest COT data is through Tuesday and shows a quick view of how large speculators or non-commercials (for-profit traders) as well as the commercial traders (hedgers & traders for business purposes) were positioned in the futures markets. All currency positions are in direct relation to the US dollar where, for example, a bet for the euro is a bet that the euro will rise versus the dollar while a bet against the euro will be a bet that the dollar will gain versus the euro.


Weekly Charts: Large Trader Weekly Positions vs Price

EuroFX:


British Pound Sterling:


Japanese Yen:


Swiss Franc:


Canadian Dollar:


Australian Dollar:


New Zealand Dollar:


Mexican Peso:

*COT Report: The weekly commitment of traders report summarizes the total trader positions for open contracts in the futures trading markets. The CFTC categorizes trader positions according to commercial hedgers (traders who use futures contracts for hedging as part of the business), non-commercials (large traders who speculate to realize trading profits) and nonreportable traders (usually small traders/speculators). Find CFTC criteria here: (http://www.cftc.gov/MarketReports/CommitmentsofTraders/ExplanatoryNotes/index.htm).

The Commitment of Traders report is published every Friday by the Commodity Futures Trading Commission (CFTC) and shows futures positions data that was reported as of the previous Tuesday (3 days behind).

Each currency contract is a quote for that currency directly against the U.S. dollar, a net short amount of contracts means that more speculators are betting that currency to fall against the dollar and a net long position expect that currency to rise versus the dollar.

(The charts overlay the forex closing price of each Tuesday when COT trader positions are reported for each corresponding spot currency pair.) See more information and explanation on the weekly COT report from the CFTC website.

Article by CountingPips.com


WTI Crude Oil Speculator positions rose for 1st time in four weeks

By CountingPips.comReceive our weekly COT Reports by Email

WTI Crude Oil Non-Commercial Speculator Positions:

Large speculators raised their bullish net positions in the WTI Crude Oil futures markets this week following three straight weekly declines, according to the latest Commitment of Traders (COT) data released by the Commodity Futures Trading Commission (CFTC) on Friday.

The non-commercial futures contracts of WTI Crude Oil futures, traded by large speculators and hedge funds, totaled a net position of 341,047 contracts in the data reported through Tuesday July 3rd. This was a weekly boost of 13,859 contracts from the previous week which had a total of 327,188 net contracts.

Crude speculative positions had dropped by over -55,000 net contracts in the previous three weeks before this week’s rebound. The speculative position has now been under the +400,000 contract level for ten straight weeks after falling below this threshold on April 25th.

WTI Crude Oil Commercial Positions:

The commercial traders position, categorized by the CFTC as hedgers or traders engaged in buying and selling for business purposes, totaled a net position of -338,146 contracts on the week. This was a weekly rise of 8,192 contracts from the total net of -346,338 contracts reported the previous week.

USO:

Over the same weekly reporting time-frame, from Tuesday to Tuesday, the USO Crude Oil ETF, which tracks the price of WTI crude oil, closed at approximately $9.62 which was an increase of $0.52 from the previous close of $9.1, according to unofficial market data.

*COT Report: The COT data, released weekly to the public each Friday, is updated through the most recent Tuesday (data is 3 days old) and shows a quick view of how large speculators or non-commercials (for-profit traders) as well as the commercial traders (hedgers & traders for business purposes) were positioned in the futures markets. The CFTC categorizes trader positions according to commercial hedgers (traders who use futures contracts for hedging as part of the business), non-commercials (large traders who speculate to realize trading profits) and nonreportable traders (usually small traders/speculators). Find CFTC criteria here: (http://www.cftc.gov/MarketReports/CommitmentsofTraders/ExplanatoryNotes/index.htm).

Article by CountingPips.comWeekly COT Report


10-Year Note Speculators cut back on bullish net positions for 2nd week

By CountingPips.comReceive our weekly COT Reports by Email

10-Year Note Non-Commercial Speculator Positions:

Large speculators sharply lowered their bullish net positions in the 10-Year Note futures markets this week for a second consecutive week, according to the latest Commitment of Traders (COT) data released by the Commodity Futures Trading Commission (CFTC) on Friday.

The non-commercial futures contracts of 10-Year Note futures, traded by large speculators and hedge funds, totaled a net position of 262,962 contracts in the data reported through Tuesday July 3rd. This was a weekly decrease of -39,136 contracts from the previous week which had a total of 302,098 net contracts.

Speculators have reduced their bullish bets by -82,210 net contracts over the past two weeks although positions remain firmly bullish and over the +200,000 net contract for a ninth straight week.

10-Year Note Commercial Positions:

The commercial traders position, categorized by the CFTC as hedgers or traders engaged in buying and selling for business purposes, totaled a net position of -101,597 contracts on the week. This was a weekly gain of 42,277 contracts from the total net of -143,874 contracts reported the previous week.

IEF ETF:

Over the same weekly reporting time-frame, from Tuesday to Tuesday, the 7-10 Year Treasury Bond ETF (IEF) closed at approximately $106.06 which was a loss of $-1.30 from the previous close of $107.36, according to unofficial market data.

*COT Report: The COT data, released weekly to the public each Friday, is updated through the most recent Tuesday (data is 3 days old) and shows a quick view of how large speculators or non-commercials (for-profit traders) as well as the commercial traders (hedgers & traders for business purposes) were positioned in the futures markets. The CFTC categorizes trader positions according to commercial hedgers (traders who use futures contracts for hedging as part of the business), non-commercials (large traders who speculate to realize trading profits) and nonreportable traders (usually small traders/speculators). Find CFTC criteria here: (http://www.cftc.gov/MarketReports/CommitmentsofTraders/ExplanatoryNotes/index.htm).

Article by CountingPips.comWeekly COT Report


Gold Speculators continued to sharply lower their bets for 4th week

By CountingPips.comReceive our weekly COT Reports by Email

Gold Non-Commercial Speculator Positions:

Large speculators once again cut back on their net positions in the Gold futures markets this week for a fourth consecutive week, according to the latest Commitment of Traders (COT) data released by the Commodity Futures Trading Commission (CFTC) on Friday.

The non-commercial futures contracts of Gold futures, traded by large speculators and hedge funds, totaled a net position of 93,799 contracts in the data reported through Tuesday July 3rd. This was a weekly decrease of -37,873 contracts from the previous week which had a total of 131,672 net contracts.

The sharp drop in speculative gold bets brings the decline over the past four weeks to a total of -110,666 net contracts. Gold net positions have also now fallen below the +100,000 contract threshold for the first time since January 3rd of this year.

Gold Commercial Positions:

The commercial traders position, categorized by the CFTC as hedgers or traders engaged in buying and selling for business purposes, totaled a net position of -107,226 contracts on the week. This was a weekly gain of 42,637 contracts from the total net of -149,863 contracts reported the previous week.

GLD ETF:

Over the same weekly reporting time-frame, from Tuesday to Tuesday, the GLD ETF, which tracks the price of gold, closed at approximately $116.09 which was a decrease of $-2.72 from the previous close of $118.81, according to unofficial market data.

*COT Report: The COT data, released weekly to the public each Friday, is updated through the most recent Tuesday (data is 3 days old) and shows a quick view of how large speculators or non-commercials (for-profit traders) as well as the commercial traders (hedgers & traders for business purposes) were positioned in the futures markets. The CFTC categorizes trader positions according to commercial hedgers (traders who use futures contracts for hedging as part of the business), non-commercials (large traders who speculate to realize trading profits) and nonreportable traders (usually small traders/speculators). Find CFTC criteria here: (http://www.cftc.gov/MarketReports/CommitmentsofTraders/ExplanatoryNotes/index.htm).

Article by CountingPips.comWeekly COT Report

S&P500 Speculators increased bullish net positions to 10-week high

By CountingPips.comReceive our weekly COT Reports by Email

S&P500 Non-Commercial Speculator Positions:

Large speculators continued to increase their net positions in the S&P500 futures markets this week for a fifth consecutive week, according to the latest Commitment of Traders (COT) data released by the Commodity Futures Trading Commission (CFTC) on Friday.

The non-commercial futures contracts of S&P500 futures, traded by large speculators and hedge funds, totaled a net position of 2,279 contracts in the data reported through Tuesday July 3rd. This was a weekly lift of 466 contracts from the previous week which had a total of 1,813 net contracts.

S&P500 speculators have now pushed their bullish bets to the highest level since April 25th when net positions totaled +4,238 contracts.

S&P500 Commercial Positions:

The commercial traders position, categorized by the CFTC as hedgers or traders engaged in buying and selling for business purposes, totaled a net position of -11,802 contracts on the week. This was a weekly decline of -101 contracts from the total net of -11,701 contracts reported the previous week.

SPY ETF:

Over the same weekly reporting time-frame, from Tuesday to Tuesday, the SPY ETF, which tracks the price of S&P500 Index, closed at approximately $242.21 which was an increase of $0.88 from the previous close of $241.33, according to unofficial market data.

*COT Report: The COT data, released weekly to the public each Friday, is updated through the most recent Tuesday (data is 3 days old) and shows a quick view of how large speculators or non-commercials (for-profit traders) as well as the commercial traders (hedgers & traders for business purposes) were positioned in the futures markets. The CFTC categorizes trader positions according to commercial hedgers (traders who use futures contracts for hedging as part of the business), non-commercials (large traders who speculate to realize trading profits) and nonreportable traders (usually small traders/speculators). Find CFTC criteria here: (http://www.cftc.gov/MarketReports/CommitmentsofTraders/ExplanatoryNotes/index.htm).

Article by CountingPips.comWeekly COT Report

Silver Speculators continued to pare their bullish net positions for 4th week

By CountingPips.comReceive our weekly COT Reports by Email

Silver Non-Commercial Speculator Positions:

Large speculators cut back on their net positions in the Silver futures markets this week for a fourth consecutive week, according to the latest Commitment of Traders (COT) data released by the Commodity Futures Trading Commission (CFTC) on Friday.

The non-commercial futures contracts of Silver futures, traded by large speculators and hedge funds, totaled a net position of 26,275 contracts in the data reported through Tuesday July 3rd. This was a weekly decline of -9,257 contracts from the previous week which had a total of 35,532 net contracts.

Silver speculative positions have fallen by just around -40,000 contracts in the past four weeks and the current standing is now the lowest level since January 12th 2016.

Silver Commercial Positions:

The commercial traders position, categorized by the CFTC as hedgers or traders engaged in buying and selling for business purposes, totaled a net position of -39,228 contracts on the week. This was a weekly boost of 10,980 contracts from the total net of -50,208 contracts reported the previous week.

SLV ETF:

Over the same weekly reporting time-frame, from Tuesday to Tuesday, the SLV ishares ETF, which tracks the price of silver, closed at approximately $15.30 which was a decline of $-0.49 from the previous close of $15.79, according to unofficial market data.

*COT Report: The COT data, released weekly to the public each Friday, is updated through the most recent Tuesday (data is 3 days old) and shows a quick view of how large speculators or non-commercials (for-profit traders) as well as the commercial traders (hedgers & traders for business purposes) were positioned in the futures markets. The CFTC categorizes trader positions according to commercial hedgers (traders who use futures contracts for hedging as part of the business), non-commercials (large traders who speculate to realize trading profits) and nonreportable traders (usually small traders/speculators). Find CFTC criteria here: (http://www.cftc.gov/MarketReports/CommitmentsofTraders/ExplanatoryNotes/index.htm).

Article by CountingPips.comWeekly COT Report


Copper Speculators raised bullish net positions for 2nd week

By CountingPips.comReceive our weekly COT Reports by Email

Copper Non-Commercial Speculator Positions:

Large speculators lifted their net positions in the Copper futures markets this week for a second straight week, according to the latest Commitment of Traders (COT) data released by the Commodity Futures Trading Commission (CFTC) on Friday.

The non-commercial futures contracts of Copper futures, traded by large speculators and hedge funds, totaled a net position of 16,345 contracts in the data reported through Tuesday July 3rd. This was a weekly gain of 2,657 contracts from the previous week which had a total of 13,688 net contracts.

Copper speculative positions are now at the best level in three weeks and have remained above the +10,000 level for five straight weeks after falling below that level in May 30th.

Copper Commercial Positions:

The commercial traders position, categorized by the CFTC as hedgers or traders engaged in buying and selling for business purposes, totaled a net position of -17,521 contracts on the week. This was a weekly decrease of -2,511 contracts from the total net of -15,010 contracts reported the previous week.

JJC ETF:

Over the same weekly reporting time-frame, from Tuesday to Tuesday, the JJC iPath Bloomber Copper ETN, which tracks the price of copper, closed at approximately $30.55 which was a boost of $0.48 from the previous close of $30.07, according to unofficial market data.

*COT Report: The COT data, released weekly to the public each Friday, is updated through the most recent Tuesday (data is 3 days old) and shows a quick view of how large speculators or non-commercials (for-profit traders) as well as the commercial traders (hedgers & traders for business purposes) were positioned in the futures markets. The CFTC categorizes trader positions according to commercial hedgers (traders who use futures contracts for hedging as part of the business), non-commercials (large traders who speculate to realize trading profits) and nonreportable traders (usually small traders/speculators). Find CFTC criteria here: (http://www.cftc.gov/MarketReports/CommitmentsofTraders/ExplanatoryNotes/index.htm).

Article by CountingPips.comWeekly COT Report


Mechanical Trader Education Process

By ProfessionalTradingSystems.com

In this article I am going to share my personal educational process I`ve gone through to become a successful mechanical Forex trader. At the beginning of my trading career I was Elliott Wave practitioner – I was counting waves and placing trades based on a subjective interpretation of 13 different chart patterns presumably visible on all markets and timeframes. I had some moderate success but noting special and to be proud of.

After some time I decided to try a mechanical system bought from one famous trader and gave it a try. In the next 2 years I was comparing my Elliott Wave performance to my automated trading results. Clearly and by far my algo style did produce some excellent results so I decided to commit fully of becoming a mechanical trader who can create trading systems by himself.

I thought that best way to do that is to purchase some trading systems available for sale in Internet and then to compare the concepts behind their creation. I bought a few systems from different vendors and within different price range.  Because I wanted to educate myself I was looking for vendors who reveal all trading rules of offered automated systems. I was not interested in just buying some blackbox software which will trade instead of me because it would have been no educational element it them. I didn’t care if strategy code was included in the package or not.

So after a purchase I was scrutinizing trading rule by trading rule in order to see what difference it makes to the performance and then I was observing its application to the real time results. By this process I have learned what works and what doesn’t. Countless hours of optimization I`ve spent on every system and then comparing real time results with expected ones based on backtests.

After I had some experience with lots of systems I was able to figure out what makes a system with good potential of future success and what makes a system good backtest performer and poor real time doer.

I`ve done this simply by observing which system is doing better and which is doing worse real time and what are the difference between them in terms of  backtesting length, concept sophistication and so other metrics like profit factor, average trade length ect . It was clear to me for example that more added inputs to a system makes it do better in backtest but in real time conditions it just fails. We called it this curvefitting or overfitting.

Now my main purpose when creating a mechanical system is to keep its trading rules as simple as possible. I am not willing trade a system with too many rules. Fewer rules makes it much more harder to a trader to overfit  it.

I think that having an experience with good and poor trading systems which have been already developed by experienced traders is the fastest way to learn how to be a successful mechanical trader.  I`ve done it this way and it should work for every one willing to put some work in order to be profitable Forex trader.

Article by Professional Trading Systems –  Forex Mechanical and Automated Systems


Ichimoku Cloud Analysis 07.07.2017 (AUD/USD, NZD/USD, USD/CAD)

Article By RoboForex.com

AUD USD, “Australian Dollar vs US Dollar”

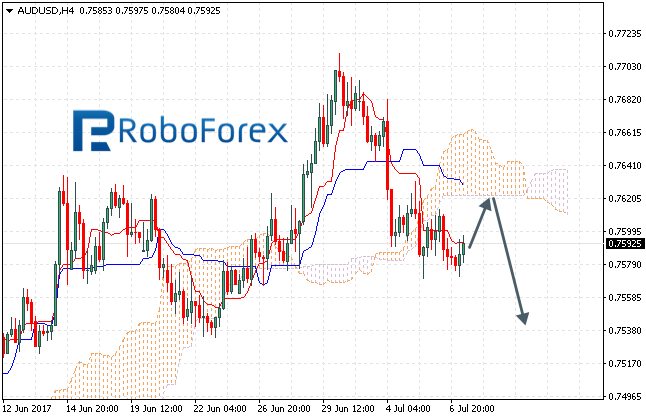
The AUD/USD pair is trading at 0.7592; it is still moving below Ichimoku Cloud, which means that it may continue falling. We should expect the price to test the downside border of the cloud close to 0.7620 and then continue moving downwards below 0.7530. However, this scenario may be cancelled if the price breaks the upside border of the cloud and fixes above 0.7650. In this case, the instrument may continue growing towards 0.7740.


NZD/USD, “New Zealand Dollar vs US Dollar”

The NZD/USD pair is trading at 0.7279; it is moving inside Ichimoku Cloud, which means that it will continue moving sideways until leaving the cloud. We should expect the price to test the downside border of the cloud at 0.7270 and then continue moving upwards to reach the upside one at 0.7305. If the pair breaks the upside border and fixes above 0.7320, the price may continue moving upwards. However, the scenario that implies further growth may be cancelled if the price breaks the downside border of the cloud and fixes below 0.7250. In this case, the instrument may continue falling towards 0.7180 and lower.


USD/CAD, “US Dollar vs Canadian Dollar”

The USD/CAD pair is trading at 1.2984; it is still moving below Ichimoku Cloud, which means that it may continue falling. We should expect the price to test the downside border of the cloud at 1.3010 and then and then continue moving downwards to reach 1.2810. However, this scenario may be cancelled if the price breaks the upside border of the cloud and fixes above 1.3140. In this case, the instrument may continue growing towards 1.3230 and higher.


RoboForex Analytical Department

Article By RoboForex.com

Attention!
Forecasts presented in this section only reflect the author’s private opinion and should not be considered as guidance for trading. RoboForex LP bears no responsibility for trading results based on trading recommendations described in these analytical reviews.

Forex Technical Analysis & Forecast 07.07.2017 (EUR/USD, GBP/USD, USD/CHF, USD/JPY, AUD/USD, USD/RUB, GOLD, BRENT)

Article By RoboForex.com

EUR USD, “Euro vs US Dollar”

The EUR/USD pair has extended the correction towards 1.1400 and completed it. We think, today the price may break this correctional channel and fall to reach 1.1360. After that, the instrument may start consolidating. If later the pair breaks this consolidation range to the downside, the market may form the third descending wave with the target at 1.1300.


GBP USD, “Great Britain Pound vs US Dollar”

The GBP/USD pair has reached the upside border of the consolidation range. Possibly, today the price may fall towards the downside one, break it, and then continue falling to reach the target of the third wave at 1.2841. Later, in our opinion, the market may be corrected in the fourth wave to reach 1.2934.


USD CHF, “US Dollar vs Swiss Franc”

The USD/CHF pair has broken 0.963 to the downside and extended the correction towards 0.9600. We think, today the price may grow to return to 0.9633. According to the main scenario, the pair is expected to continue forming the third ascending wave to reach 0.9680. An alternative scenario suggests that the market may reach 0.9580.


USD JPY, “US Dollar vs Japanese Yen”

The USD/JPY pair has completed another ascending structure inside the consolidation range and defined its upside border. According to the main scenario, the price is expected to fall towards the downside one at 112.78. After that, the instrument may grow to reach 113.24, rebound from it, and then continue falling inside the downtrend with the target is 110.20.


AUD USD, “Australian Dollar vs US Dollar”

The AUD/USD pair is forming the descending wave towards 0.7563. Later, in our opinion, the market may be corrected to reach 0.7650 and then form the third wave with the target at 0.7500.


USD RUB, “US Dollar vs Russian Ruble”

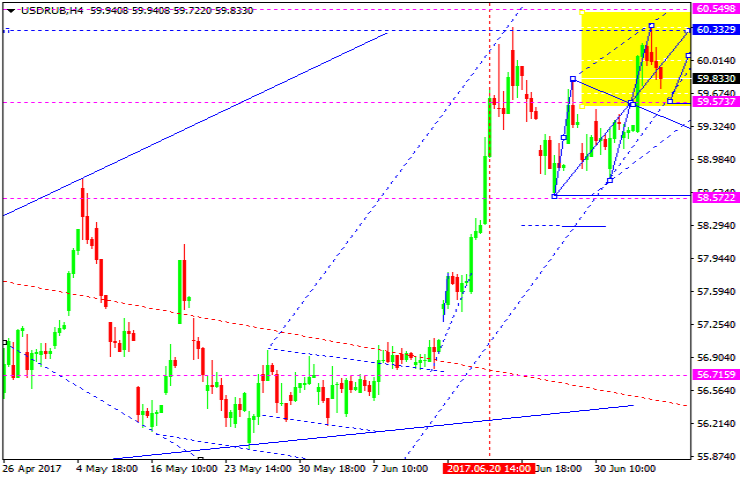
The USD/RUB pair has almost completed the Double Top pattern. According to the main scenario, the price is expected to fall towards 58.57. Possibly, the market may try to reach 60.50 again. After that, the instrument may continue falling inside the downtrend with the target at 55.50.


XAU USD, “Gold vs US Dollar”

Gold is still consolidating near the lows. Possibly, today the price may break 1228.86 to the upside and form the first wave towards 1240.00. After that, the instrument may be corrected to test 1229.00 from above and then start another growth with the target at 1259.15. An alternative scenario suggests that the market may fall to reach 1215.00.


BRENT

Brent has reached the target of the correction at 47.41. Possibly, today the price may break the correctional channel and form the fifth ascending wave with the target at 50.30. Later, in our opinion, the market may start another correction towards 47.40.


RoboForex Analytical Department

Article By RoboForex.com

Attention!
Forecasts presented in this section only reflect the author’s private opinion and should not be considered as guidance for trading. RoboForex LP bears no responsibility for trading results based on trading recommendations described in these analytical reviews.