Author Archive for InvestMacro – Page 517

EURUSD: correction expected after growth to 1.1816

By Gabriel Ojimadu, Alpari

Previous:

On Wednesday the 16th of August, trading on the euro closed in the black. The single currency was under intense pressure leading up to the release of the FOMC minutes. It first fell against the dollar after a report from Reuters that ECB president Mario Draghi wasn’t planning any significant monetary policy statement in the speech he’s set to give at the Jackson Hole symposium. Sellers later came into play after the publication of strong UK data.

When the US regulator published the minutes of its latest meeting, the dollar slipped and the euro rose. The minutes reveal that committee members are worried about weak inflation. Because of this, some members supported leaving rates unchanged for the time being until the situation becomes more clear. The euro/dollar rate ended up rising to 1.1779.

Day’s news (GMT+3):

  • 11:30 Australia: RBA assistant governor Ellis’ speech.
  • 11:30 UK: retail sales (Jul).
  • 12:00 Eurozone: CPI (Jul), CPI core (Jul), trade balance (Jul).
  • 14:30 Eurozone: ECB monetary policy meeting accounts.
  • 15:30 Canada: manufacturing shipments (Jun).
  • 15:30 USA: continuing jobless claims (7 Aug), Philadelphia Fed manufacturing survey (Aug).
  • 16:15 USA: capacity utilisation (Jul).
  • 19:30 USA: FOMC member Kaplan’s speech.

EURUSD rate on the hourly. Source: TradingView

From its low of 1.1681, the euro has shot past the 45th and 67th degrees. Growth stopped around the 90thdegree. After a high of 1.1779, a bearish model has been forming over the last 11 hours. I reckon that the market will hit a new high of 1.1797 and then slip back to 1.1768. The rebound, of course, is not a foregone conclusion. The rate could move without hindrance as far as 1.1816 (112 degrees). In any case, buyers will start profit-taking around the trend line.

The price is currently above the LB balance line. For the rally to continue, buyers need to actively defend 1.1745. Eurozone inflation data and the ECB’s monetary policy meeting accounts will act as the main drivers today.

A New Alternative For Plastic Bags


Avani Eco is a brand that is investing on eco-friendly products, their latest invention, a bioplastic bag.


Trump’s Path to Trade Wars

By Dan Steinbock

As the White House is about to escalate trade frictions along with nuclear risks, global economic prospects will turn more clouded and markets more volatile.

Last Friday, President Trump spoke to Chinese President Xi Jinping and told him that he is preparing to order an investigation into Chinese trade practices.

On Monday, he called for an investigation into China over U.S. intellectual property (IP) practices and technology transfers. As a result, U.S. Trade Representative Robert Lighthizer, a veteran Reagan administration trade hawk, opened an investigation against China under Section 301 of the Trade Act of 1974. The ordering of the investigation will not immediately impose sanctions but it could lead to steep tariffs on Chinese goods.

The White House is escalating economic tensions at a time when strategic risks loom from North Korea in Asia to Charlottesville in Virginia. Now trade pragmatism is dead and the path has been paved to trade wars.

How Washington moved from trade pragmatism toward trade conflicts

After the Trump-Xi Florida Summit in early April, U.S. and China announced a 100-day Action Plan to improve strained trade ties. That was the official status quo, but not the actual reality.

Two weeks later, Trump issued a Presidential Memorandum, which directed Commerce Secretary Wilbur Ross to investigate the effects of steel imports on national security. As Trump began to ramp up the heat, Ross stated he would present the White House a range of options to restrict steel imports on “national security” grounds.

By mid-June, Europe’s NATO leaders launched an extraordinary lobbying campaign against an anticipated US crackdown on steel imports, which, they said, would hit US allies more than China. Some EU leaders were ready for retaliation if Washington would move ahead.

When the Trump administration’s first US-Sino Comprehensive Economic Dialogue (CED) ended in Washington in late July, it could only agree on canceled news conference, and no joint statement.

A simple scenario was a major trade conflict now overshadowed the US-China ties. A more nuanced scenario was that, while the Trump administration was willing to penalize the Sino-US economic dialogue over slow progress in deficit reduction and North Korea’s geopolitics, it also wanted to use the CED as a ‘demonstration effect’ in the impending NAFTA talks and trade reviews.

Now the White House has returned to a trade war scenario.

Tariffs against China, NAFTA and NATO?

Washington’s NATO allies are not the only ones who feel the great unease. In North America, U.S. NAFTA partners have been monitoring the debacle very closely.

If the Trump administration plans to use steel as a national security threat, Canada and Mexico understand quite well that the real focus will soon be more on NAFTA rather than just China or Germany.

Today China produces almost half of the world’s steel, but its US market share in steel is marginal; less than 2%. In America, the largest steel importers include Washington’s NAFTA partners, Canada (almost 17%) and Mexico (nearly 9%). So if Trump really is “hell-bent on imposing” major tariffs on steel, it is America’s NAFTA partners that will be the first to feel the heat.

But as Trump plans to move further to imported aluminum, semiconductors, paper, and household appliances, that’s when China and other major importers will become targets as well. The new debate about intellectual property and technology transfers indicates that this is now the likely path.

Also, Commerce Secretary Ross could submit to Trump his report about steel and its alleged national security implications in the coming weeks or by late fall. If Ross finds that steel imports threaten to impair US national security, Trump should determine within three months whether he concurs with Ross’s findings; and what actions should be taken.

“This is just the beginning…”

On August 14, President Trump directed the U.S. Trade Representative Robert Lighthizer, a Reagan administration trade hawk, to determine whether to open an investigation into China’s intellectual property (IP) practices, including forced IP transfers and theft. The investigation in turn could lead to trade penalties.

The intimate linkage between the investigation and the US intelligence community, which gives new meaning to the term “trade war,” is reflected by the fact that the ceremony was attended by Admiral Dennis Blair, Co-chair of the Commission on the Theft of American Intellectual Property (IP Commission). Blair is the former U.S. Director of National Intelligence and a retired Navy admiral who was the commander of U.S. forces in the Pacific region.

Ahead of Trump’s order, China’s foreign ministry appealed to Trump to avoid a “trade war.” Following the order, the Commerce Ministry complained that it represented “strong unilateralism” that violated the spirit of multinational trade agreements. “The U.S. side should strictly adhere to commitments and should not become the destroyer of multilateral rules.”

“This is just the beginning,” Trump told reporters after he signed an executive memorandum. If that really is the case, the Trump White House is about to broaden the tariff debate from steel to intellectual property and technology, but also escalating broader and deeper risks – first with China, then with its NAFTA and its European NATO allies.

Global economic prospects are about to take a turn to a chill that could get a lot worse by the fall.

About the Author:

Dr Dan Steinbock is the founder of Difference Group and has served as research director at the India, China and America Institute (USA) and visiting fellow at the Shanghai Institutes for International Studies (China) and the EU Center (Singapore). For more, see https://www.differencegroup.net/ 

The original, shorter version was released by Shanghai Daily on August 16, 2017


Gene Editing, The Latest Trend In Medicine


Editing the genes may seem incredible, but the Technology advances in medical terms promise to cure hereditary diseases.


The Labor Law Reform In Brazil


Brazilian labour unions are putting pressure on politicians to ensure fair laws are passed.


NAFTA’s Renegotiations

It’s an election year for Mexico, and the stakes are high due to the renegotiation of NAFTA.

Fibonacci Retracements Analysis 16.08.2017 (GBP/USD, EUR/JPY)

Article By RoboForex.com

GBP USD, “Great Britain Pound vs US Dollar”

As we can see at the H4 chart, the descending correction has reached the retracement of 61.8%. The next targets of this correction may be the retracements of 76.0% at 1.2753. The more “ambitious” target of this decline may be the local low at 1.2590.

At the H1 chart, the situation is pretty the same. The pair is correcting the previous descending impulse. The target of such correction is the retracements of 38.2% and 50.0% at 1.2915 and 1.2936 respectively. After breaking the local low at 1.2845, the price may continue falling inside the downtrend to reach its next targets at 1.2789 and 1.2752.


EUR JPY, “Euro vs. Japanese Yen”

At the H4 chart of the EUR/JPY pair, after being corrected to the downside by 38.2%, the price started forming a new ascending impulse. The closest upside target is the local high at 131.49. If the price breaks it, the pair may continue growing towards the retracements of 138.2% – 161.8% (132.82 – 133.63).

At the H1 chart, the situation is pretty similar. The price is forming the ascending impulse towards the local high at 131.49. However, we can see the divergence, which may indicate a possible reverse at the above-mentioned level.


RoboForex Analytical Department

Article By RoboForex.com

Attention!
Forecasts presented in this section only reflect the author’s private opinion and should not be considered as guidance for trading. RoboForex LP bears no responsibility for trading results based on trading recommendations described in these analytical reviews.

EURUSD: correction to continue to the LB line

By Gabriel Ojimadu, Alpari

Previous:

On Tuesday the 15th of August, trading on the euro/dollar pair closed in the red. In the US session, the euro fell against the dollar to 1.1687. Strong retail sales data coupled with an abating of tensions surrounding North Korea provided support for the greenback. Previous negative retail sales figures were revised upwards to positive values. US 10Y bond yields jumped to 2.284%.

The dollar, however, was unable to hold onto the ground it gained from the news. Market participants started profit-taking, resulting in a ricochet upwards of 56 pips to 1.1743.

US statistics:

  • Retail sales index: +0.6% MoM (forecast: 0.4% MoM, previous reading revised from -0.2% to 0.3%).
  • Retail sales index ex autos: 0.5% MoM (forecast: 0.4% MoM, previous rading revised from -0.1% to 0.3%).

Day’s news (GMT+3):

  • 11:30 UK: average earnings (Jun), ILO unemployment rate (Jun), claimant count rate (Jul).
  • 12:00 Eurozone: GDP (Q2).
  • 15:30 Canada: foreign portfolio investment in Canadian securities (Jun).
  • 15:30 USA: building permits (Jul), housing starts (Jul).
  • 17:30 USA: EIA crude oil stocks change (11 Aug).
  • 21:00 USA: FOMC minutes.

EURUSD rate on the hourly. Source: TradingView

The euro fell from the 90th to the 135th degree on yesterday’s news. From there, the price rebounded by 45 degrees. In Asia, a breakout of the trend line was confirmed. Buyers shifted the maximum to 1.1716. The tail of the daily candlestick and the breakout of the trend line give me grounds for predicting the euro to rise against the dollar today.

The 22nd degree is at 1.1720. I think it’ll move to 1.1716. From 22 degrees, I’m expecting to see the price return to 1.1767. If, when trading in Europe gets underway, the price starts going up, and not down, we’ll have a different situation. In such a case, the target will be higher.

Some important statistics for the Eurozone, UK and US are coming out today. We’re also expecting the publication of the minutes from the FOMC’s latest meeting. The Eurozone’s GDP for the second quarter and the FOMC minutes will be the major drivers for the euro/dollar pair today.

The revised GDP figure for the Eurozone will most likely remain at its previous levels of 0.6% QoQ and 2.1% YoY, so the report could be ignored. We should only see a reaction if different figures comes out. More interesting is the publication of the FOMC’s minutes, which could set the tone for trading on the dollar over the next week.

Japanese Candlesticks Analysis 16.08.2017 (AUD/USD, GBP/USD)

Article By RoboForex.com

AUD USD, “Australian Dollar vs US Dollar”

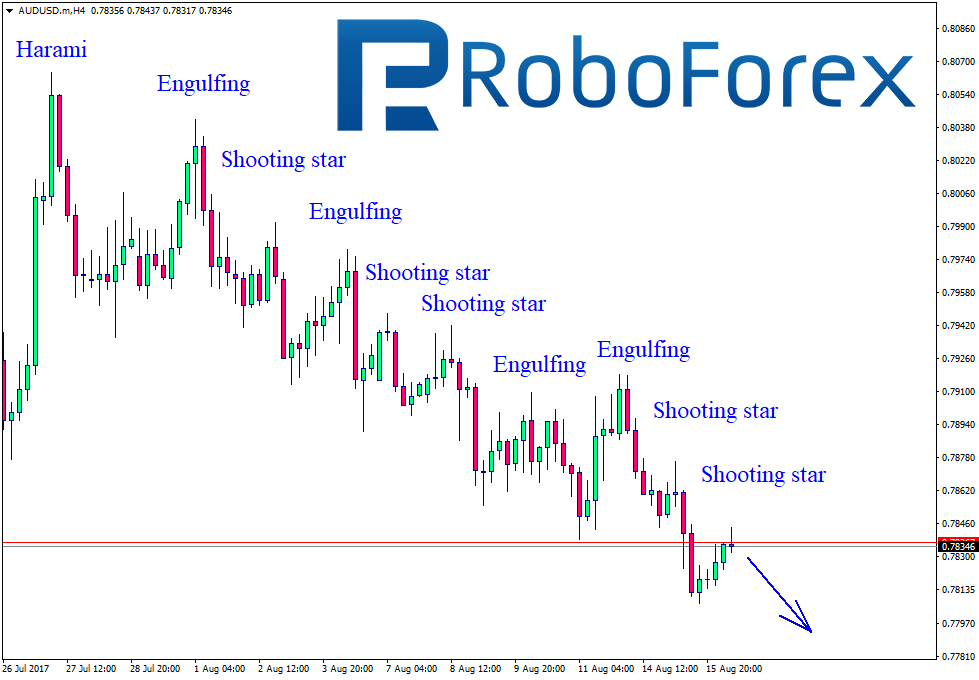
At the H4 chart of AUD USD, we can see slight corrections within the downtrend, at the tops of which the price is forming reversal patterns, such as Engulfing, Shooting Star, Harami, and then Shooting Star again. After the correction, the downside target is at the support level at 0.7796.


GBP USD, “Great Britain Pound vs US Dollar”

At the H4 chart of GBP USD, the price is falling and at the same time constantly forming reversal patterns, such as Engulfing, Hanging Man, and Shooting Star. Right now, the pair is being corrected again. Later, it is expected to continue falling. The downside target is at the support level at 1.2708.


RoboForex Analytical Department

Article By RoboForex.com

Attention!
Forecasts presented in this section only reflect the author’s private opinion and should not be considered as guidance for trading. RoboForex LP bears no responsibility for trading results based on trading recommendations described in these analytical reviews.

U.S. Stock Market: Sunrise … Sunset

See what happens when speculative fever cools down

By Elliott Wave International

The market itself provides its own clues about its future price action. One such clue is found in higher-beta small cap stocks vs. lower-beta blue chips. Get our take.

[Editor’s Note: The text version of the story is below.]


*********

Every bull and bear market has a beginning and an end.

That would seem to be an obvious statement, but during an extended financial trend, a “no end in sight” sentiment usually develops. Many market observers perceive the protracted trend as the norm.

A perfect example is the current uptrend in the stock market: It started in March 2009 and is still going strong, with the Dow Industrials posting a string of record highs.

This Aug. 4 CNBC headline conveys the optimistic extreme:

‘The bull market could continue forever’ — strategist outlines conditions

But, we’ll stick with the idea that every financial trend has a sunrise and a sunset, including this one.

Review this chart and commentary from our Aug. 4 Short Term Update:

Higher Beta Small Caps Weaker than Lower Beta Big Caps

When speculation fades as investors narrow their focus into big-cap stocks to the detriment of small-cap stocks, it provides the early-warning basis to watch the stock market’s big-cap indexes closely, because the rising trend has entered its sunset phase. The chart shows just how dramatic the divergence has become. The Russell 2000/Russell 1000 stock ratio made a countertrend rally high on December 8, 2016 and has trended lower, as the DJIA has trended higher. On Aug. 3, the ratio essentially matched its low of the year, with the DJIA pushing to another new high today.

With what has just been discussed in mind, you might be wondering how other bull markets have ended.

Our August Elliott Wave Financial Forecast provides perspective on the two most recent ones:

Many major stock market peaks are battles of attrition … . In 2007, for example, the Small-Cap indexes, Mid-Cap indexes, the Dow Jones Composite Index and the Value Line Indexes all made highs in June-July 2007 and failed to join the Dow Jones Industrial Average, S&P 500 and NASDAQ at new highs in October 2007. In the wake of that non-confirmation, all stock indexes declined in a major bear market … . On rare occasions, a big bull market will end in conjunction with peak optimism. The NASDAQ’s top in 2000 ended after it closed higher 19 out of 21 weeks during its final push to the March 2000 peak.

At this juncture, we don’t know if the end of the current bull market will more closely resemble that of 2007 or 2000.

But, we do have reason to suspect that 2017 will turn out to be a pivotal year.


3 Videos + 8 Charts = Opportunities You Need to See.

Join this free event hosted by Elliott Wave International and you’ll get a clear picture of what’s next in a variety of U.S. markets. After seeing these videos and charts you will be ready to jump on opportunities and sidestep risks in some major markets. This free report (a $29 value) will present a unique outlook and give you a new perspective on the markets you won’t get anywhere else.

Get your FREE report now — for a limited time

This article was syndicated by Elliott Wave International and was originally published under the headline U.S. Stock Market: Sunrise … Sunset. EWI is the world’s largest market forecasting firm. Its staff of full-time analysts led by Chartered Market Technician Robert Prechter provides 24-hour-a-day market analysis to institutional and private investors around the world.