Author Archive for InvestMacro – Page 516

Silver Speculators raised bullish net positions to highest in 9 weeks

By CountingPips.comReceive our weekly COT Reports by Email

Silver Non-Commercial Speculator Positions:

Large speculators continued to lift their bullish net positions in the Silver futures markets this week, according to the latest Commitment of Traders (COT) data released by the Commodity Futures Trading Commission (CFTC) on Friday.

The non-commercial futures contracts of Silver futures, traded by large speculators and hedge funds, totaled a net position of 38,851 contracts in the data reported through Tuesday August 15th. This was a weekly boost of 4,987 contracts from the previous week which had a total of 33,864 net contracts.

Speculative silver positions are now higher for a fourth straight week and the current standing is the best level since June 20th when net positions totaled +46,681 contracts.

Silver Commercial Positions:

The commercial traders position, categorized by the CFTC as hedgers or traders engaged in buying and selling for business purposes, totaled a net position of -48,088 contracts on the week. This was a weekly loss of -8,527 contracts from the total net of -39,561 contracts reported the previous week.

SLV ETF:

Over the same weekly reporting time-frame, from Tuesday to Tuesday, the SLV ishares ETF, which tracks the price of silver, closed at approximately $15.74 which was an uptick of $0.18 from the previous close of $15.56, according to unofficial market data.

*COT Report: The COT data, released weekly to the public each Friday, is updated through the most recent Tuesday (data is 3 days old) and shows a quick view of how large speculators or non-commercials (for-profit traders) as well as the commercial traders (hedgers & traders for business purposes) were positioned in the futures markets. The CFTC categorizes trader positions according to commercial hedgers (traders who use futures contracts for hedging as part of the business), non-commercials (large traders who speculate to realize trading profits) and nonreportable traders (usually small traders/speculators). Find CFTC criteria here: (http://www.cftc.gov/MarketReports/CommitmentsofTraders/ExplanatoryNotes/index.htm).

Article by CountingPips.comWeekly COT Report


Large S&P500 Speculators increased their net bearish positions this week

By CountingPips.comReceive our weekly COT Reports by Email

S&P500 Non-Commercial Speculator Positions:

Large speculators added to their bearish net positions in the S&P500 futures markets this week, according to the latest Commitment of Traders (COT) data released by the Commodity Futures Trading Commission (CFTC) on Friday.

The non-commercial futures contracts of S&P500 futures, traded by large speculators and hedge funds, totaled a net position of -1,912 contracts in the data reported through Tuesday August 15th. This was a weekly fall of -1,780 contracts from the previous week which had a total of -132 net contracts.

The net position has now been bearish for a third consecutive week and the most bearish in the last nine weeks.

S&P500 Commercial Positions:

The commercial traders position, categorized by the CFTC as hedgers or traders engaged in buying and selling for business purposes, totaled a net position of -17,862 contracts on the week. This was a weekly decrease of -1,825 contracts from the total net of -16,037 contracts reported the previous week.

SPY ETF:

Over the same weekly reporting time-frame, from Tuesday to Tuesday, the SPY ETF, which tracks the price of S&P500 Index, closed at approximately $246.51 which was a fall of $-0.75 from the previous close of $247.26, according to unofficial market data.

*COT Report: The COT data, released weekly to the public each Friday, is updated through the most recent Tuesday (data is 3 days old) and shows a quick view of how large speculators or non-commercials (for-profit traders) as well as the commercial traders (hedgers & traders for business purposes) were positioned in the futures markets. The CFTC categorizes trader positions according to commercial hedgers (traders who use futures contracts for hedging as part of the business), non-commercials (large traders who speculate to realize trading profits) and nonreportable traders (usually small traders/speculators). Find CFTC criteria here: (http://www.cftc.gov/MarketReports/CommitmentsofTraders/ExplanatoryNotes/index.htm).

Article by CountingPips.comWeekly COT Report


Copper Speculators boost bullish net positions for 5th straight week

By CountingPips.comReceive our weekly COT Reports by Email

Copper Non-Commercial Speculator Positions:

Large speculators continued to lift their net positions in favor of the Copper futures markets this week, according to the latest Commitment of Traders (COT) data released by the Commodity Futures Trading Commission (CFTC) on Friday.

The non-commercial futures contracts of Copper futures, traded by large speculators and hedge funds, totaled a net position of 36,829 contracts in the data reported through Tuesday August 15th. This was a weekly lift of 3,693 contracts from the previous week which had a total of 33,136 net contracts.

This week’s increase marked a fifth straight week of net bullish gains and put the current level of bullish net positions at the highest level since February 28th when bets totaled +37,998 contracts.

Copper Commercial Positions:

The commercial traders position, categorized by the CFTC as hedgers or traders engaged in buying and selling for business purposes, totaled a net position of -37,145 contracts on the week. This was a weekly drop of -3,218 contracts from the total net of -33,927 contracts reported the previous week.

JJC ETF:

Over the same weekly reporting time-frame, from Tuesday to Tuesday, the JJC iPath Bloomber Copper ETN, which tracks the price of copper, closed at approximately $32.91 which was a loss of $-0.80 from the previous close of $33.71, according to unofficial market data.

*COT Report: The COT data, released weekly to the public each Friday, is updated through the most recent Tuesday (data is 3 days old) and shows a quick view of how large speculators or non-commercials (for-profit traders) as well as the commercial traders (hedgers & traders for business purposes) were positioned in the futures markets. The CFTC categorizes trader positions according to commercial hedgers (traders who use futures contracts for hedging as part of the business), non-commercials (large traders who speculate to realize trading profits) and nonreportable traders (usually small traders/speculators). Find CFTC criteria here: (http://www.cftc.gov/MarketReports/CommitmentsofTraders/ExplanatoryNotes/index.htm).

Article by CountingPips.comWeekly COT Report


Elon Musk Sends Supercomputer to Space

The Falcon 9 Rocket carried a supercomputer made by HP and Elon Musk, that is destined to defy the radiation in space.

Fibonacci Retracements Analysis 18.08.2017 (GOLD, USD/CHF)

Article By RoboForex.com

XAU USD, “Gold vs US Dollar”

As we can see at the H4 chart, after being corrected to the downside by 50%, Gold is trying to resume the uptrend. After breaking the local high at 1292.14, the pair may move upwards to reach the post-correctional extension area between the retracements of 138.2% and 161.8% at 1301.59 and 1307.58 respectively.

At the H1 chart, the situation is pretty similar.


USD CHF, “US Dollar vs Swiss Franc”

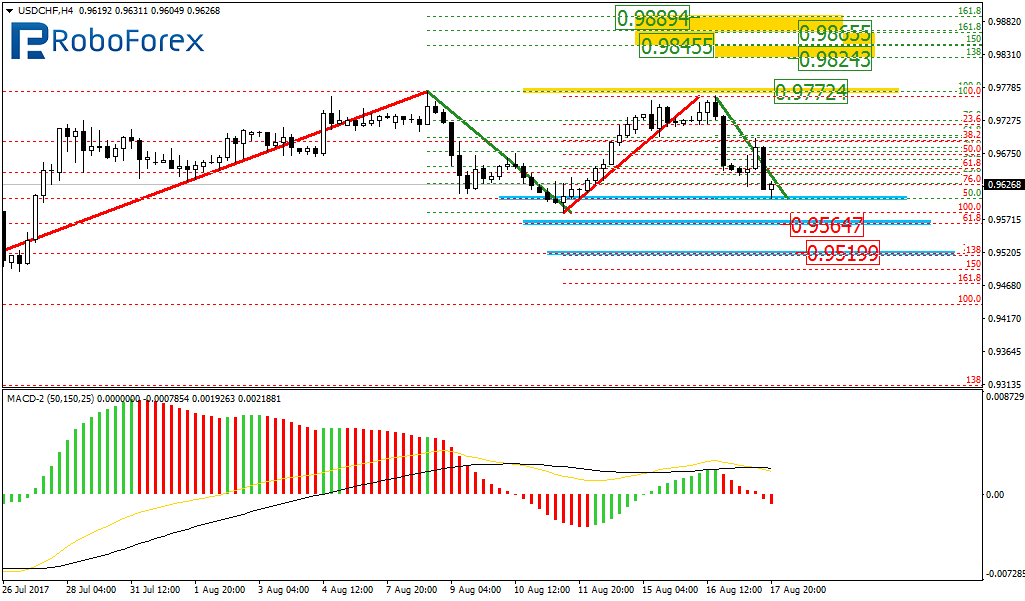
As we can see at the H4 chart, the USD/CHF pair is forming the sideways correction. After being corrected by 50.0%, the price tried to test the highs, but it seems that the market is going to continue the correction. The next targets of this correction may be the retracements of 61.8% and 76.0% at 0.9564 and 0.9519 respectively.

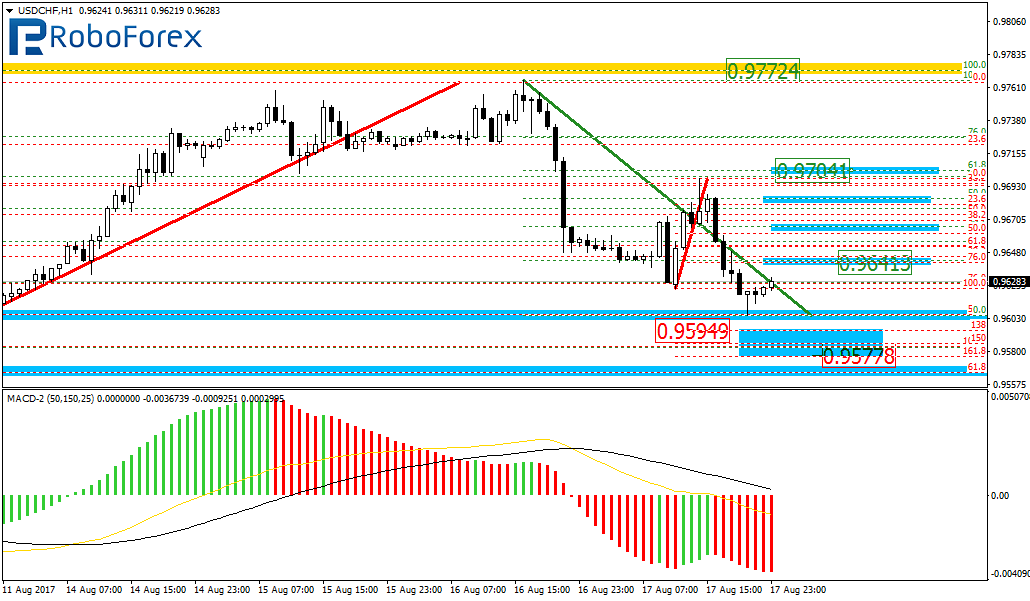
At the H1 chart, the local downtrend stopped and me be transforming into the sideways correction. The closest downside targets may be between 0.9594 and 0.9577.


RoboForex Analytical Department

Article By RoboForex.com

Attention!
Forecasts presented in this section only reflect the author’s private opinion and should not be considered as guidance for trading. RoboForex LP bears no responsibility for trading results based on trading recommendations described in these analytical reviews.

Forex Technical Analysis & Forecast 18.08.2017 (EUR/USD, GBP/USD, USD/CHF, USD/JPY, AUD/USD, USD/RUB, GOLD, BRENT)

Article By RoboForex.com

EUR USD, “Euro vs US Dollar”

The EUR/USD pair has reached the target level and formed the structure of the Expanding Triangle pattern. Possibly, today the price may be corrected to the upside to reach 1.1765 or even extend this structure towards the upside border of the range, which may be considered as a downside continuation pattern. After that, the instrument may fall towards 1.1666, break it downwards, and then continue forming the third wave. The local target is at 1.1550.


GBP USD, “Great Britain Pound vs US Dollar”

The GBP/USD pair is still consolidating at the lows. We think, the price may reach 1.2911 and then fall towards 1.2876. If later the instrument breaks this consolidation channel to the upside, the market may be corrected towards 1.3000; if to the downside – continue falling inside the downtrend with the target at 1.2732.


USD CHF, “US Dollar vs Swiss Franc”

The USD/CHF pair is still consolidating around 0.9676. Possibly, today the price may complete the descending structure and then grow to reach 0.9695. After that, the instrument may fall towards 0.9647 and then continue moving upwards with the target at 0.9740.


USD JPY, “US Dollar vs Japanese Yen”

The USD/JPY pair has formed another consolidation range and broken it downwards. Possibly, the price may continue falling towards 108.83 and then grow to reach 109.61. Later, in our opinion, the market may move downwards with the target at 108.21.


AUD USD, “Australian Dollar vs US Dollar”

The AUD/USD pair is trading to rebound from the upside border of the Expanding Triangle pattern. We think, the price may continue forming the descending wave. The target is at 0.7733.


USD RUB, “US Dollar vs Russian Ruble”

Being under pressure, the USD/RUB pair is moving downwards. Possibly, the price may reach 58.96 and then start another correction with the target at 59.90.


XAU USD, “Gold vs US Dollar”

Gold is consolidating at the top of the ascending impulse. If later the instrument breaks this consolidation range to the downside, the market may be corrected towards 1278.55; if to the upside – grow with the target at 1300.00.


BRENT

Brent has broken the descending channel and completed the correction. We think, the price may continue growing towards 52.55 and then fall to reach 51.25. Later, in our opinion, the market may move upwards to reach the local target at 55.15.


RoboForex Analytical Department

Article By RoboForex.com

Attention!
Forecasts presented in this section only reflect the author’s private opinion and should not be considered as guidance for trading. RoboForex LP bears no responsibility for trading results based on trading recommendations described in these analytical reviews.

EURUSD: recovery to 1.1771

By Gabriel Ojimadu, Alpari

On Thursday the 17th of August, trading on the euro/dollar closed down. The daily candlestick closed with a range of 127 pips. The euro survived the ECB’s monetary policy meeting accounts. The price first jumped from 1.1663 to 1.1714. During the US session, the bulls managed to get it back up to 1.1754.

The euro strengthened as the dollar fell across the market in response to Dallas Fed president Robert Kaplan’s speech, in which he said that a weaker dollar is good for the economy. Due to low bond yields, one should be wary of future rate hikes. After hitting 1.1754, the pair entered a phase of consolidation.

Day’s news (GMT+3):

  • 09:00 Germany: PPI (Jul).
  • 11:00 Eurozone: current account (Jun).
  • 15:30 Canada: CPI (Jul), CPI core (Jun).
  • 17:00 USA: Michigan consumer sentiment index (Aug).
  • 17:15 USA: FOMC member Kaplan’s speech.

EURUSD rate on the hourly. Source: TradingView

After a long-legged doji formed on the hourly timeframe, the euro restored to 1.1754. Growth was halted at the 67th degree. Yesterday, after the price ricocheted and trading volume increased, I set a range of 1.1681 – 1.1713 for accumulating long positions. Buyers wasted no time here and the price soon started to rise. Despite this rise, though, these price levels are still relevant for those wishing to purchase euros today.

A complex price model has taken form over the past few days. Predicting the course of the euro has become more difficult. Today, I’m expecting the euro to rise to 1.1771. 1.1713 level will act as a support. The price could fall as far as the 45th degree at 1.17. It would be better if it stayed above 1.1720/25.

The breakout of the trend line on the daily timeframe turned out to be false; the price jumped after the minutes of the ECB’s meeting were published. Now the line needs to undergo a correction towards the low of 1.1663. The Stochastic is in the sell zone, so if the price goes down, we should see an increase in trading volume as buyers try to push back towards 1.1771.

This is Why Cocoa’s Crash Was a Perfect Setup

Perfect from an Elliott wave perspective, that is

By Elliott Wave International

The other day, I went paddle-boarding for the first time and was struck by a familiar feeling; one that comes from, of all things, speculating in the markets.

See, when your board is in line with the current and the wind is at your back, the board moves effortlessly, gliding along the top of the water with no strain at all. This is the equivalent of trading with a market’s trend.

On the other hand, when your board goes against the current and the wind comes at you from the front, any attempt to move forward feels like wading through wet cement. This is what it’s like to enter a market during a countertrend move.

It goes without saying, we’re all aiming for the first scenario. The question is, how do you know which move prices are about to make?

In 2013, our chief commodity analyst Jeffrey Kennedy co-authored an invaluable resource titled “Visual Guide to Elliott Wave Trading” in which he explained how combining Elliott analysis with technical methods enables traders to identify price action moving with, and against the larger trend. In the book, Jeffrey writes:

“Odds favor traders who are long in bull markets (and short in bear markets) versus short sellers in bull markets (and buyers in bear markets). Overall trading in the direction of the trend is the path of least resistance.

“The four best waves to trade are therefore: Wave 3, 5, A, and C because they are oriented in the direction of the one larger trend.”

“Remember, five-wave moves determine the direction of the larger trend, while three wave moves offer traders an opportunity to join the trend. So in Figure 1.7, waves (2), (4), (5), and (B) are actually set-ups for high-confidence trades exploiting waves (3), (5), (A), and (C).”

Now, let’s take Jeffrey’s lesson and apply it to the real-world price action of a popular commodity market, cocoa. Back in September of 2016, cocoa prices were sailing toward their highest level in five years. And yet, that’s precisely when Jeffrey began to prep the market’s downside.

In his September 2016 Monthly Commodity Junctures’ “Featured Market” video update, Jeffrey showed cocoa prices ideally positioned for a powerful wave c of (c) decline and wrote:

“As we move into 2017, if everything goes according to plan and cocoa continues to adhere to its Elliott wave scripts, I really think this area here, roughly centered around 1634 through 1597 is an ideal area for this wave C to actually fall to.

Essentially, it’s a very bearish forecast. The potential for a sizable sell-off is indeed very real and we know what to look for to signal that the decline has begun.”

As for what happened next, the following chart answers: Cocoa prices turned down in September 2016, crashing onto the shores of a 10-year low in April 2017.

Since then, cocoa prices have been treading water in a sideways crawl. In the August 4 Daily Commodity Junctures’ Weekly Wrap-up, Jeffrey explained what prices must do to re-ignite the downside, in a “final thrust” to his long-standing target.

Suffice it to say, cocoa’s ship is still at sea, as the winds of the trend carry it to its next destination.


Free 15-Minute Video:
Introduction to the Wave Principle Applied

In this free 15-minute video excerpted from one of Elliott Wave International’s most popular online courses, Senior Analyst Jeffrey Kennedy explains how you can take the Wave Principle and turn it into a trading methodology.

Get free, instant access

This article was syndicated by Elliott Wave International and was originally published under the headline This is Why Cocoa’s Crash Was a Perfect Setup. EWI is the world’s largest market forecasting firm. Its staff of full-time analysts led by Chartered Market Technician Robert Prechter provides 24-hour-a-day market analysis to institutional and private investors around the world.

Ichimoku Cloud Analysis 17.08.2017 (AUD/USD, NZD/USD, USD/CAD)

Article By RoboForex.com

AUD USD, “Australian Dollar vs US Dollar”

The AUD/USD pair is trading at 0.7940; the instrument has broken the downside border of Ichimoku Cloud and right now is moving inside it, which means that it is trading sideways. We should expect the price to test the upside border of the cloud at 0.7945 and then continue moving downwards below 0.7880. However, this scenario may be cancelled if the price breaks the upside border of the cloud and fixes above 0.7960. In this case, the pair may continue growing towards 0.8020.


NZD/USD, “New Zealand Dollar vs US Dollar”

The NZD/USD pair is trading at 0.7315; the instrument is still moving below Ichimoku Cloud, which means that it may continue falling. We should expect the price to rebound from the downside border of the cloud and then continue moving downwards to reach 0.7200. However, the scenario that implies further decline may be cancelled if the price breaks the upside border of the cloud and fixes above 0.7365. In this case, the pair may continue growing towards 0.7450.


USD/CAD, “US Dollar vs Canadian Dollar”

The USD/CAD pair is trading at 1.2605; the instrument has broken the upside border of Ichimoku Cloud and right now is moving inside it. We should expect the price to test the downside border of the cloud and then continue moving upwards to reach 1.2690. However, this scenario may be cancelled if the price breaks the downside border of the cloud and fixes below 1.2580. In this case, the pair may continue falling towards 1.2470.


RoboForex Analytical Department

Article By RoboForex.com

Attention!
Forecasts presented in this section only reflect the author’s private opinion and should not be considered as guidance for trading. RoboForex LP bears no responsibility for trading results based on trading recommendations described in these analytical reviews.

Forex Technical Analysis & Forecast 17.08.2017 (EUR/USD, GBP/USD, USD/CHF, USD/JPY, AUD/USD, USD/RUB, GOLD, BRENT)

Article By RoboForex.com

EUR USD, “Euro vs US Dollar”

The EUR/USD pair has completed the ascending correctional structure of the previous five-wave descending structure. Possibly, today the price may consolidate at the lows and reach 1.1791. After that, the instrument may form fall towards 1.1731, break it downwards, and then continue falling with the target at 1.1666.


GBP USD, “Great Britain Pound vs US Dollar”

The GBP/USD pair is consolidating at the lows. If later the instrument breaks this consolidation channel to the upside, the market may be corrected towards 1.3000; if to the downside – continue falling with the target at 1.2732.


USD CHF, “US Dollar vs Swiss Franc”

The USD/CHF pair has completed the descending correctional structure of the previous ascending wave and right now is consolidating at the lows. We think, the price may grow to reach 0.9728. After that, the instrument may break this level and continue moving upwards with the target at 0.9800.


USD JPY, “US Dollar vs Japanese Yen”

The USD/JPY pair has reached the broken descending channel. Possibly, the price may reach 109.40 and then grow towards 110.37, thus forming another consolidation range. If later the instrument breaks this range to the upside, the market may continue the correction towards 112.18; if to the downside – fall with the target at 107.00.


AUD USD, “Australian Dollar vs US Dollar”

The AUD/USD pair is consolidating; it has already reached the upside border of the Expanding Triangle pattern. Possibly, the price may rebound from it and continue falling to reach 0.7755.


USD RUB, “US Dollar vs Russian Ruble”

The USD/RUB pair has broken the consolidation range to the downside. Possibly, today the price may fall to reach 58.96 and then move upwards to test 60.00 from below.


XAU USD, “Gold vs US Dollar”

Being under pressure, Gold is still moving upwards. We think, the price may reach 1290.40. After that, the instrument may fall towards 1278.60 and then form another ascending structure with the target at 1300.00. However, if the market breaks the lows, the downtrend may continue up to 1255.00.


BRENT

Brent is consolidating at the lows. If later the instrument breaks this consolidation channel to the upside, the market may continue growing towards 52.50; if to the downside – start another correction with the target at 48.92.


RoboForex Analytical Department

Article By RoboForex.com

Attention!
Forecasts presented in this section only reflect the author’s private opinion and should not be considered as guidance for trading. RoboForex LP bears no responsibility for trading results based on trading recommendations described in these analytical reviews.