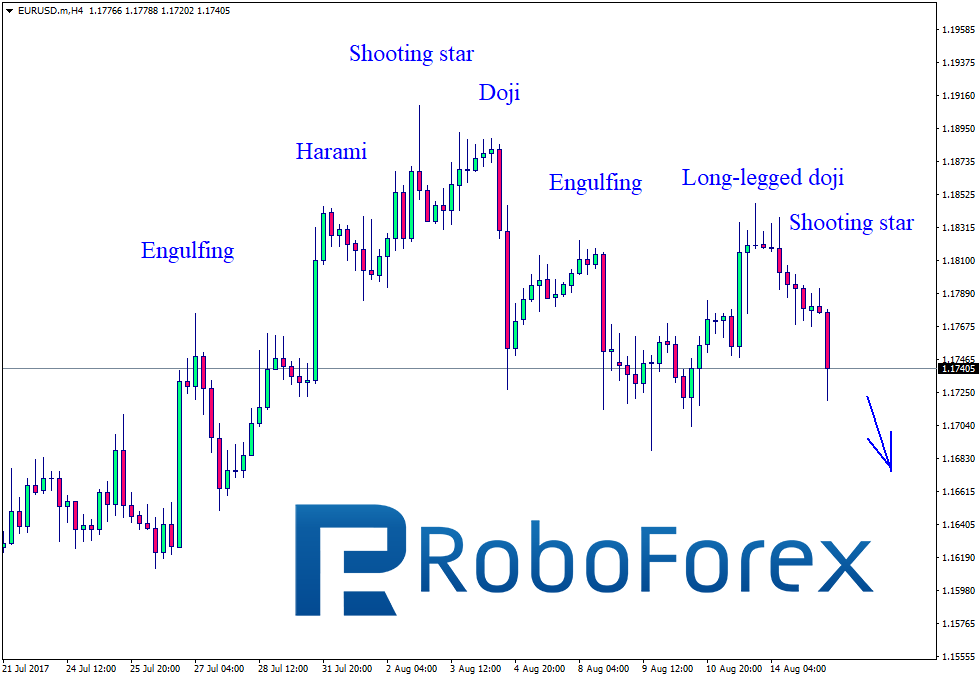
At the H4 chart of EUR USD, the price is moving sideways, but Shooting Star, Doji, Engulfing, and Long-Legged Doji patterns indicate that the uptrend may reverse to the downside and the pair may start falling. After breaking the support level, the price may continue falling to reach the downside target at 1.1625.
NZD/USD, “New Zealand Dollar vs US Dollar”
At the H4 chart of NZD USD, we can see Engulfing patterns, which are regularly formed at the tops of correction. The patterns indicate that the downtrend continues. After finishing another correction, the price completed Engulfing and Long-Legged Doji patterns to show that the pair may break the support level and fall towards 0.7222.
Attention! Forecasts presented in this section only reflect the author’s private opinion and should not be considered as guidance for trading. RoboForex LP bears no responsibility for trading results based on trading recommendations described in these analytical reviews.
The EUR/USD pair is still consolidating below 1.1795. We think, today the price may fall to reach 1.1750 and then grow to return to 1.1795. After that, the instrument may resume moving downwards with the target at 1.1666.
GBP USD, “Great Britain Pound vs US Dollar”
The GBP/USD pair is still consolidating below 1.3030. Possibly, the price may fall to reach 1.2911 and then grow towards 1.3030. Later, in our opinion, the market may move downwards with the target at 1.2850.
USD CHF, “US Dollar vs Swiss Franc”
Being under pressure, the USD/CHF pair is growing towards 0.9800. Possibly, today the price may reach 0.9748. After that, the instrument may fall with the target at 0.9727 and then move upwards to reach 0.9780.
USD JPY, “US Dollar vs Japanese Yen”
The USD/JPY pair has reached the target of the first ascending structure. We think, today the price may fall towards 109.48. Later, in our opinion, the market may form another ascending wave with the target at 111.44. The main target of the correction is at 112.18.
AUD USD, “Australian Dollar vs US Dollar”
Being under pressure, the AUD/USD pair is falling. Possibly, today the price may reach 0.7838. After that, the instrument may form a narrow consolidation range and break it to the downside. The target is at 0.7755. Later, in our opinion, the market may grow towards 0.7899.
USD RUB, “US Dollar vs Russian Ruble”
The USD/RUB pair has reached the target of the descending structure. We think, today the price may grow to reach 60.15 and then fall towards 58.83. If later the instrument breaks this consolidation channel to the upside, the market may continue growing towards 61.31; if to the downside – fall with the target at 58.68.
XAU USD, “Gold vs US Dollar”
Gold has broken its consolidation channel downwards; the market is expected to be corrected to the downside and reach the target at 1258.75. Possibly, today the price may fall towards 1269.16 and then grow to reach 1280.24. After that, the instrument may fall towards the above-mentioned target of the correction.
BRENT
Brent has reached the target of the correction. We think, today the price may form another consolidation range and grow towards 52.25. Later, in our opinion, the market may break this level to the upside and continue growing inside the uptrend with the local target at 55.15.
Attention! Forecasts presented in this section only reflect the author’s private opinion and should not be considered as guidance for trading. RoboForex LP bears no responsibility for trading results based on trading recommendations described in these analytical reviews.
Trading on the euro/dollar pair closed down on Monday. Sellers almost completely annulled Friday’s gains. The euro fell against the dollar to 1.1770, after which a phase of consolidation began. A growth in US bond yields provided support for the dollar, which was helped by a de-escalation in rhetoric from the US towards North Korea as well as demand for more risky assets. US 10Y bond yield rose to 2.228%.
Day’s news (GMT+3):
09:00 Germany: GDP (Q2).
10:15 Switzerland: producer and import prices (Jul).
11:30 UK: retail price index (Jul), CPI (Jul), CPI core (Jul), PPI – input (Jul), PPI – output (Jul), DGLC house price index (Jul).
15:30 USA: retail sales (Jul), retail sales control group (Jul), NY Empire State manufacturing index (Aug), import price index (Jul).
17:00 USA: business inventories (Jun), NAHB housing market index (Aug).
23:00 USA: total net TIC flows (Jun).
EURUSD rate on the hourly. Source: TradingView
My expectations for the euro on Monday came off in full. Sellers broke through the trend line, pushing buyers back to 1.1770. The 45th degree didn’t hold up. Growth on the euro/yen cross wasn’t enough for buyers to defend 1.1793.
During trading in Asia, the euro fell to 1.1754. In my forecast today, I’m expecting a drop to 1.1737 followed by a rebound and subsequent growth to 1.1790. The euro is falling because of a sharp rise in US bond yields by 2.55% to 2.25%. As a guide, I’ve chosen the low from the 11th of August of 1.1749. If the rate drops to 1.1737, it will have completely covered Friday’s range.
Still, if the price reaches this level, don’t be in a hurry to buy euros. We need to wait and see how buyers will behave themselves around here, what sort of volume there will be and where the hourly indicators are at this time. It’s difficult to reflect the dynamics of these indicators in a static review, no less explain how they will change with time.
The target for the 112th degree is a t 1.1711. The yen is dropping against the dollar most of all. The situation with North Korea has sort of diffused. Still, I’m surprised to see so many sell their safe haven assets given that Kin Jong Un put his military on standby this morning for an attack on Guam.
US Secretary of Defense James Mattis has said that a strike by North Korea on US soil “could escalate into war very quickly”. So what’s going to happen?
As I’ve said above, don’t start buying the euro as soon as it hits 1.1737. We should see increased volume as we approach 1.1737 followed by a rebound and a flat for around 15 minutes. If none of this happens, expect a further drop to 1.1711/20.
The ASEAN faces old and new challenges, and a huge long-term opportunity. The next three decades could witness the shift of global economic momentum from the Trans-Atlantic axis to the Trans-Asian axis.
Recently, the Association of Southeast Asian Nations (ASEAN) marked its 50th anniversary in Manila with President Duterte hosting the celebrations. Despite its importance, the Summit’s international coverage remains unacceptably marginal. But times are changing.
Today, ASEAN’s combined population amounts to 640 million, which makes it the world’s third-largest market. The combined ASEAN economies total $2.6 trillion. The grouping is a major regional power.
What matters even more is how important ASEAN and Asia could become globally in the next three decades.
Need for unity and leadership
“The biggest challenge for the ASEAN moving forward will be for it to stay united,” said Singapore’s Ambassador-at-Large Tommy Koh in a recent interview. I first met him a few years ago in Singapore, while serving in the EU-Center. Then, too, he expressed similar concerns – for a reason.
As major powers compete more intensely with one another for influence in Southeast Asia, ASEAN will come under competing pressures. Until recently, Washington still saw the grouping as an extension of its postwar hubs-and-spoke security system, while Brussels perceived the ASEAN as its weak replica, a sort of EU lite.
In the EU, integration was often seen as a norm for other groupings; in the US, regime changes have often been justified in the name of US view of “freedom.” North Korea is a textbook case (and one that could, under some circumstances, result in tragic devastation). In the recent Summit, Washington sought to pressure ASEAN to downgrade diplomatic exchanges with North Korea. But it is neither the ASEAN way nor its experience to isolate another country and condemn them. They know that imposing sanctions simply will not work.
In the case of Myanmar, Washington and Brussels isolated Myanmar and imposed sanctions; the ASEAN countries didn’t. As Koh put it, “We brought them into the family, we tried to influence them in a very gentle Asian way, and the Myanmar leadership, the military leadership, decided on their own volition – not because of external pressure – to develop their own roadmap to democracy.””
Instead of isolation, condemnation and imposed sanctions that won’t work, violations of international consensus should result in elevated cooperation, integration and positive rewards, which do work. That’s the ASEAN way, which offers great lessons not just in Southeast Asia.
In the past, Koh would patiently explain to the EU officials the ASEAN way, and its basic principles; cooperation, amity, and non-interference. To Brussels, that meant integration without integration. To ASEAN, integration is not conceivable without sovereignty. That’s the lesson of colonial subjection.
From Washington’s shadows to economic development
When the ASEAN was created in 1967, Southeast Asia was still overshadowed by America’s might – and miscalculations.
Washington hoped to use ASEAN as a front against communism in Vietnam and insurgencies within the region, including Philippine efforts to defuse the former Hubalahap militants through amnesty, Suharto’s anti-communist “New Order” in Indonesia, the Malaya fights against communists and so on.
Yet, it was not just the perceived external enemy that led to the creation of ASEAN. It was fueled by the thirst of economic development.
After centuries of colonialism and the decision by Washington and Moscow to export Cold War and its conventional wars to Asia, living standards had fallen far behind the Western averages in Southeast Asia. Even in Singapore, the wealthiest ASEAN economy, per capita incomes were barely 15% of those in the US; in the rest of Southeast Asia and China just 1-5% of the US level.
Assuming continued peace and stability, US per capita incomes could rise to $70,200 by 2022. But in Southeast Asia, the catch-up will be even faster. In Singapore, per capita income, based on purchasing power parity, will exceed the US level by a whopping 50%. In Indonesia and the Philippines, the corresponding figures could be 24% and 17%, respectively; in China, about a third of the US level.
In the West, secular stagnation will ensure subdued growth rates; in Southeast Asia, continued catch-up is likely to keep them relatively high, due to solid output potential. By 2022, at the end of the Duterte era, the Philippines will be the second-largest ASEAN economy, right after Indonesia.
The collective economic power of the ASEAN is likely to climb to $4.1 trillion in the next half a decade, right after the US, China, and Japan. A decade later, the economic size of China will surpass the US, while India and the ASEAN have potential to leave behind Germany and – over time – Japan.
However, the catch-up requires peace in the region, sound macroeconomic fundamentals and rule of law (read: elevated struggle against corruption), and inclusive pro-growth policies – as well as accelerated regional integration
The trans-regional giants of the future
Let’s try to see even further. By 2050, Indonesia’s population could climb to 327 million, and the Philippines would be the world’s 10th most populous nation with some 155 million inhabitants. In the ASEAN, 820 million people would represent the world’s third-largest grouping.
Indonesia would be the world’s fourth largest economy, followed by the Philippines (23rd), Vietnam (24th), Malaysia (28th), and Thailand (29th). With their combined economies, these ASEAN-5 economies alone would put the region ahead of Japan, Brazil, Germany, Mexico and UK.
Unlike the EU’s deep integration or shallow approach of the North American Free Trade Agreement (NAFTA), the ASEAN represents a balancing act between national sovereignty and economic size.
In the past, it was the transatlantic axis – that is, economic cooperation between the US and the four core EU economies of the UK, Germany, France and Italy – that drove global economic prospects. By 2050, it will be the trans-Asian axis; that is, economic cooperation between China, India, and the ASEAN-5 that will fuel global economy, politics and security (see Figure).
By then, the transatlantic economy of the US and the EU-4 could amount to $70 trillion, but the trans-Asian economy of China, India and ASEAN-5 would represent $95 trillion, which could grow by another $10 trillion with East Asia – Japan and South Korea.
But none of these achievements will happen automatically. They require unity. In order to deliver the future, the ASEAN must not only cope with pressing short-term and medium-term challenges, it must also remain focused on the long-term perspective.
About the Author:
Dr Dan Steinbock is the founder of Difference Group and has served as research director at the India, China and America Institute (USA) and visiting fellow at the Shanghai Institutes for International Studies (China) and the EU Center (Singapore). For more, see http://www.differencegroup.net/
This commentary originally released by The Manila Times on August 14, 2017
As the Islamic State is collapsing in the Middle East, it needs wins elsewhere. Southeast Asia is Jihadi terror’s new battlefront. In order to contain the terror and sustain the Asian Century, new kind of cooperation is needed between the ASEAN, the US, China, and other major powers in the region and the Middle East.
A systematic terror escalation has begun in Asia. In May, an armed conflict started in Marawi in Mindanao, where government forces were surprised by the Islamic State of Iraq and Levant (ISIL), and homegrown Maute and Abu Sayyaf Salafi jihadists.
After a foiled plot by an ISIL-linked group last year to launch a rocket at Marina Bay Sands in Singapore, several radicalized Indonesian workers have been sent back home and Bangladeshis arrested, along with a few Singaporeans.
In late July, four terror suspects were arrested in Sydney, Australia, for planning to blow up an Etihad plane and a toxic chemical gas attack in a public place. Indonesia and Australia have hosted a counter-terrorism meeting with Malaysia, Philippines and New Zealand. Security has been tightened in Kuala Lumpur ahead of the upcoming 2017 Southeast Asia Games and ASEAN Para Games.
In early August, the Institute for Policy Analysis of Conflict (IPC) said that a small but alarming number of Indonesian maids working in Asia are becoming radicalized for the Islamic State (IS). While there are 150,000 Indonesians living in Hong Kong, the PIC uncovered a cell of 43 radicalized maids living in Hong Kong, three in Taiwan and four in Singapore. Due to elevated concerns for terrorism, some 14,000 travellers from Asia Pacific were barred from Hong Kong in 2016.
As evidenced by the Manila Summit, the Association of the Southeast Asian Nations (ASEAN) is uniting against the threat of homegrown terrorism. A decade and a half after US invasion of Iraq, half a decade after the West’s military interventions in the Middle East, Jihadi terror is pivoting to Asia – thanks to years of complacency in the region, US pivot to Asia, and the ISIL collapse in the Middle East.
ISIL pivot to Asia
In June 2012, just months after the Obama administration’s pivot to Asia, the Khilafah, a major jihadist website, warned that since “the US will shift 60% of its warships to the Asia Pacific, over the coming years until 2020,” it was time to bring Islamic power in the region. Historical and geographic forces fuel the upsurge. In March 2016, Wikileaks released US diplomatic cables dating back to 1979, which highlight the efforts by the CIA and Saudi Arabia to plough billions of dollars into arming the Afghanistan fighters against the Soviet Union, which according to Julian Assange paved the way to al-Qaeda and eventually the ISIL.
Ironically, that view is supported by US counter-intelligence. Historically, Jihadism originates from a few historical destinations. In each case, US interventions have caused destabilization, which has supported the spread of terror.
In Afghanistan, CIA relied on “Operation Cyclone” to arm and fund the mujahideen around 1979-89. Until 2001, it remained a key destination, where volunteers went to join al Qaeda or the Taliban. After US overthrow of the Taliban government, Pakistan became the preferred destination. In 2006, US-backed Ethiopian troops invaded Somalia, which led to a three-year war attracting a new wave of Jihadists to the region. In the Syrian Civil War 2011-17, US, in cooperation with its NATO allies, played a direct role until recently, while collaborating with “moderate jihadists.” In the Yemeni Civil War (2015-), US has provided intelligence and logistical support to Saudi Arabia, which has attracted Al Qaeda and ISIL in the region (Figure 1).
Figure 1 Intended Destinations of Would-Be Jihadists Over Time
Source: RAND, 2014
Yet, these pre-ISIL footholds of terror were largely regional. Wars in Iraq and Syria changed the status quo. These battlefields are causing major international spillovers, especially when the fighters would return home (Figure 2).
Figure 2 Internationalization of ISIL Relationships Since 2004
Source: START, 2014
Today Mindanao, tomorrow Asia
In March 2016, then-President Aquino stated that the Islamic State had no presence in the Philippines. In fact, the ISIL had had a foothold, training and loyalists in the country at least since late 2015, and Jihadi sympathizers since the early 2000s.
In the Muslim Mindanao (ARMM), the Moros – the Philippine Muslims – have witnessed colonial violence by Spain, America and Japan; several communist insurgencies; armed Moro separatist movements, and now terrorist attacks. Though resource-rich, the region is impoverished. In metro Manila, real per capita income is 17 times higher than in the ARMM, where it is at par with Afghanistan. For years, Jihadists have hoped to exploit the resentment of young Muslims in the ARMM to create a new Syria in the heart of Southeast Asia. With foreign fighters, the effort has entered a new stage.
According to the Soufan Group, 27,000-31,000 people have traveled to Syria and Iraq to join the ISIL or other violent extremist groups from at least 86 countries. As Western efforts to contain the flow of foreign recruits to extremist groups in Syria and Iraq have dramatically failed, the average rate of returnees is at 20%-30%, which presents an urgent challenge to security and law enforcement agencies. Hardened attitudes against immigration and minorities have made the status quo still worse.
By the year-end of 2015, almost 60% the foreign fighters in Syria and Iraq came from the Middle East and North Africa, while nearly 20% originated from Western Europe or Russia and Central Asia. The rest came from Southeast Asia, Balkans, North America and Oceania. Indonesia accounted for four of every five from Southeast Asia, while the rest can be attributed mainly to Malaysia and Philippines (Figure 3).
Figure 3 Foreign Fighters in Syria and Iraq by Region (Year-end 2015)
Source: Data from the Soufan Group, 2016
In Indonesia, there are reportedly ISIL cells in most villages. In Malaysia and Singapore, the resentful cluster in discontented quarters. In the ARMM, jihadists comprise a tiny group of extremists that oppose the peace process – for now.
According to data by West Point’s Combating Terrorism Center (CTC), most foreign fighters have limited familiarity with Islam, although in recruitment, peer groups and religious mentors play a key role. Most have less than 12 years of schooling. One third is unemployed, another third employed but stuck in low-skill jobs. Three of four foreign fighters are 18-29 years old and recent arrivals in host countries. Almost all have no military experience prior to recruitment. And while very high percentages die in operations, only one in ten have died from suicide operations.
The rise of foreign fighters in Syria and Iraq can be attributed in part to the military interventions of the US and NATO in the Middle East; in part to the gross failure of the West to integrate Muslim immigrants with education, jobs and mobility.
Development or terror
Currently, the outlook for Asia remains robust and recent data point to a pickup in momentum. The region may reap the benefits of peace and economic development in the coming decades – but only if the threat of terrorism can be neutralized.
Here’s what the region needs:
1. Restoration of peace and stability in the terror clusters. The Duterte administration’s effort to pacify terror in ARMM is absolutely vital, including the extension of the martial law. The threat must be neutralized now when it is still marginal, soft and fragmented; and most locals supports government efforts to restore peace and stability. Pacification and stabilization is not possible without cooperation with neighboring countries that share similar threats, particularly Indonesia, Malaysia and Singapore.
2. Acceleration of economic development across Southeast Asia. In the medium-term, it is equally vital to escalate all efforts at economic development, through the stabilization of current key cities and regions, by prioritizing Economic Corridors in Mindanao, West Borneo, including Sabah and Kalimantan, as well as Greater Sulu Sulawesi, and Papua-Maluku Island.
3. Medium-term regional economic and strategic integration. Accelerated ASEAN integration can foster peace, stability and development in key economic corridors, but also in the context of the China-led One Belt One Road Initiative, which is intensifying economic development from East, South and Southeast Asia to Central Asia and the Middle East.
4. Long-term cooperation with major Asian and Pacific powers. This is vital in economic development (foreign investment, trade and investment, and aid), ASEAn economic integration, and defense. It requires collaboration with China and the US, but also with Russia, Japan and Australia, as well as Saudi Arabia, Iran and Egypt – the regional powers in the Middle East.
In Asia and elsewhere, terrorism preys on social exclusion, economic impoverishment and hopelessness. It cannot be averted without inclusion, development and hope.
About the Author:
Dr Dan Steinbock is the founder of Difference Group and has served as research director at the India, China and America Institute (USA) and visiting fellow at the Shanghai Institutes for International Studies (China) and the EU Center (Singapore). For more, see http://www.differencegroup.net/
The original version was released by China-US Focus on August 12, 2017
Trading opportunities on the currency pair: On Friday, the 11th of August, trading on the GBPJPY pair closed around the TR3 trend line. In this idea, I’ll be looking at the possibility of an upwards rebound and a breakout of the resistance zone of 147.50 – 148.50 in a triangular formation.
Friday’s candlestick closed with a hammer. If the price grows to 142.62, and better yet, if the day closes above this level, it will be a precursor to a further rise in quotes. After that, traders should use the subsequent downwards correction to find an entry point for a long position with a target of 147.81 by the 20th of September. If we break 147.81, we can set a target of 161.60.
Background
The last idea on this currency pair was published on the 6th of February. At the time of publication, the British pound was trading at 140.46 JPY. Buyers didn’t manage to break the TR2 trend line. The price was expected to form a triangle and to exit it downwards in March towards 132.27 level, from which the price was expected to restore to 144.53/60.
In March, the price exited the triangle downwards. It dropped to 135.60, from where the pound appreciated against the yen by 1250 pips to 148.11 in the space of 4 weeks.
Current situation
For several weeks, the pound has been consolidating around 145. Pressure on it has increased in the last week due to a rise in tensions between the US and North Korea. Both countries seem ready to attack one another. The UK, China and EU are all calling on the US to bring about a diplomatic solution to the crisis.
On Friday, the 11th of August, trading closed around the TR3 trend line. In this idea, I’m looking at an upwards rebound from here and a subsequent breakout of the resistance zone at 147.50 – 148.50. I’m rather counting on a triangular formation here.
I don’t think it’s a good idea to sell yen on Monday, not until the North Korea situation is resolved. Below is the weekly chart, so first we should wait for some buy signals on the pound on the daily and 4-hour charts.
Our recent analysis suggests we may be setting up to repeat history in an odd and dangerous manner. As market technicians, part of our job is to work with numbers, find patterns and attempt to predict future price moves in US and Global markets. As you can imagine, it is not always easy to accurately predict the future. Still, we take on the challenge and truly enjoy being able to find and share trading strategy concepts with our ActiveTradingPartners newsletter. As such, we are sharing this recent technical research data with your today.
Recently, the ActiveTradingPartners research team identified a unique pattern in the VIX that allowed us to accurately predict the June 29 VIX Spike nearly 3 weeks in advance. Also, on July 30th, we predicted a big decline in the NASDAQ during August. It also allowed us to know that VIX Spikes were possible on other future dates – such as the most recent date near August 4th. Even though the current VIX Spike did not hit exactly on the August 4th cycle date, the actual VIX Spike move happened only two trading days after our predicted date and the VIX has rallied over 90% from recent lows. Sometimes, analysis like this allows us to know months in advance that a cycle or critical event may have a higher probability of happening. This allows us to plan and profit from our research.
Today’s research correlates to the recent price moves in the XCI index (Computer Technology), NASDAQ and US Majors. The premise of this research is that the past 4+ years have resulted in a global investment in Technology firms as a result of lower ROI in most other sectors. This focus on technology investing is uniquely similar to the XCI Index DOT COM rally from the late 1990s and early 2000s. We are attempting to verify our presumptions and analysis by using core technical analysis techniques as well as fundamental price analysis.
We’ll start by looking at the price activity leading up to the 2000 DOT COM bubble burst. Initially, our analysis focused on the similarities in price action setting up this price move. The Accumulation, Exuberation/Pause, Hype and eventual CRASH phase. In 1995, the Accumulation phase initiated after a nearly 95% rally from 13+ months earlier (1994 – 462 weeks total). Currently, the Accumulation phase initiated after a 100%+ rally from 13+ months earlier (2009 – 427 weeks total). Subsequently, the Accumulation phase lasted 1057 weeks resulting in a 238%+ advance in 1998. The current Accumulation phase lasted 1456 weeks resulting in a 77%+ advance in 2014. Interestingly, the 1998 advance totaled 472.50 pts while the 2014 advance totaled 594.00 pts – resulting in a 125% advance size increase.
The Exuberation/Pause phase in 1999 lasted 252 weeks and resulted in a 207.19 pt move (+31.51%). The Exuberation/Payse phase in 2016 lasted 889 weeks and resulted in a 288.26 pt move (+21.15%). The more recent phase took 3.5x longer (time) to result in 139% greater price advance (which was actually a reduced percentage move of only 67% of the 1999 advance.
Many analysts may be quietly stating, “all of this can be attributed to relationships of percentage values vs higher price valuations”, which is of course true. Our attempt at dissecting these moves is to try to understand the propensity and strength of any future moves.
Lastly, the HYPE phase lasted 39 weeks in 2000 ending with an advance of 895.23 pts (+97.94%) from the PAUSE/FLAG breakout in 1999. The current HYPE phase lasted 53 weeks ending with an advance of 674.54 pts (+40.26%) from the PAUSE/FLAG breakout in 2016. The resulting current HYPE price advance is 25% lesser than the 2000 move and results in a nearly 60% decrease related to the total percent swings.
2000 DOT COM – XCI Index Chart
2017 DOT COM – XCI Index Chart
The 2000 total phase advance lasted 220 weeks and resulted in a price advance of +1607.53 pts (+802.39%). The 2017 total phase advance lasted 436 weeks and resulted in a price advance of +1878.21 (+402.97%). The percent values of each move represent vastly different results, yet the total price moves differ by only 17%. We are certain some of these values and percentage representations are sparking interest in some of you as you may understand Fibonacci, Gann and other price analysis techniques.
The key to understanding these similarities is to understand the price sometimes moves in similar, not exact, setups and that we should never discount the possibility that markets are setting up for another massive move. Considering these price and relationship values, it is our perception that any global event, liquidity collapse or massive terrorist event could present a scenario that may result in a repeat of the 2000 DOT COM market collapse. Our premise is that the US has been an investment safe harbor for many and that Technology (FANGs and others) have benefited greatly from the global market weakness over the past 7+ years. It is our opinion that the capital that has been allocated into these global technology giants has, as in the past, setup a potential for history to repeat itself (given the right type of events/circumstances).
COMBINED DOT COM – XCI Index Charts
Our recent VIX Spike analysis shows we should expect future VIX Spikes on Aug 23rd, Sept 11th or 12th and finally Sept 28th or 29th. Assuming the relationship between the current price setup and the past setup is relative to the types of relationships we’ve studied so far, we can predict the following :
The initial swing low after the ultimate high (2000) resulted in a 572.02 pt move (a 31.62% correction over 10 weeks). Any current correction could result in an 8~15.5% price correction over 7~15 weeks. This would put our estimates of a price low near 2152~1980 on or near Sept 25th or Oct 23rd. This price low would be followed by 4~12 weeks of price advance setting up a right shoulder near 2150~2256 (possibly). Following that, we would see the low price rotation broken by extreme selling pressure and ultimate low target near 770~581 (resulting in a 63~69% correction from the highs).
Do we know this WILL happen? NO. Can we estimate the probability of it happening as we predicted? NO. How can we tell if this will play out as we are predicting? If the market continues to break down and begins to form the right shoulder, then we would consider, at least this first phase, to be technically accurate. If it fails to move lower to establish this move, then we would consider this a technical breach of our research and attempt to reevaluate our theories.
Thus, what we can do at this point is alert you to the potential that a massive Head-n-Shoulders formation may be setting up in the global/US markets related to a potential Tech Bubble. The proof will come with confirmation of our analysis or the failure of our analysis as price plays out over the next few weeks.
Still, the correlation of the VIX SPIKE dates, Aug 23rd, Sept 11th or 12th and finally Sept 28th or 29th, are interesting because our initial analysis of any price low indicates a potential low price date range near September 25th. Should this become true, an 8~15% correction in the XCI would clearly result in a 4~9%+ correction in the NQ and would correlate with our VIX Spike analysis almost perfectly.
The only thing we can do is be aware of these relationships and price patterns that are setting up and plan our trades properly. Every trade includes risk, attempting to manage that risk is the objective of most traders. At this point, Aug 23rd, Sept 11th or 12th and finally Sept 28th or 29th are critical dates to keep in mind as the future plays out before us. Watching for these moves and being aware that they could be setting up for a massive price swing lower are important factors to consider and being able to protect open LONG positions would not be a bad idea over the next few months.
The only way one can tell if predictions of the future are going to be accurate or not is to wait for the future to get here and see how well these predictions worked out. So, we wait with the understanding that we are watching for confirmation or failure of our analysis with each week.
If you like our research and analysis and want to learn more about our forecasting and trade alert services, to see what we can offer you. We provide daily market updates, clear and concise trading triggers/signals, advanced research and analysis of the US and global markets and more.
As we can see at the H4 chart, after being corrected by 38.2%, Gold has broken the local high and reached the post-correctional extension area (the retracements of 138.2% – 161.8%). If the pair continues growing at the same pace, the target may be the retracement of 261.8% at 1310.39. At the same time, we can see that the price is forming the divergence, which may indicate a possible trend reverse.
At the H1 chart, Gold may finish the ascending impulse and may start another correction. The closest target of this possible descending correction is the retracement of 38.2% at 1276.51. However, later the price may continue forming this ascending impulse with the target at 1299.00 (the retracement of 161.8%.
USD CHF, “US Dollar vs Swiss Franc”
As we can see at the H4 chart, the USD/CHF has been corrected by 50%. The next upside targets may be at 0.9842 (the retracement of 138.2%), which is the same as the downside border of the post-correctional extension of the local decline. The upside target area is the retracement of 161.8% at 0.9888.
At the H1 chart, the pair is forming the convergence, which may indicate a new correction or a reverse. In the nearest future, the price may be corrected to the upside to reach the retracements of 38.2%, 50%, and 61.8% at 0.9654, 0.9676, and 0.9699 respectively.
Attention! Forecasts presented in this section only reflect the author’s private opinion and should not be considered as guidance for trading. RoboForex LP bears no responsibility for trading results based on trading recommendations described in these analytical reviews.
Trading opportunities on the currency pair: Despite the rise in geopolitical tensions between the US and North Korea, some technical bullish signals are being seen on the US dollar. The lower boundary of the C-C channel and the 50% level have formed a strong support zone between 108.13 and 108.73. A double bullish divergence has formed between the price and the AC indicator. The daily candlestick on Friday closed with a doji. If the price starts to grow from its current level, should it break 109.90, this growth will continue to 111.05. I’m expecting to see a rebound from 108.13 with a target of 110.57.
Background
The last idea on this currency pair was published on the 8th of May, 2017. At the time of publication, the US dollar was selling for 112.55 JPY. As the price approached the trend line, large speculators started closing their long positions on the yen. As a result of this, I was expecting to see a classic rebound from the trend line and a drop for the dollar to 111 JPY, or to 109.25 had the price broken 110. Both targets were reached, although I don’t believe that my idea of a rebound fully came off. The dollar started to fall from 114.37 4 days after the review was published.
Current situation
In the space of 5 weeks, the US dollar has fallen by 4.25% against the yen (473 pips). This drop gathered pace on the back of a retreat towards safe haven assets (including the yen) owing to a rise in geopolitical tensions between the US and North Korea. The rhetoric coming out of Washington and Pyongyang is escalating. In a telephone call on the 12th of August, Donald Trump relayed to French president Emmanuel Macron that the US was ready to attack North Korea if they fail to stop their nuclear program and to stop conducting ballistic missile tests.
Britain, China, and the EU have called on the US to find a diplomatic solution to the crisis. North Korea continues to conduct ballistic missile tests under the pretense of protecting themselves from the US despite sanctions from the UN Security Council, which were intensified on the 7th of August. According to reports, around 3.5 million have volunteered to join the North Korean army to help protect their country. Now we’ll take a look at some technical analysis and what may be in store for the dollar and yen.
Fig 1. Weekly chart. Source: TradingView
Before doing some technical analysis, we need to impose the Fibonacci net over the upwards movement from 98.97 to 118.66. The 50% level at 108.73 is providing strong support to the dollar. Now we should form two channels; B-B and C-C. I hope I don’t need to explain how they’re formed. I’ll return to this later, but first I’d like to take a look at the latest COT report.
On Friday, the 11th of August, the CFTC (Commodity Futures Trading Commission) brought out a new weekly report. The COT (Commitments of Traders) report gives a summary of traders’ open positions between 02/08/17 and 08/08/17 inclusive.
Large speculators (Non-commercial): In the last week, long positions have increased by 5,334 to 36,483 contracts. Short positions have fallen by 12,838 to 136,105 contracts. Net short positions have fallen by 18,171 to 99,622 contracts.
Small speculators (Non-reportable positions): Long positions have risen by 624 to 22,249 contracts, while short positions have grown by 2,223 to 36,858 contracts, Net short positions have risen by 1,598 to 14,609 contracts.
Hedgers (Commercial): This group of market participants tends to open long positions against large speculators. In the last week, they’ve reduced their long positions by 17,812 to 184,541 contracts. Short positions have fallen by 1,239 to 70,310 contracts. Open interest has fallen by 18,190 to 266,611 contracts.
The last 3 trading days have not been included in this latest COT report. In this time, the Japanese yen has risen against the dollar by 1.69%. I think it likely that in the next report, we’ll see this upwards trend on the yen continue. The latest data shows that large speculators are increasing their long positions and reducing short positions. Hedgers, on the contrary, are actively selling yen. Small speculators are going against the trend, but we can see that in the last week, their tactics haven’t worked out.
The lower boundary of the C-C channel and the 50% level have joined to form a strong support zone at 108.13 – 108.73. Taking the data of the COT report into account, I’m going to risk going for a rebound from this zone up to 110.57. One should understand that such a rebound will only occur if the US and North Korea manage to find a diplomatic solution to this conflict.
Fig 2. Daily chart. Source: TradingView
After breaking the 109.50 support (projected from 108.13 and 108.80 lows), sellers will take aim at the lower boundary of the C-C channel at 108.13. Despite the negatives, there are some positive factors for the dollar.
1. The distance between the lows of the 17th of April (108.13) and the 16th of June (108.80) is 42 bars or 58 days. Between the 16th of June and the 11th of August there’s also a distance of 42 bars or 58 days.
2. A double bullish divergence has formed between the price and the AC indicator.
3. The daily candlestick closed with a doji on Friday, suspending the downwards trend.
If the price starts to grow from its current level, then when it breaks 109.90, the growth will continue to 111.05. I’m expecting a rebound from 108.13 to 110.57.