Large speculators added to their bearish net positions in the S&P500 futures markets for a second week this week, according to the latest Commitment of Traders (COT) data released by the Commodity Futures Trading Commission (CFTC) on Friday.
The non-commercial futures contracts of S&P500 futures, traded by large speculators and hedge funds, totaled a net position of -3,469 contracts in the data reported through Tuesday August 22nd. This was a weekly change of -1,557 contracts from the previous week which had a total of -1,912 net contracts.
Speculative positions are now at their most bearish level since June 13th when net positions totaled -5,466 contracts.
S&P500 Commercial Positions:
The commercial traders position, categorized by the CFTC as hedgers or traders engaged in buying and selling for business purposes, totaled a net position of -10,609 contracts on the week. This was a weekly increase of 7,253 contracts from the total net of -17,862 contracts reported the previous week.
SPY ETF:
Over the same weekly reporting time-frame, from Tuesday to Tuesday, the SPY ETF, which tracks the price of S&P500 Index, closed at approximately $245.44 which was a loss of $-1.07 from the previous close of $246.51, according to unofficial market data.
*COT Report: The COT data, released weekly to the public each Friday, is updated through the most recent Tuesday (data is 3 days old) and shows a quick view of how large speculators or non-commercials (for-profit traders) as well as the commercial traders (hedgers & traders for business purposes) were positioned in the futures markets. The CFTC categorizes trader positions according to commercial hedgers (traders who use futures contracts for hedging as part of the business), non-commercials (large traders who speculate to realize trading profits) and nonreportable traders (usually small traders/speculators). Find CFTC criteria here: (http://www.cftc.gov/MarketReports/CommitmentsofTraders/ExplanatoryNotes/index.htm).
Precious metal speculators continued to lift their bullish net positions in the Silver futures markets this week, according to the latest Commitment of Traders (COT) data released by the Commodity Futures Trading Commission (CFTC) on Friday.
The non-commercial futures contracts of Silver futures, traded by large speculators and hedge funds, totaled a net position of 44,546 contracts in the data reported through Tuesday August 22nd. This was a weekly boost of 5,695 contracts from the previous week which had a total of 38,851 net contracts.
Silver speculative bets have now increased for five weeks straight (by a total of over +35,000 contracts) to the highest net level since June 20th.
Silver Commercial Positions:
The commercial traders position, categorized by the CFTC as hedgers or traders engaged in buying and selling for business purposes, totaled a net position of -55,049 contracts on the week. This was a weekly decrease of -6,961 contracts from the total net of -48,088 contracts reported the previous week.
SLV ETF:
Over the same weekly reporting time-frame, from Tuesday to Tuesday, the SLV ishares ETF, which tracks the price of silver, closed at approximately $16.07 which was a gain of $0.33 from the previous close of $15.74, according to unofficial market data.
*COT Report: The COT data, released weekly to the public each Friday, is updated through the most recent Tuesday (data is 3 days old) and shows a quick view of how large speculators or non-commercials (for-profit traders) as well as the commercial traders (hedgers & traders for business purposes) were positioned in the futures markets. The CFTC categorizes trader positions according to commercial hedgers (traders who use futures contracts for hedging as part of the business), non-commercials (large traders who speculate to realize trading profits) and nonreportable traders (usually small traders/speculators). Find CFTC criteria here: (http://www.cftc.gov/MarketReports/CommitmentsofTraders/ExplanatoryNotes/index.htm).
Large speculators increased their net positions in the Copper futures markets this week, according to the latest Commitment of Traders (COT) data released by the Commodity Futures Trading Commission (CFTC) on Friday.
The non-commercial futures contracts of Copper futures, traded by large speculators and hedge funds, totaled a net position of 40,846 contracts in the data reported through Tuesday August 22nd. This was a weekly lift of 4,017 contracts from the previous week which had a total of 36,829 net contracts.
The copper speculative position has now advanced higher for a sixth straight week and to the highest level since February 21st when net positions totaled +42,794 contracts.
Copper Commercial Positions:
The commercial traders position, categorized by the CFTC as hedgers or traders engaged in buying and selling for business purposes, totaled a net position of -41,062 contracts on the week. This was a weekly decline of -3,917 contracts from the total net of -37,145 contracts reported the previous week.
JJC ETF:
Over the same weekly reporting time-frame, from Tuesday to Tuesday, the JJC iPath Bloomber Copper ETN, which tracks the price of copper, closed at approximately $34.24 which was an uptick of $1.33 from the previous close of $32.91, according to unofficial market data.
*COT Report: The COT data, released weekly to the public each Friday, is updated through the most recent Tuesday (data is 3 days old) and shows a quick view of how large speculators or non-commercials (for-profit traders) as well as the commercial traders (hedgers & traders for business purposes) were positioned in the futures markets. The CFTC categorizes trader positions according to commercial hedgers (traders who use futures contracts for hedging as part of the business), non-commercials (large traders who speculate to realize trading profits) and nonreportable traders (usually small traders/speculators). Find CFTC criteria here: (http://www.cftc.gov/MarketReports/CommitmentsofTraders/ExplanatoryNotes/index.htm).
The AUD/USD pair is trading at 0.7915; the instrument is still moving above Ichimoku Cloud, which means that it may continue growing. We should expect the price to test the upside border of the cloud at 0.7905 and then continue moving upwards above 0.8005. However, this scenario may be cancelled if the price breaks the downside border of the cloud and fixes below 0.7875. In this case, the pair may continue falling towards 0.7820.
NZD/USD, “New Zealand Dollar vs US Dollar”
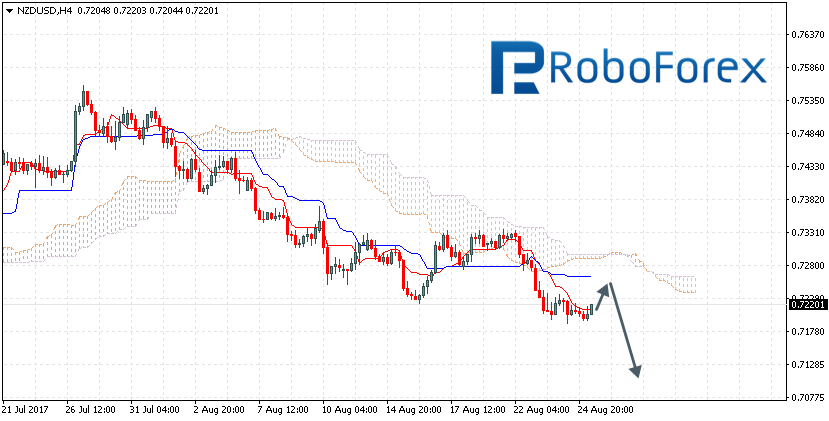
The NZD/USD pair is trading at 0.7201; the instrument is still moving below Ichimoku Cloud, which means that it may continue falling. We should expect the price to test Tenkan-Sen and Kijun-Sen at 0.7235 and then continue moving downwards to reach 0.7115. However, the scenario that implies further decline may be cancelled if the price breaks the upside border of the cloud and fixes above 0.7280. In this case, the pair may continue growing towards 0.7390.
USD/CAD, “US Dollar vs Canadian Dollar”
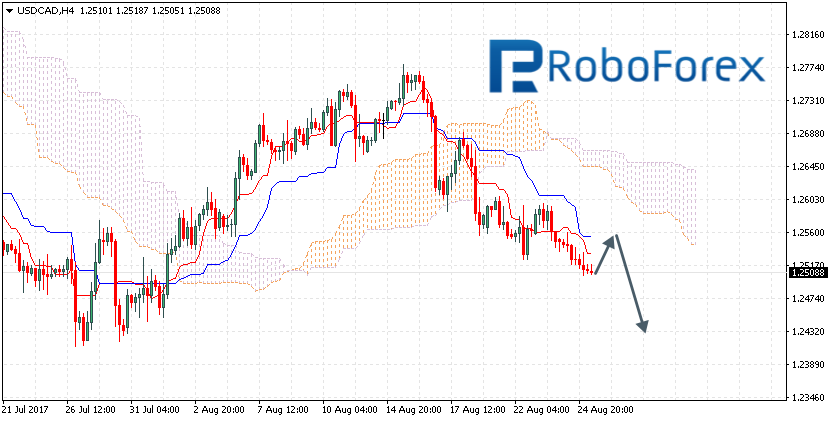
The USD/CAD pair is trading at 1.2508; the instrument is still moving below Ichimoku Cloud, which means that it may continue falling. We should expect the price to test Tenkan-Sen and Kijun-Sen at 1.2560 and then continue moving downwards below 1.2430. However, this scenario may be cancelled if the price breaks the upside border of the cloud and fixes above 1.2660. In this case, the pair may continue growing towards 1.2780.
Attention! Forecasts presented in this section only reflect the author’s private opinion and should not be considered as guidance for trading. RoboForex LP bears no responsibility for trading results based on trading recommendations described in these analytical reviews.
The EUR/USD pair is trading to the downside. Possibly, the price may reach 1.1772 and then grow with the target at 1.1794. After that, the instrument may continue moving downwards to reach 1.1733.
GBP USD, “Great Britain Pound vs US Dollar”
The GBP/USD pair is trading to rebound from 1.2826. Possibly, the price may reach 1.2732. Later, in our opinion, the market may be corrected towards 1.2935.
USD CHF, “US Dollar vs Swiss Franc”
The USD/CHF pair is growing towards 0.9669. We think, the price may break this level and then continue growing inside the uptrend with the target at 0.9700.
USD JPY, “US Dollar vs Japanese Yen”
The USD/JPY pair is still consolidating. Possibly, today the price may reach 109.80 and then fall towards 109.04. If later the instrument breaks this consolidation channel to the downside, the market may continue falling towards 107.07; if to the upside – start another correction with the target at 110.80.
AUD USD, “Australian Dollar vs US Dollar”
The AUD/USD pair is trading around 0.7900. Possibly, the price may fall towards 0.7860, break it, and then continue moving downwards with the local target at 0.7755.
USD RUB, “US Dollar vs Russian Ruble”
The USD/RUB pair is consolidating around 59.14. If later the instrument breaks this channel to the downside, the downtrend may continue towards 58.38; if to the upside, the market may be corrected to reach 59.89.
XAU USD, “Gold vs US Dollar”
Gold is still consolidating around 1286.86. We think, today the price may grow to reach 1291.55 and then fall towards 1279.15. Later, in our opinion, the market may grow with the target at 1286.00 and then break this range to the downside. The local target is at 1255.00.
BRENT
Brent is moving upwards. Possibly, the price may reach 52.60, break it, and then continue growing towards the local target at 54.08. The main upside target is at 55.15.
Attention! Forecasts presented in this section only reflect the author’s private opinion and should not be considered as guidance for trading. RoboForex LP bears no responsibility for trading results based on trading recommendations described in these analytical reviews.
In this article I am going to share with you 3 core reasons why systematic trading strategies work well in real-time trading and why it is worth applying this approach comparing to the discretionary trading (which could be a lot profitable as well). Many traders and investors would agree that the 3 commons traits of the successful trading be it in stocks, commodities, Forex ect. are – (1) Methodology, (2) Money Management or Position Sizing and (3) Psychology. Let`s examine each of them and ponder upon how systematic approach would improve them.
Check out your Methodology Before Putting Real Money
When your rules are 100% rule-based and don’t require trader`s interpretation you could check if your desired entries and exits had been profitable in the past. The research can be done manually looking at the charts or automatically if you have programmed a strategy code for particular platform like TradeStation or Metatrader 4 for example. Look at the chart below:
It represents simulated trading measured in R-multiple for 16 years trading for sideways type strategy intended for spot Gold market. It is clearly a losing systematic strategy. The long-term backtesting period is enough to convince us that this is not a valid strategy and there is no chance of future gains. The consistency of down heading equity curve is unequivocal. Because we were able to check the systems beforehand we have saved a lot of real money putting them into losing endeavor. However, the logic of system sounded pretty solid and promising initially. Without backtesting we would have put real money in the strategy and for sure losing them all in a few months.
Now let`s take a look at the following chart which is trading system designed for eur-usd:
Consider its upward equity curve and how consistent it is. Again the backtesting period is 16 years and all trades are represented in R-multiple. This is a kind of strategy to which we would put our real money. It is profitable we are confident that it will remain a winning one in the future because of the long-term backtesting period where the system has been thrown into different market phrases like big trends, quiet market and volatile sideways situations.
So, investing some time to check out our systematic trading system gave us a big advantage over discretionary traders who cannot check if their rules are working at all, even though they may sound very logical and promising on paper.
Limit your MaxDD using Money Management or Position Sizing
When you know your strategy`s characteristics you will be able to apply to it the appropriate position sizing formula. Suppose your MaxDD for the backtested period is 10R and you are a very conservative trader not willing to risk more than 10% of your trading account. Knowing in advance that your biggest drop in the equity curve it will make sense choosing a risk of 1% per trade which will limit your overall risk exactly to 10% assuming of course that the future performance will be similar.
On the other hand if you are an aggressive trader with big risk tolerance of 40%, then your obvious solution would be to put 4% on the table per trade.
As you can see it is possible to choose the right money management tactic for you because you have already a strategy’s characteristics which act as a base of your decision making process.
A discretionary trader could not know in advance how many loosing trades in a row or how big the MaxDD would be. There should be a certain time of real trading passed in order be taken an appropriate calculation of those metrics and thus choose position sizing formula which is best suitable. One may end up being too conservative or too aggressive trading your non 100% rule-based system.
As violent demonstrations linger domestically and nuclear risks loom abroad, the White House has flamed new domestic divisions, while paving the way for international trade wars. The coming fall will be the hottest – and potentially most violent – in decades in America.
America is amid a great unease. While Charlottesville’s white supremacists and violent riots brought forward old race divisions and seemingly new hate groups, North Korea’s nuclear threats prevail.
In the fall, the White House and the Congress must also cope with a set of political time bombs, including the impending fight for the nation’s debt ceiling (US debt amounts to $20 trillion, or 105% of GDP), the 2018 federal budget, polarizing tax reforms, infrastructure spending and possibly another effort to overthrow Obamacare (i.e., The Patient Protection and Affordable Care Act, ACA).
Internationally, these huge challenges will be coupled by the Trump administration’s ongoing attempt to confront China in intellectual property, re-negotiate the North American Free Trade Agreement (NAFTA) and re-define US relationship with its European NATO allies through deficit-targeting trade surpluses.
Meanwhile, special counsel Robert Mueller’s Russia investigation has zoomed on Trump’s businesses, while calls for Trump’s impeachment, resignation and assassination are escalating. Not surprisingly, economic prospects are now more uncertain and markets more volatile, as evidenced by light trading volumes after two weeks of losses in equities. Still, the cyclically-adjusted price-earning (Shiller CAPE) ratio remains close to 30 – as in October 1929 but higher than before the 2008 crisis.
Domestic Divisions
During the 2016 presidential campaign, Trump promised to increase real economic growth to 4 percent. At the time, I predicted that would never happen and, due to political destabilization, economic growth could take a hit. That’s now the case.
Growth will remain about 2-2.2 percent in 2017-18, although further destabilization could reduce it by 0.2-0.4 percent. The economy’s long-term potential growth rate is 1.8 percent, due to aging demographics and retiring big boomers. But if Trump will cut immigration by 50 percent in a decade, as he plans, growth and productivity will take another hit. According to a new Wharton School report, the immigration plan, dubbed the RAISE Act, would result in 4.6 million lost jobs by the year 2040.
In turn, Trump’s tax reform plans would require the support of the Congress, which is highly unlikely. In effect, any effort by the White House to rely on congressional support is currently compromised, due to the ongoing Special Counsel Robert Mueller’s Russia investigation. In the absence of a repealed Obamacare, the Trump tax plan would raise federal government debt to 115-140 percent of GDP by 2027, and double it by 2047.
While bipartisan support prevails for corporate tax reforms (US rate is the highest among major advanced economies) and the simplification of personal-income taxes, Democrats will not tolerate a 15-percent corporate tax rate or huge personal-income tax reductions for the rich. So Trump is likely to resort to moderate tax cuts that could amount to $500 billion in early 2018 – conveniently before the approaching mid-term elections.
One of Trump’s key initiatives has been the plan to address America’s crumbling infrastructure by spurring $1 trillion in investment over time. But thanks to the Mueller investigation, the plan is on hold. Initially, the multiplier effect of the investment was still expected to be substantial but lessen over time as the economy strengthens. But time is money. According to projections, a $1 investment in the infrastructure in 2015 could have added $1.70 to U.S. GDP in just a few years. But as the economy has continued to strengthen, the multiple is now estimated at $1.30.
Since the expected fiscal expansion is late, even in the most benign scenario it will amount and achieve less than anticipated. As Trump dreams turn to realities, the glitter is fading and only rust remains.
International Nightmares
After the Trump-Xi Florida Summit in early April, U.S. and China announced a 100-day Action Plan to improve strained trade ties. Yet, just two weeks later, Trump issued a Presidential Memorandum, which directed Commerce Secretary Wilbur Ross to investigate the effects of steel imports on national security grounds.
By June, Europe’s NATO leaders launched an extraordinary lobbying campaign against an anticipated US crackdown on steel imports, which, they said, would hit US allies more than China. Instead of a long legal battle at the WTO, European trade chiefs are considering more immediate and consequential measures, such as punitive tariffs on agricultural products like corn, soy or rice. The goal is to turn U.S. farmers, many of whom voted for Trump, against the White House.
As the G20 Summit ended, Washington was left isolated on climate change. While the G20 vowed to continue to fight protectionism, the U.S. managed to include in the final communique terms, such as “all unfair trade practices” and “legitimate trade defense instruments” – which could serve as pretext for protectionist measures in the future.
In late June, amid a contentious internal debate on trade and tariffs in the Roosevelt Room, Trump overruled his own Cabinet, even at a risk of a global trade war. Supported by two hawks, trade policy director Peter Navarro, senior policy adviser Stephen Miller (and then-chief adviser Steve Bannon who was not in the meeting), the plan was opposed by 22 top White House officials who spoke for moderation.
More followed soon. When the Trump administration’s first US-Sino Comprehensive Economic Dialogue (CED) ended in Washington in July, it could agree on nothing; not even on a joint statement. Then, the Trump administration seized steel as a “a national security threat,” moving spotlight to its NAFTA partners. China produces almost half of the world’s steel, but its US market share is less than 2%. In America, the largest steel importers are Canada (17%) and Mexico (9%).
NAFTA matters. Ever since it was implemented, the value of U.S. agricultural exports alone to its NAFTA partners has risen from $8.7 billion in 1992 to $38.1 billion in 2016. NAFTA has also contributed to a large increase in trade in vehicles and auto parts within North America. Since 1994, the vehicle supply chain has become fully integrated, with parts manufacturing and assembly in all three countries.
Whatever happens to the NAFTA is not just the concern of North America. As a legacy agreement, it has served as a template for the new generation of free trade agreements (FTAs) that the United States has later negotiated, and as a template for certain provisions in multilateral trade negotiations as part of the Uruguay Round. Consequently, whatever the NAFTA will ultimately become will overshadow Washington’s future FTAs with the rest of the world.
Moreover, as new trade conflicts will extend to imported aluminum, semiconductors, paper, and household appliances, trade friction will spread to China and other major importers – as evidenced by the new debate on intellectual property and technology.
After mid-August, Trump directed the U.S. Trade Representative Robert Lighthizer, a veteran Reagan administration trade hawk, to open an investigation into China’s intellectual property (IP) practices, including forced IP transfers and theft. The linkage between the investigation and the US intelligence community – and new meaning of the term “trade war” – was highlighted by the role of Admiral Dennis Blair, co-chair of the U.S. IP Commission – and former Director of National Intelligence and a retired admiral who served as the commander of U.S. Pacific forces.
As Lighthizer’s investigation will proceed under Section 301 of the Trade Act of 1974, some 40-year old legislation that was seized in the 1980s to deter the rise of Japan, the investigation could lead to steep tariffs on Chinese goods.
“This is just the beginning,” Trump told reporters after he signed the executive memorandum. Days later, the White House set a tough tone in the NAFTA talks with Canada and Mexico.
And so the Pandora’s Box of trade wars has been opened.
Meanwhile, special counsel Robert Mueller has impaneled a grand jury in the investigation of Russia’s alleged interference in the 2016 U.S. election. In practice, it means that Mueller has the power to issue subpoenas and to put witnesses under oath, while the investigation is reaching to Trump campaign’s contact with Russians, and the real estate deals by him and his son-in-law Jared Kushner.
The ultimate objective, which is supported by both Republican neoconservatives and Democratic internationalists, seems to be to impeach Trump. Ultimately, the “Russiagate” is likely to be legitimized on the basis of alleged evidence, which will not be released in public on “national security” grounds. And while grand jury testimony officially takes place in secret, leaks are guaranteed to keep the story in headlines, especially by media that is strongly opposed to the Trump presidency. However, due to the broader-than-expected investigation, its results are not likely to be available anytime soon.
The more benign scenario, which was recently presented by Tony Schwartz, the ghost-writer of Trump’s 1987 bestseller Art of the Deal , is that if the Mueller investigation corners the incumbent president, he would resign to avoid public humiliation, thus trying to turn a failure in the White House into a political victory – in such conversions Trump does have a long track-record.
Veteran Republican Ron Paul predicted a darker scenario in January: the assassination of Trump by the U.S. “deep state” (i.e., the U.S. industrial-military complex and intelligence community). Recently, the threat was seconded by Mueller’s former deputy, Philip Mudd, the ex-deputy director oft he CIA’s Counterterrorist Center and the FBI’s National Security Branch, who currently serves as CNN counter-terrorism analyst.”The government is going to kill this guy because he doesn’t support them,” he said recently; on air.
In turn, some Democratic senators and representatives have openly advocated Trump’s execution. As Democratic Senator Maria Chappelle-Nadal recently wrote in Facebook: “I hope Trump is assassinated!” Afterwards, she apologized for her hope but only to deter an impending U.S. Secret Service investigation of the incident.
And yet, recently, U.S. Secret Service affirmed that it can no longer pay hundreds of agents it needs to protect the incumbent president – in large part due to Trump´s multiple travel destination, the sheer size of his extended family, and efforts to secure multiple residences.
In this extraordinarily heated political environment, the Democrats could capitalize on the Trump debacles, if they were not amid a meltdown of their own.
After the 2016 elections, the Clinton Foundation shut down the Clinton Global Initiative (CGI), which critics openly called a “crime syndicate,” since it funded mainly the Clintons’ personal ventures rather than Haiti or other destinations of abject need. The political force behind Senator Hillary Clinton, the Democratic Leadership Council (DNC), has been plagued by a series of scandals, including collusion with mainstream media (e.g., CNN, New York Times, Washington Post), corrupt Ukrainian officials, alleged fraud to subdue Bernie Sanders’ campaign, manufactured allegations about Russian interference, controversial liquidation of millions of dollars in real estate assets, the crimes of former DNC chair Debbie Wasserman-Schultz, the indictment of her IT aide Imran Awan in a huge bank-fraud scheme and so on.
Moreover, a dozen Democrats that have leaked emails to the Wikileaks and those Republicans who have sought to disclose the Clintons’ fraud have died in suspicious circumstances in the past year. Not surprisingly, conspiracy stories continue to proliferate from the left to the right.
Presidency at the Crossroads
According to U.S. mainstream media, Trump has lost all support in America and now governs without the consent of the governed. However, that’s fake news, as evidenced by longitudinal Gallup polls.
President Trump’s job approval was relatively highest when he arrived in the White House last January, when 45 percent of Americans still believed he would do a good job, and another 45 percent did not. Thereafter, Trump’s performance has eroded. Today, almost 40 percent of Americans approve his performance but nearly 60 percent do not (Figure 1). These results are actually more moderate than those of President Obama. When he arrived in the White House in 2009, most Americans had faith in him; when he left, he had lost almost half of his political capital.
America’s deep polarization originates from the neoconservative wars against Iraq, Afghanistan and the War on Terror, which have divided the nation ever since. It peaked in the end of the George W. Bush era and the beginning of the Obama rule, when nine of ten Americans disapproved the direction of the nation. Even in mid-2016, toward the end of the Obama era, more than 80 percent of Americans disapproved that course. Today, a year later, more than 70 percent of Americans disapprove the course of the nation (Figure 2).
Now the White House is at the crossroads. “The Trump presidency that we fought for, and won, is over,” said Steve Bannon, Trump’s highly controversial chief strategist who had a critical role in his presidential triumph and as the chairman of the far-right Breitbart News, in a recent interview.
Today, critics of the Trump administration argue that it is a “Goldman Sachs” presidency since the bank’s senior executives control the key economic posts, such as Secretary of Treasury (Steven Mnuchin) and Chief of the National Economic Council (Gary Cohn). But the administration still has a fair number of trade hawks, including Peter Navarro, Robert Lightheizer and Dan DiMiccio, former CEO of steel giant Nucor, plus a group of senior advisers.
“We’re at economic war with China,” Bannon claims, “one of us is going to be a hegemon in 25 or 30 years and it’s gonna be them if we go down this path. Korea.. is just a sideshow.” After that interview with the center-to-left American Prospect, he resigned from the Trump administration to avoid being fired.
Now Bannon has pledged to support the Trump administration against the “globalists” through Breitbart. But in the White House, he did have enough time to contribute to the new deficit-targeting trade policies. Bannon’s plan of attack included the complaint under Section 301 of the 1974 Trade Act against the alleged Chinese coercion of technology transfers from U.S. companies in China, and follow-up complaints against steel and aluminum dumping.
In America, the coming fall will be the most challenging – and possibly most violent – in decades, perhaps since the early 1970s. That’s when the United States coped with the withdrawal from the gold standard, soaring deficits, the oil crisis and Vietnam’s aftermath, economic threats to dollar hegemony, student demonstrations and inner-city riots, resurgence of terrorism, a highly polarized nation, Watergate and, ultimately, the resignation of Richard Nixon.
At the time, the rest of the world was not immune to America’s chaos. Today, the heavily indebted and militarily overstretched America seeks to “unilateralize” the world trading system and its security alliances that it helped to multilateralize after the devastation of World War II. In the process, America is challenging its allies in Europe and Asia, even its own NATO partners.
But economically, America’s new policies threaten most those nations that now fuel global growth prospects, including China and the emerging economies. Ironically, America is now the greatest global risk.
This commentary was released by The World Financial Review on August 22, 2017. The online version will be followed by a print version (September-October 2017).
About the Author:
Dr Dan Steinbock is the founder of Difference Group and has served as research director at the India, China and America Institute (USA) and visiting fellow at the Shanghai Institutes for International Studies (China) and the EU Center (Singapore). For more, see https://www.differencegroup.net/