At the H4 chart, the GBP/USD pair completed the convergence and then the price reversed to the upside. By now, the previous trend has been corrected by 23.6%. The next targets of the current ascending correction may be the retracements of 38.2%, 50.0%, and 61.8% at 1.2963, 1.3020, and 1.3080 respectively.
At the H1 chart, the situation is similar.
EUR JPY, “Euro vs. Japanese Yen”
As we can see at the H4 chart, after being corrected to the downside by 50.0% and forming the convergence, the EUR/JPY pair has started forming a new ascending impulse. The closest upside target is the local high at 131.387. After breaking this level, the price may continue moving towards the post-correctional extension area between the retracements of 138.2% – 161.8% (132.853 – 133.767).
At the H1 chart, the pair is steadily moving inside the uptrend and starting a new local correction within it. The closest targets of this correction may be the retracements of 38.2% and 50.0% at 129.767 and 129.483 respectively. The upside target is the local high at 131.387.
Attention! Forecasts presented in this section only reflect the author’s private opinion and should not be considered as guidance for trading. RoboForex LP bears no responsibility for trading results based on trading recommendations described in these analytical reviews.
Being influenced by the news, the EUR/USD pair has broken 1.1800 upwards and may form another ascending structure. We think, today the price may move according to an alternative scenario and grow towards 1.1989. After that, the instrument may fall to test 1.1865 from above and then continue moving upwards to reach 1.2015.
GBP USD, “Great Britain Pound vs US Dollar”
The GBP/USD pair has broken 1.2860. Possibly, toady the price may choose an alternative scenario and grow towards 1.2940. Later, in our opinion, the market may fall inside the downtrend with the target at 1.2732.
USD CHF, “US Dollar vs Swiss Franc”
Being influenced by the news, the USD/CHF pair has broken 0.9640 downwards and may form another descending structure to reach 0.9536. After that, the instrument may be corrected to test 0.9600 from below and then continue falling with the target at 0.9515.
USD JPY, “US Dollar vs Japanese Yen”
The USD/JPY pair has completed the correction in the form of the classic Flag pattern and right now is trading to break the pattern’s downside border. Possibly, the price may fall to reach 107.76 and then test 108.77 from below. Later, in our opinion, the market may continue falling towards 107.00 or even extend this structure to reach 106.50.
AUD USD, “Australian Dollar vs US Dollar”
Being under pressure, the AUD/USD pair is trading upwards. Possibly, the price may form another ascending structure with the target at 0.79815 (an alternative scenario). After that, the instrument may continue moving downwards with the local target at 0.7755.
USD RUB, “US Dollar vs Russian Ruble”
Being under pressure, the USD/RUB pair is falling; this structure may be considered as the third one inside the downtrend. Possibly, the price may reach 58.43 and then start consolidating. Later, in our opinion, the market may break this consolidation range to the downside and continue forming the third wave to reach 57.55.
XAU USD, “Gold vs US Dollar”
Being influenced by the news, Gold has broken 1288.00 and may yet continue growing towards 1312.80. We think, today the price may consolidate between 1301.75 and 1295.44. After that, the instrument may break this range to the upside and grow to reach 1312.85 to complete this wave. Later, in our opinion, the market may continue falling inside the downtrend.
BRENT
Brent is trading above 51.86. Possibly, the price may grow to reach 52.62 and then start another correction to return to 51.86. Later, in our opinion, the market may continue growing towards the local target at 54.00. The main target of the wave is at 55.15. After that, the instrument may be corrected towards 50.00.
Attention! Forecasts presented in this section only reflect the author’s private opinion and should not be considered as guidance for trading. RoboForex LP bears no responsibility for trading results based on trading recommendations described in these analytical reviews.
On Friday the 25th of August, trading on the euro/dollar currency pair closed 1.02% up. Before Janet Yellen’s speech in Jackson Hole, the euro was trading around the LB balance line within a range of 1.1773 to 1.1828.
At the Federal Reserve’s annual conference, Yellen talked about financial stability and banking regulations. She gave no mention of monetary policy and there were no hints as to the likelihood of a further hike in interest rates this year. This triggered the opening of many short positions on the dollar. In its first growth spurt, the euro rose by 93 pips to 1.1890. After Draghi’s speech, this growth accelerated to reach 1.1941. The price then surged by another 60 pips.
Draghi also omitted any discussion of monetary policy from his speech. He talked instead about the economic recovery and how inflation levels remained below target. Draghi’s silence on the fact that the euro has grown significantly since the start of the year (+13.7%) may have triggered its growth before trading closed. Investors interpreted his words as a sign that the exchange rate was not a problem for the regulator.
On Monday the 28th of August, participants in the Asian session have shifted Friday’s maximum to 1.1960, after which a correctional phase began on the market. The euro rate fell to 1.1917 (-43 pips). At the time of writing, the euro is trading at 1.1930.
Considering that Monday’s economic calendar is virtually empty, the rate should ideally drop to the 67thdegree (1.1878). Also, given that the Stochastic is currently down, but has reversed upwards, there is still a risk that the rate will return to 1.1963. Still, there’s nothing for buyers to hold onto as things currently stand.
The U3 MA line has been providing some resistance. If the price reaches this level, it will try to continue towards the LB balance line. Before this happens, though, we could see the price move upwards in a saw tooth formation and triple top model.
For a while, buyers didn’t dare move out of the range from the 2nd of August. However, Draghi and Yellen finally gave the euro an upwards boost and euro bulls now have 1.20 in their sights. In order to reverse the bullish trend, we need some negative drivers for the single currency and some positives for the greenback. At the moment, there are none, or if there are, the market’s ignoring them.
In my forecast, I’m expecting to see some growth to 1.1945, although we might see the formation of a double top. Here, we need to keep an eye on volume. There are plenty of alternative scenarios, but we should keep an eye on volumes as we approach key levels in order to get an idea of buyers’/sellers’ intentions. The 180th degree runs through 1.1963. Growth might stop here. It isn’t worth aggressively shorting the euro against the trend. If you’re going to sell, try to get confirmation from 2 timeframes (the one you normally work with and a higher one).
As a kid who grew up in the 90’s, I have to admit I love my trends, be they rollerblades, denim overalls and Discmans. Yet, when it comes to trading a trend isn’t worth jumping on board, just because of its popularity alone. With abundant data available each with their own analysis technologies, traders can review various indicators that they can analyze to inform the trading positions that they should take. While some still require intensive number crunching, others require a more qualitative analysis. Yet, whether you’re a technical or a fundamentalist trader, a tool that is popular amongst both sides of the trading camp is analyzing market sentiment, or market trends.
In the case of the market trend, it’s about getting in on the bend.
Although rhyming doesn’t necessarily make statements true, in this case it happens to be quite accurate. A trader’s success in using market trends is about buying just as the market is going to take a bullish climb and selling just as it takes bearish fall. These analysis tools are subject to a trader’s interpretation of the expected direction that the market will go. As you can see in the table below, the bars indicate the traders’ Buy/Sell tendency over a period of time effectively outlining for a trader the apparent trend of the markets expected direction.
Trend Parameters
There are a number of parameters taken into account when analyzing the movement of trends. The most fundamental is the buy and sell percentage that account for the moving distribution of positions for each instrument. Popularity is also important as it measures the percentage of positions opened on a specific instrument, out of the total positions opened in any given time. This figure is also indicative of the liquidity and the associated spreads, with high liquidity bringing down the cost of the spreads. Furthermore, the greater an instrument’s popularity, the more accurate are the buy and sell percentage figures as it’s a stronger reflection of more traders’ tendencies. Finally, the time frame over which the data is collected is also another important parameter.
Be Aware!
Although the above information provides a clear indication of current market trends and which instruments are frequently traded, there is still more to this dynamic that’s needed to understand the full picture.
Sentiment Change Vs Current Trend
The time frame of a trend, may end up concealing new developments that have just started to take root. So while a trend is supposed to reflect the overall market tendency over a period of time, if there is a lag market sentiment will not be reflected as developments are occurring. For example, the bar line above for GBP/USD shows that 82.39% are buy positions, reflecting a very clear buy trend. However, a closer look into that development will show you that in the last half an hour the trend has actually declined and went down from 94.57% to 82.39%. This is then indicative of an entirely different story where traders are actually beginning to sell more, potentially to an extent that will reverse the swing of a trend in the direction of a sell.
Number of Positions Vs Amount Traded
It’s possible to argue that since the buy and sell percentage figures reflect a number of positions opened, they are not necessarily reflective of the overall amounts traded in each direction and can therefore be misinterpreted. For example over a time frame of one hour, 100 EUR/USD transactions are executed, 60 are a buy position with an average transaction amount of EUR10K and the other 40 sell positions have an average size of EUR 26k. Yet irrespective of the fact that more Euro was being sold against the USD, to a ratio of 1,170k: 550k, the sentiment indicator will still have a buy inclination of 60-40.
Crowdsourcing
Perhaps contributing to the rapid popularity of Social Trading, is its ability to gage market sentiment. Social trading enables a trader to evaluate the movement of a select group of masters for whom they are able to choose specific characteristics, be it a specific market, a specific instrument, or amongst traders with a long and proven track record. Doing this, the trader might find that whilst the wider market sentiment is going in one direction, the trader’s niche subgroup may actually have a trading trend in the opposing direction, and it may be a direction that’s more accurate.
About the Author:
Adinah Brown is a professional writer who has worked in a wide range of industry settings, including corporate industry, government and non-government organizations. Within many of these positions, Adinah has provided skilled marketing and advertising services and is currently the Content Manager at Leverate.
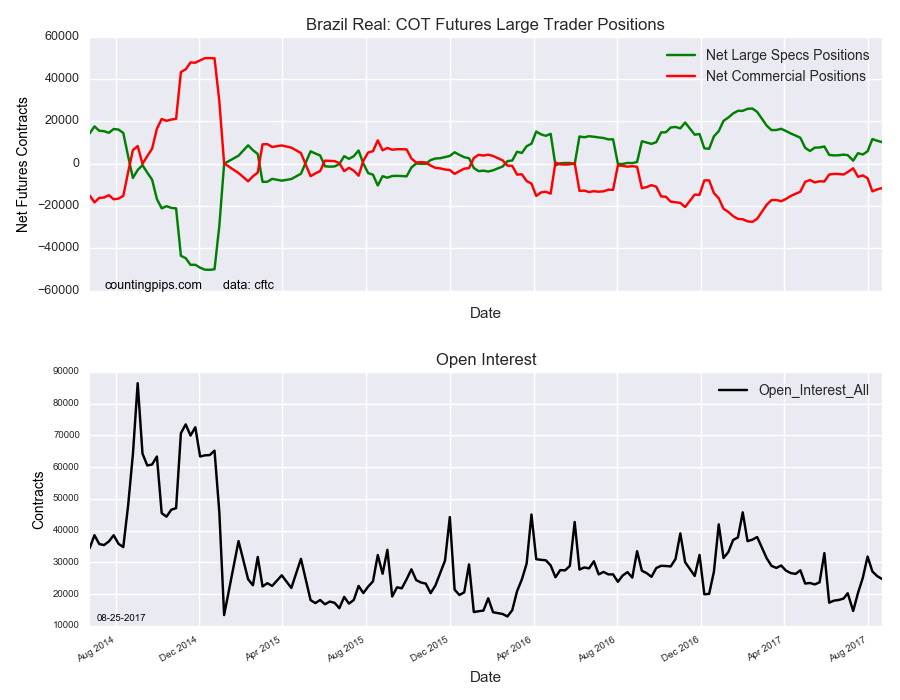
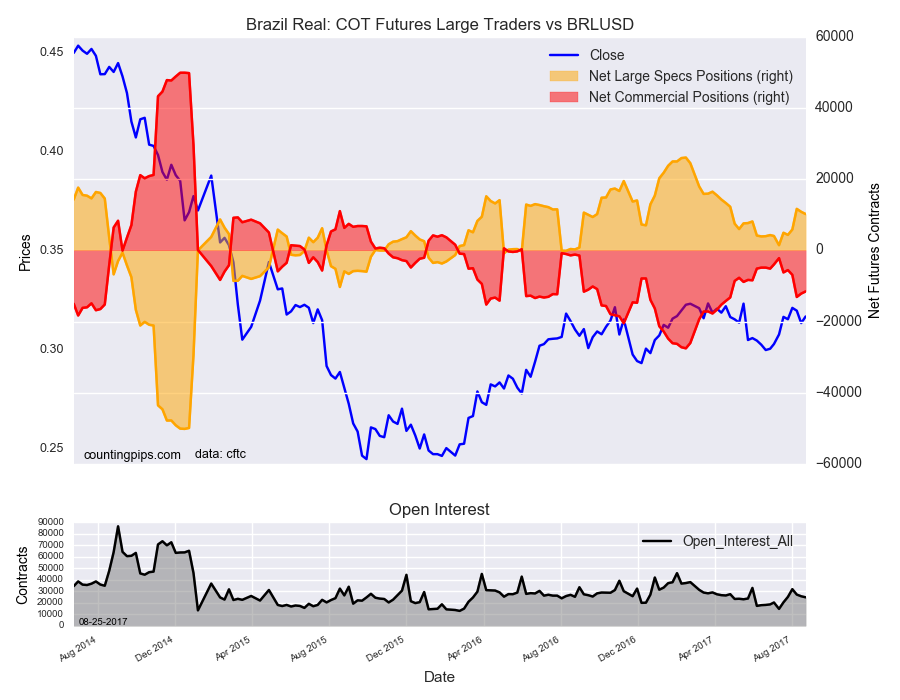
Large speculators slightly cut back on their bullish net positions in the Brazil Real futures markets this week, according to the latest Commitment of Traders (COT) data released by the Commodity Futures Trading Commission (CFTC) on Friday.
The non-commercial futures contracts of Brazil Real futures, traded by large speculators and hedge funds, totaled a net position of 10,186 contracts in the data reported through Tuesday August 22nd. This was a weekly reduction of -628 contracts from the previous week which had a total of 10,814 net contracts.
Speculators have trimmed their bullish positions for a second week although the bullish totals are above the +10,000 net position level for a third straight week.
Brazil Real Commercial Positions:
The commercial traders position, categorized by the CFTC as hedgers or traders engaged in buying and selling for business purposes, totaled a net position of -11,550 contracts on the week. This was a weekly uptick of 606 contracts from the total net of -12,156 contracts reported the previous week.
BRLUSD:
Over the same weekly reporting time-frame, from Tuesday to Tuesday, the BRLUSD Currency Pair closed at approximately $0.3169 which was an increase of $0.0033 from the previous close of $0.3136, according to unofficial market data.
*COT Report: The COT data, released weekly to the public each Friday, is updated through the most recent Tuesday (data is 3 days old) and shows a quick view of how large speculators or non-commercials (for-profit traders) as well as the commercial traders (hedgers & traders for business purposes) were positioned in the futures markets. The CFTC categorizes trader positions according to commercial hedgers (traders who use futures contracts for hedging as part of the business), non-commercials (large traders who speculate to realize trading profits) and nonreportable traders (usually small traders/speculators). Find CFTC criteria here: (http://www.cftc.gov/MarketReports/CommitmentsofTraders/ExplanatoryNotes/index.htm).
US Dollar net speculator positions leveled at $-9.4 billion as of Tuesday
The latest data for the weekly Commitment of Traders (COT) report, released by the Commodity Futures Trading Commission (CFTC) on Friday, showed that large traders and currency speculators added to their bearish bets for the US dollar this week after reducing their bearishness the week before. See full article
The non-commercial contracts of WTI crude futures totaled a net position of 445,448 contracts, according to data from last week. This was a slide of -18,025 contracts from the previous weekly total. See full article
The large speculator contracts of gold futures totaled a net position of 208,438 contracts. This was a weekly advance of 20,704 contracts from the previous week. See full article
The large speculator contracts of 10-year treasury note futures totaled a net position of 261,245 contracts. This was a weekly increase of 60,653 contracts from the previous week. See full article
The large speculator contracts of S&P 500 futures totaled a net position of -3,469 contracts. This was a decrease of -1,557 contracts from the reported data of the previous week. See full article
The non-commercial contracts of silver futures totaled a net position of 44,546 contracts, according to data from last week. This was a weekly gain of 5,695 contracts from the previous totals. See full article
The large speculator contracts of copper futures totaled a net position of 40,846 contracts. This was a weekly boost of 4,017 contracts from the data of the previous week. See full article
The Commitment of Traders report data is published in raw form every Friday by the Commodity Futures Trading Commission (CFTC) and shows the futures positions of market participants as of the previous Tuesday (data is reported 3 days behind).
US Dollar net speculator positions fell to $-9.4 billion last week
The latest data for the weekly Commitment of Traders (COT) report, released by the Commodity Futures Trading Commission (CFTC) on Friday, showed that large traders and currency speculators added to their bearish bets for the US dollar this week after reducing their bearishness the week before.
Non-commercial large futures traders, including hedge funds and large speculators, had an overall US dollar position totaling $-9.4 billion as of Tuesday August 22nd, according to the latest data from the CFTC and dollar amount calculations by Reuters. This was a weekly decline of $-0.56 billion from the $-8.84 billion total position that was registered the previous week, according to the Reuters calculation (totals of the US dollar contracts against the combined contracts of the euro, British pound, Japanese yen, Australian dollar, Canadian dollar and the Swiss franc).
US dollar bets has fallen eight out of the past nine weeks and are now at the second most bearish level since turning over from an overall long position to a short position on July 18th. The US dollar has remained in a short position for a six consecutive weeks.
Weekly Speculator Contract Changes:
The individual major currencies saw only one weekly change above the (+ or -) 10,000 contract mark this week in the speculators category.
British pound sterling bets fell by over -14,000 contracts this week and have declined for two consecutive weeks as well as four out of the past five weeks. The GBP speculator standing is now at the most bearish point since May 9th when net positions totaled -46,798 contracts.
The major currencies that improved against the US dollar last week were the euro (8,709 weekly change in contracts), Japanese yen (3,406 contracts), Australian dollar (872 contracts) and the Mexican peso (2,769 contracts).
The currencies whose speculative bets declined last week versus the dollar were the British pound sterling (-14,040 weekly change in contracts), Swiss franc (-806 contracts), Canadian dollar (-250 contracts) and the New Zealand dollar (-2,957 contracts).
Table of Weekly Commercial Traders and Speculators Levels & Changes:
Currency
Net Commercials
Comms Weekly Chg
Net Speculators
Specs Weekly Chg
EuroFx
-114,526
-10,157
87,976
8,709
GBP
44,993
11,718
-45,900
-14,040
JPY
82,791
-6,382
-74,086
3,406
CHF
4,738
366
-1,987
-806
CAD
-66,306
2,803
51,099
-250
AUD
-75,872
1,593
60,484
872
NZD
-24,620
2,965
21,882
-2,957
MXN
-103,872
-3,299
97,618
2,769
This latest COT data is through Tuesday and shows a quick view of how large speculators or non-commercials (for-profit traders) as well as the commercial traders (hedgers & traders for business purposes) were positioned in the futures markets. All currency positions are in direct relation to the US dollar where, for example, a bet for the euro is a bet that the euro will rise versus the dollar while a bet against the euro will be a bet that the dollar will gain versus the euro.
Weekly Charts: Large Trader Weekly Positions vs Price
EuroFX:
British Pound Sterling:
Japanese Yen:
Swiss Franc:
Canadian Dollar:
Australian Dollar:
New Zealand Dollar:
Mexican Peso:
*COT Report: The weekly commitment of traders report summarizes the total trader positions for open contracts in the futures trading markets. The CFTC categorizes trader positions according to commercial hedgers (traders who use futures contracts for hedging as part of the business), non-commercials (large traders who speculate to realize trading profits) and nonreportable traders (usually small traders/speculators). Find CFTC criteria here: (http://www.cftc.gov/MarketReports/CommitmentsofTraders/ExplanatoryNotes/index.htm).
The Commitment of Traders report is published every Friday by the Commodity Futures Trading Commission (CFTC) and shows futures positions data that was reported as of the previous Tuesday (3 days behind).
Each currency contract is a quote for that currency directly against the U.S. dollar, a net short amount of contracts means that more speculators are betting that currency to fall against the dollar and a net long position expect that currency to rise versus the dollar.
(The charts overlay the forex closing price of each Tuesday when COT trader positions are reported for each corresponding spot currency pair.) See more information and explanation on the weekly COT report from the CFTC website.
Large commodity speculators cut back on their bullish net positions in the WTI Crude Oil futures markets this week, according to the latest Commitment of Traders (COT) data released by the Commodity Futures Trading Commission (CFTC) on Friday.
The non-commercial futures contracts of WTI Crude Oil futures, traded by large speculators and hedge funds, totaled a net position of 445,448 contracts in the data reported through Tuesday August 22nd. This was a weekly fall of -18,025 contracts from the previous week which had a total of 463,473 net contracts.
WTI crude speculators have now reduced their bullish bets for three straight weeks (total of -41,317 contracts) although the overall net position level remains above the +400,000 threshold for a fifth consecutive week.
WTI Crude Oil Commercial Positions:
The commercial traders position, categorized by the CFTC as hedgers or traders engaged in buying and selling for business purposes, totaled a net position of -455,866 contracts on the week. This was a weekly advance of 17,633 contracts from the total net of -473,499 contracts reported the previous week.
USO:
Over the same weekly reporting time-frame, from Tuesday to Tuesday, the USO Crude Oil ETF, which tracks the price of WTI crude oil, closed at approximately $9.77 which was a small rise of $0.02 from the previous close of $9.75, according to unofficial market data.
*COT Report: The COT data, released weekly to the public each Friday, is updated through the most recent Tuesday (data is 3 days old) and shows a quick view of how large speculators or non-commercials (for-profit traders) as well as the commercial traders (hedgers & traders for business purposes) were positioned in the futures markets. The CFTC categorizes trader positions according to commercial hedgers (traders who use futures contracts for hedging as part of the business), non-commercials (large traders who speculate to realize trading profits) and nonreportable traders (usually small traders/speculators). Find CFTC criteria here: (http://www.cftc.gov/MarketReports/CommitmentsofTraders/ExplanatoryNotes/index.htm).
Large bond speculators sharply raised their bullish net positions in the 10-Year Note futures markets this week, according to the latest Commitment of Traders (COT) data released by the Commodity Futures Trading Commission (CFTC) on Friday.
The non-commercial futures contracts of 10-Year Note futures, traded by large speculators and hedge funds, totaled a net position of 261,245 contracts in the data reported through Tuesday August 15th. This was a weekly increase of 60,653 contracts from the previous week which had a total of 200,592 net contracts.
The 10-Year Note speculative positions had fallen for three out of the past four weeks before this week’s rebound which brought the net standing to its highest level in four weeks.
10-Year Note Commercial Positions:
Meanwhile, the commercial traders position, categorized by the CFTC as hedgers or traders engaged in buying and selling for business purposes, totaled a net position of -80,303 contracts on the week. This was a weekly decrease of -30,358 contracts from the total net of -49,945 contracts reported the previous week.
IEF ETF:
Over the same weekly reporting time-frame, from Tuesday to Tuesday, the 7-10 Year Treasury Bond ETF (IEF) closed at approximately $107.43 which was a rise of $0.46 from the previous close of $106.97, according to unofficial market data.
*COT Report: The COT data, released weekly to the public each Friday, is updated through the most recent Tuesday (data is 3 days old) and shows a quick view of how large speculators or non-commercials (for-profit traders) as well as the commercial traders (hedgers & traders for business purposes) were positioned in the futures markets. The CFTC categorizes trader positions according to commercial hedgers (traders who use futures contracts for hedging as part of the business), non-commercials (large traders who speculate to realize trading profits) and nonreportable traders (usually small traders/speculators). Find CFTC criteria here: (http://www.cftc.gov/MarketReports/CommitmentsofTraders/ExplanatoryNotes/index.htm).
Large speculators once again pushed their bullish net positions higher in the Gold futures markets this week, according to the latest Commitment of Traders (COT) data released by the Commodity Futures Trading Commission (CFTC) on Friday.
The non-commercial futures contracts of Gold futures, traded by large speculators and hedge funds, totaled a net position of 208,438 contracts in the data reported through Tuesday August 22nd. This was a weekly advance of 20,704 contracts from the previous week which had a total of 187,734 net contracts.
Gold speculative positions have risen for five straight weeks and by +148,300 net contracts in that time frame which brings the total net level over the +200,000 contract mark for the first time since April 25th.
Gold Commercial Positions:
The commercial traders position, categorized by the CFTC as hedgers or traders engaged in buying and selling for business purposes, totaled a net position of -219,918 contracts on the week. This was a weekly decrease of -23,287 contracts from the total net of -196,631 contracts reported the previous week.
GLD ETF:
Over the same weekly reporting time-frame, from Tuesday to Tuesday, the GLD ETF, which tracks the price of gold, closed at approximately $122.21 which was an increase of $1.23 from the previous close of $120.98, according to unofficial market data.
*COT Report: The COT data, released weekly to the public each Friday, is updated through the most recent Tuesday (data is 3 days old) and shows a quick view of how large speculators or non-commercials (for-profit traders) as well as the commercial traders (hedgers & traders for business purposes) were positioned in the futures markets. The CFTC categorizes trader positions according to commercial hedgers (traders who use futures contracts for hedging as part of the business), non-commercials (large traders who speculate to realize trading profits) and nonreportable traders (usually small traders/speculators). Find CFTC criteria here: (http://www.cftc.gov/MarketReports/CommitmentsofTraders/ExplanatoryNotes/index.htm).