Author Archive for InvestMacro – Page 511

Fibonacci Retracements Analysis 31.08.2017 (EUR/USD, USD/JPY)

Article By RoboForex.com

EUR USD, “Euro vs US Dollar”

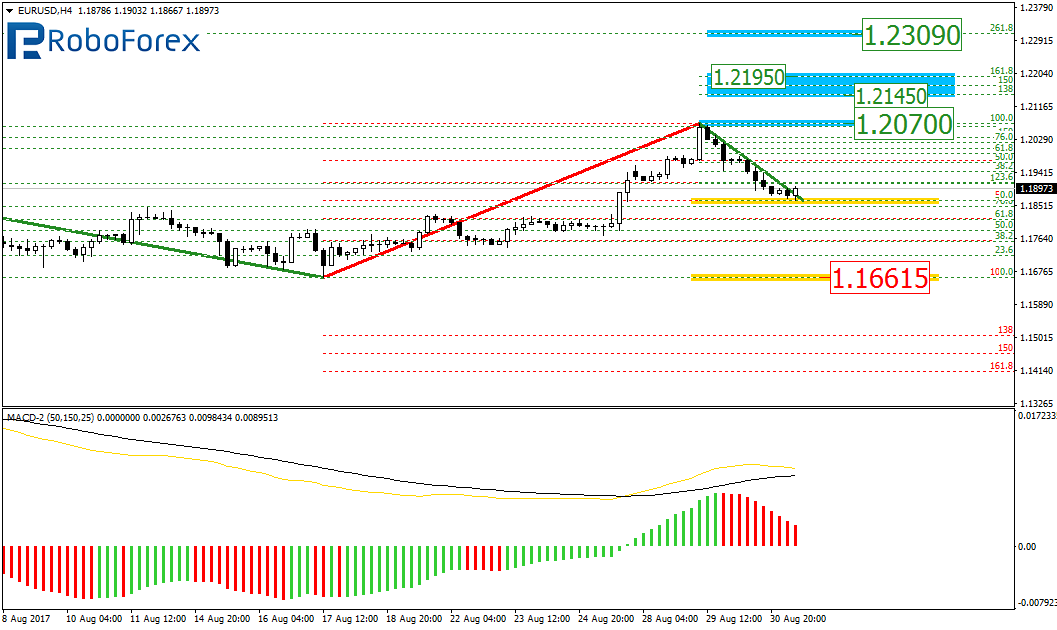
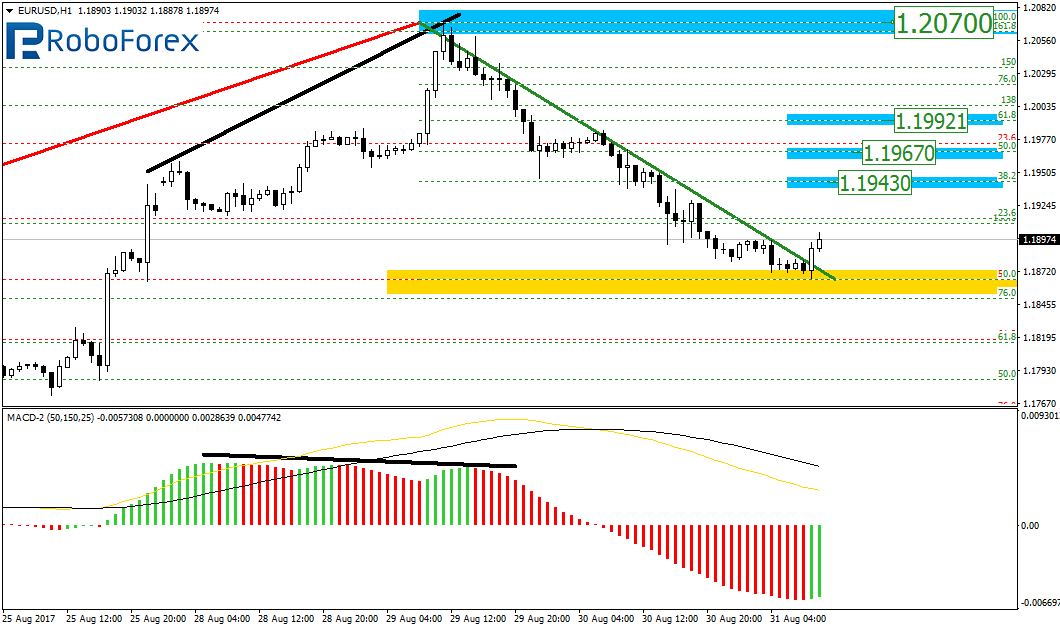
As we can see at the H4 chart, the EUR/USD pair is still being corrected to the downside. The correction has already reached the retracement of 50.0%. after finishing this correction, the price is expected to resume the mid-term uptrend. The closest upside target is the local high at 1.2070. After breaking this level, the instrument may continue moving towards the post-correctional extension area between the retracements of 138.2% and 161.8% at 1.2145 and 1.2195 respectively.
At the H1 chart, the pair has completed another descending movement and started forming a new correction or a reverse. The closest targets of this movement are the retracement of 38.2%, 50.0%, and 61.8% at 1.1943, 1.1967, and 1.1992 respectively.
 

USD JPY, “US Dollar vs. Japanese Yen”

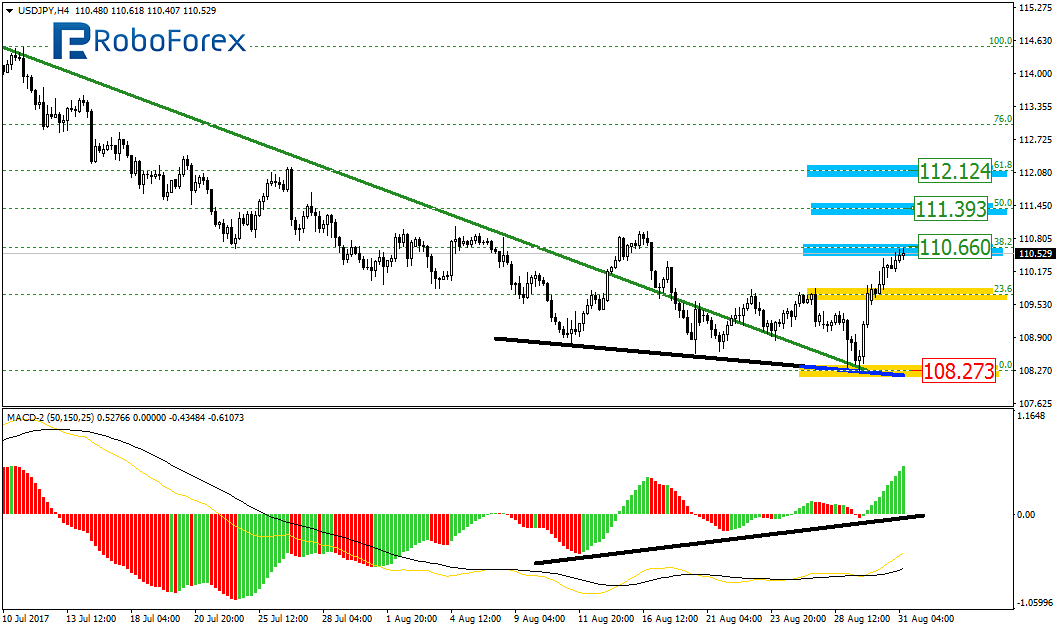
As we can see at the H4 chart, the USD/JPY pair has completed the convergence and right now is moving upwards. The targets of this movement are the retracements of 38.2%, 50.0%, and 76.0% at 110.66, 111.39, and 112.12 respectively. The support level in this case is at 108.27.
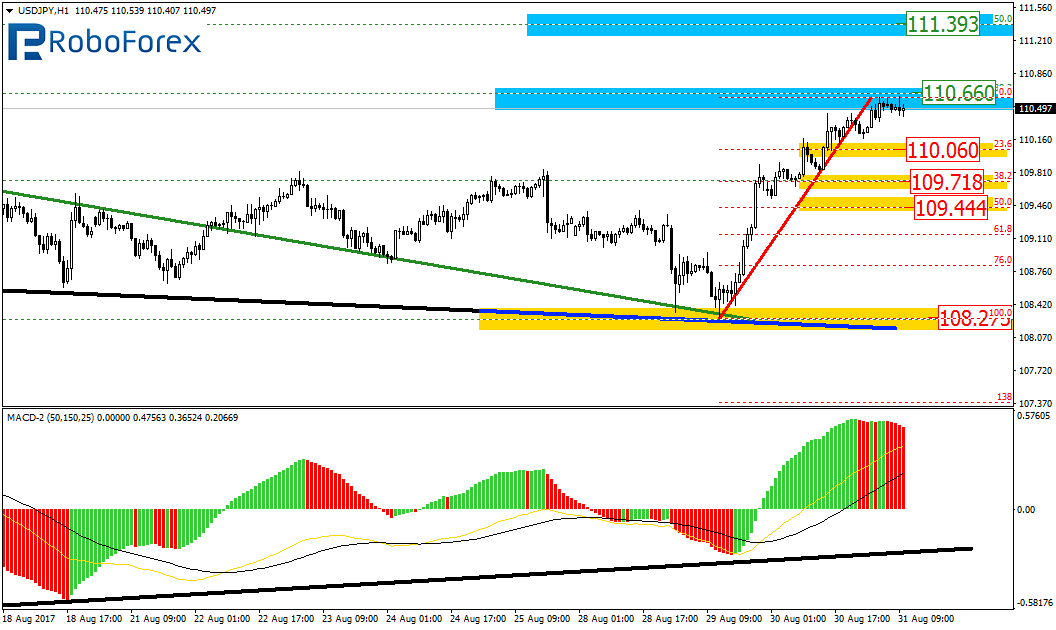
At the H1 chart, the situation is similar, but shows more detailed structure. In the nearest future, the price may be corrected to the downside to reach the retracement of 23.6%, 38.2%, and 50.0% at 110.06, 109.71, and 109.44 respectively.
 

RoboForex Analytical Department

Article By RoboForex.com

Attention!
Forecasts presented in this section only reflect the author’s private opinion and should not be considered as guidance for trading. RoboForex LP bears no responsibility for trading results based on trading recommendations described in these analytical reviews.

EURUSD: closing of long positions may gather pace

By Gabriel Ojimadu, Alpari

Previous:

On Wednesday the 30th of August, trading on the euro/dollar closed down. Despite aggressive rhetoric from Pyongyang, tensions surrounding North Korea seem to have subsided. The UN Security Council labelled their missile launch as a threat to global security, but fell short of proposing any new sanctions. Investors have accordingly started to move away from safe haven assets (bonds, the Swiss franc, yen, and gold), which has bolstered the US dollar. Later, the US dollar surge gathered momentum after a favourable ADP jobs report and revised GDP data were released. The euro fell 103 pips from 1.1984 to 1.1881.

The statistics from Automatic Data Processing showed an increase in employment of 237,000 (forecast: 185,000) on the previous month, whose value was revised upwards from 178,000 to 201,000.

The GDP index for the second quarter was revised upwards to 3% YoY. The corresponding figure for the first quarter was 1.2% YoY. The inflationary components of the GDP index remain at relatively low levels.

Day’s news (GMT+3):

  • 09:00 Germany: retail sales (Jul).
  • 10:25 UK: MPC member Saunders’ speech.
  • 10:55 Germany: unemployment change (Aug), unemployment rate (Aug).
  • 12:00 Eurozone: CPI prelim (Aug), CPI core prelim (Aug), unemployment rate (Jul).
  • 14:30 USA: Challenger job cuts (Aug).
  • 15:30 Canada: GDP (Jun).
  • 15:30 USA: initial jobless claims (25 Aug), core personal consumption expenditure price index (Jul), personal spending (Jul), personal income (Jul).
  • 16:45 USA: Chicago PMI (Aug).
  • 17:00 USA: pending home sales (Jul).

EURUSD rate on the hourly. Source: TradingView

This is what it is to overestimate geopolitical risks. No good comes from it, except for an increase in volatility, which is like oxygen for traders.

From its high of 1.2070, the euro has since fallen by 1.6%, or 199 pips. The correction amounted to 157 degrees. It’s not a crucial support level, so I’m expecting the euro to continue its slide until the 180th degree. As the price approaches this mark, we should keep an eye on trading volume. Prices are falling at a decent pace, so if we don’t see a major buyer appear around the trend line, prepare for the euro to drop to around 1.1800.

President Trump and … the Yield Curve?

By Elliott Wave International

This chart offers a completely different take on the question of why President Trump’s approval is falling.


3 Videos + 8 Charts = Opportunities You Need to See.

Join this free event hosted by Elliott Wave International and you’ll get a clear picture of what’s next in a variety of U.S. markets. After seeing this videos and charts you will be ready to jump on opportunities and sidestep risks in some major markets. This free report (a $29 value) will present a unique outlook and give you a new perspective on the markets you won’t get anywhere else.

Get your FREE report now — for a limited time.

This article was syndicated by Elliott Wave International and was originally published under the headline President Trump and … the Yield Curve?. EWI is the world’s largest market forecasting firm. Its staff of full-time analysts led by Chartered Market Technician Robert Prechter provides 24-hour-a-day market analysis to institutional and private investors around the world.

Murrey Math Lines 30.08.2017 (USD/CAD, GOLD)

Article By RoboForex.com

USD CAD, “US Dollar vs Canadian Dollar”

As we can see at the H4 chart, the USD/CAD pair has left the consolidation channel formed by the 3/8 and 5/8 levels. Later, the price is expected to test the 3/8 level at 1.2573 and then continue falling towards the 0/8 one at 1.2207. If the pair breaks the 3/8 levels, the instrument may resume growing to reach the next target at the 5/8 one at 1.2817.

At the H1 chart, the pair is expected to reach the 4/8 level at 1.2573. If the price rebounds from this level, the instrument may resume falling towards 1.2207. Otherwise, it may continue growing to reach 1.2817.


XAU USD, “Gold vs US Dollar”

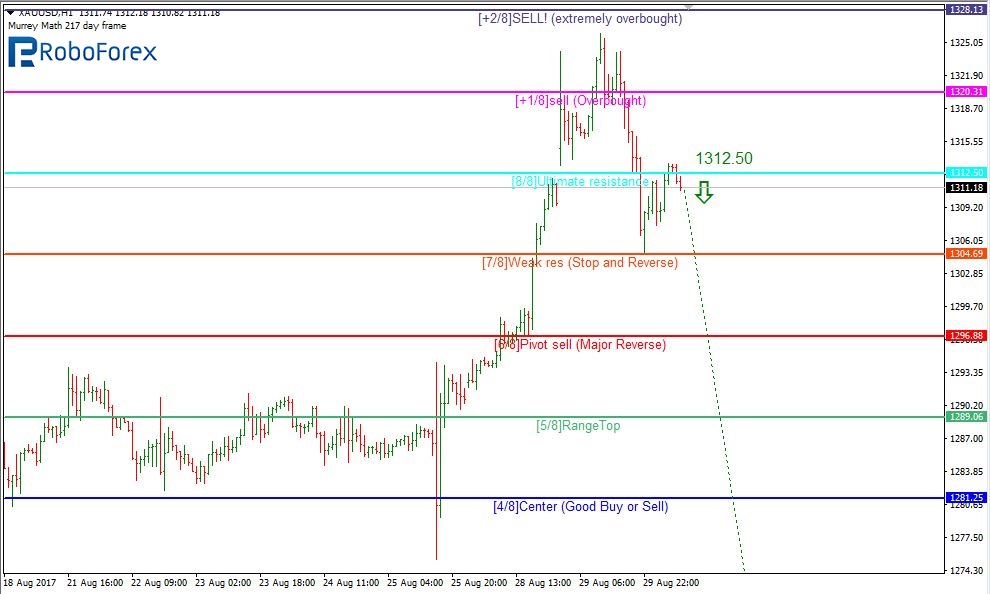
As we can see at the H4 chart, the XAU/USD pair has broken the 8/8 level at 1312.50, just as expected. Later, the price may fall towards the 5/8 level at 1265.63.

At the H1 chart, the price has also broken the 8/8 level at 1312.50 and confirms the H4 chart scenario.

As we can see at the M15 chart, the price has broken the downside line of the VoltyChannel indicator and, as a result, may continue moving downwards.


RoboForex Analytical Department

Article By RoboForex.com

Attention!
Forecasts presented in this section only reflect the author’s private opinion and should not be considered as guidance for trading. RoboForex LP bears no responsibility for trading results based on trading recommendations described in these analytical reviews.

Forex Technical Analysis & Forecast 30.08.2017 (EUR/USD, GBP/USD, USD/CHF, USD/JPY, AUD/USD, USD/RUB, GOLD, BRENT)

Article By RoboForex.com

EUR USD, “Euro vs US Dollar”

The EUR/USD pair is moving downwards. We think, today the price may test 1.2000 from below and then fall towards the first target at 1.1851. After that, the instrument may continue falling inside the downtrend to 1.1430.


GBP USD, “Great Britain Pound vs US Dollar”

The GBP/USD pair is falling. Possibly, the price may reach 1.2873. Later, in our opinion, the market may be corrected towards 1.2919 and then form the fifth descending structure with the target at 1.2672.


USD CHF, “US Dollar vs Swiss Franc”

The USD/CHF pair is moving upwards. Possibly, today the price may be corrected towards 0.9500 and then resume growing inside the uptrend with the target at 0.9640.


USD JPY, “US Dollar vs Japanese Yen”

The USD/JPY pair has returned to the upside border of its consolidation range. Possibly, the price may grow to reach 110.47. Later, in our opinion, the market may continue falling towards 107.00.


AUD USD, “Australian Dollar vs US Dollar”

The AUD/USD pair has reached its upside target and completed the correction. We think, today the price may move downwards to reach the first target at 0.7925, break it, and then continue falling inside the downtrend towards 0.7755.


USD RUB, “US Dollar vs Russian Ruble”

The USD/RUB pair is still being corrected to the upside with the target at 58.91. After that, the instrument may fall towards 58.23.


XAU USD, “Gold vs US Dollar”

Gold is forming the first descending structure. Possibly, the price may reach 1300. Later, in our opinion, the market may grow towards 1313 and then resume falling inside the downtrend with the target at 1258.


BRENT

Brent is still consolidating around 51.80. If later the instrument breaks this channel to the downside, the market may continue the current correction towards 50.80; if to the upside – grow to reach 54.10. After that, the instrument may move upwards with the target at 55.15.


RoboForex Analytical Department

Article By RoboForex.com

Attention!
Forecasts presented in this section only reflect the author’s private opinion and should not be considered as guidance for trading. RoboForex LP bears no responsibility for trading results based on trading recommendations described in these analytical reviews.

EURUSD: buyers closing their long positions

By Gabriel Ojimadu, Alpari

Previous:

Geopolitical tensions in the Korean Peninsula have generated increased interest in safe haven assets among European investors; most notably the Swiss franc, Japanese yen, and gold. During yesterday’s European session, the euro/dollar pair reached the 1.2070 mark, its highest level since January 2015.

The safe haven rally was halted in the US session. By the end of the day, exchange rates had returned to their opening levels in the Asian session. Pressure on investors subsided as US president Donald Trump gave a more measured response to North Korea’s provocation, without resorting to threats. Trump is currently more focused on rebuilding the areas devastated by Hurricane Harvey.

The US proposed a statement to the other members of the UN Security Council condemning North Korea’s missile test on Tuesday. The statement, approved by the UN, calls on North Korea to halt its nuclear program and to refrain from any future missile tests or other such provocations. The statement contains no threats of further sanctions relating to this matter.

The situation on the Korean Peninsula remains tense, but the rhetoric from the US seems to have calmed investors, who have started abandoning the safe havens. The greenback received an additional boost from a strong US consumer confidence index, which hit a new 5-month high.

US 10Y bond yields fell to 2.08% before correcting to 2.14% by the end of the day. The euro/dollar pair fell by 123 pips to 1.1943. Now we’ll take a look at what kind of impact the missile launch and investor activity have had on the hourly chart.

Day’s news (GMT+3):

  • 09:00 Switzerland: UBS consumption indicator (Jul).
  • 10:00 Switzerland: KOF leading indicator (Aug).
  • 11:30 UK: net lending to individuals (Jul), M4 money supply (Jul), mortgage approvals (Jul).
  • 15:00 Germany:  preliminary CPI (Aug).
  • 15:15 USA: ADP employment change (Aug).
  • 15:30 Canada: current account (Q2).
  • 15:30 USA: GDP annualised (Q2), GDP price index (Q2).
  • 16:15 USA: FOMC member Powell’s speech.
  • 17:30 USA: EIA crude oil stocks change (25 Aug).

EURUSD rate on the hourly. Source: TradingView

The price broke through the U3 line before correcting to the LB balance line. I was expecting the euro to drop like this after reaching 1.20 through three tops. I’m not sure what caused European investors to turn tail and run towards safe haven assets. Asia’s reaction to the North Korean missile launch was much calmer.

North Korea’s supreme leader noted that this missile launch was the first step towards military action in the Pacific Ocean and was an important prelude to an attack on the US territory of Guam. This raises the question of why investors are already abandoning safe havens when the threats from North Korea persist. What’s their reasoning for this?

So, we should bear the Korean situation in mind as we keep an eye on the dynamics of safe haven assets. A candlestick with a long wick has formed on the daily timeframe. If sellers reach their target, the euro should fall to 1.1850 (D3 MA line). 1.1850 is the level to keep your sights on, but we can also take 1.1930 and 1.1890 as intermediate targets. The euro/pound cross is breaking through the trend line, so keep an eye on this pair. If the drop gathers pace, the euro should also fall against the dollar. In this case, sellers won’t even take notice of the 112th degree.

Ichimoku Cloud Analysis 29.08.2017 (AUD/USD, NZD/USD, USD/CAD)

Article By RoboForex.com

AUD USD, “Australian Dollar vs US Dollar”

The AUD/USD pair is trading at 0.7939; the instrument is still moving above Ichimoku Cloud, which means that it may continue growing. We should expect the price to test the upside border of the cloud at 0.7910 and then continue moving upwards above 0.8030. However, this scenario may be cancelled if the price breaks the downside border of the cloud and fixes below 0.7875. In this case, the pair may continue falling towards 0.7790.


NZD/USD, “New Zealand Dollar vs US Dollar”

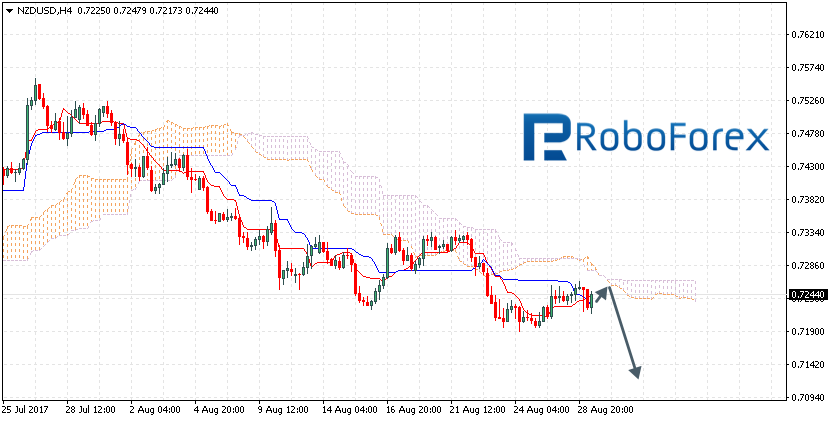
The NZD/USD pair is trading at 0.7244; the instrument is still moving below Ichimoku Cloud, which means that it may continue falling. We should expect the price to test the downside border of the cloud at 0.7250 and then continue moving downwards to reach 0.7115. However, the scenario that implies further decline may be cancelled if the price breaks the upside border of the cloud and fixes above 0.7265. In this case, the pair may continue growing towards 0.7340.


USD/CAD, “US Dollar vs Canadian Dollar”

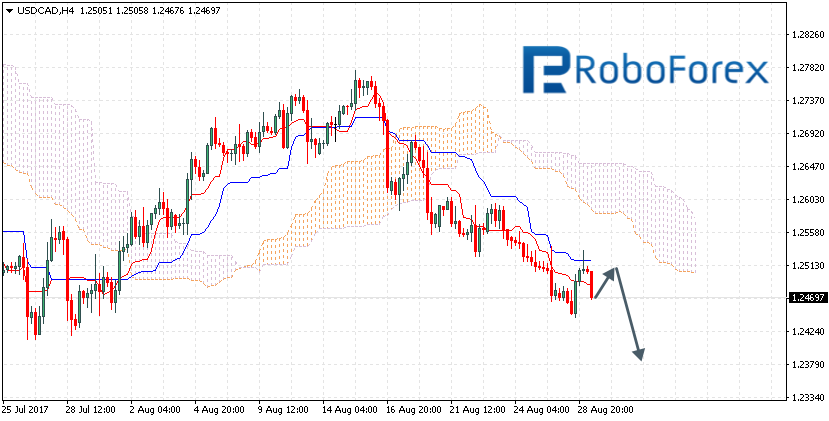
The USD/CAD pair is trading at 1.2469; the instrument is still moving below Ichimoku Cloud, which means that it may continue falling. We should expect the price to test Tenkan-Sen and Kijun-Sen at 1.2515 and then continue moving downwards below 1.2380. However, this scenario may be cancelled if the price breaks the upside border of the cloud and fixes above 1.2610. In this case, the pair may continue growing towards 1.2720.


RoboForex Analytical Department

Article By RoboForex.com

Attention!
Forecasts presented in this section only reflect the author’s private opinion and should not be considered as guidance for trading. RoboForex LP bears no responsibility for trading results based on trading recommendations described in these analytical reviews.
Japanese Candlesticks Analysis 29.08.2017 (USD/CAD, NZD/USD)

Article By RoboForex.com

USD CAD, “US Dollar vs Canadian Dollar”

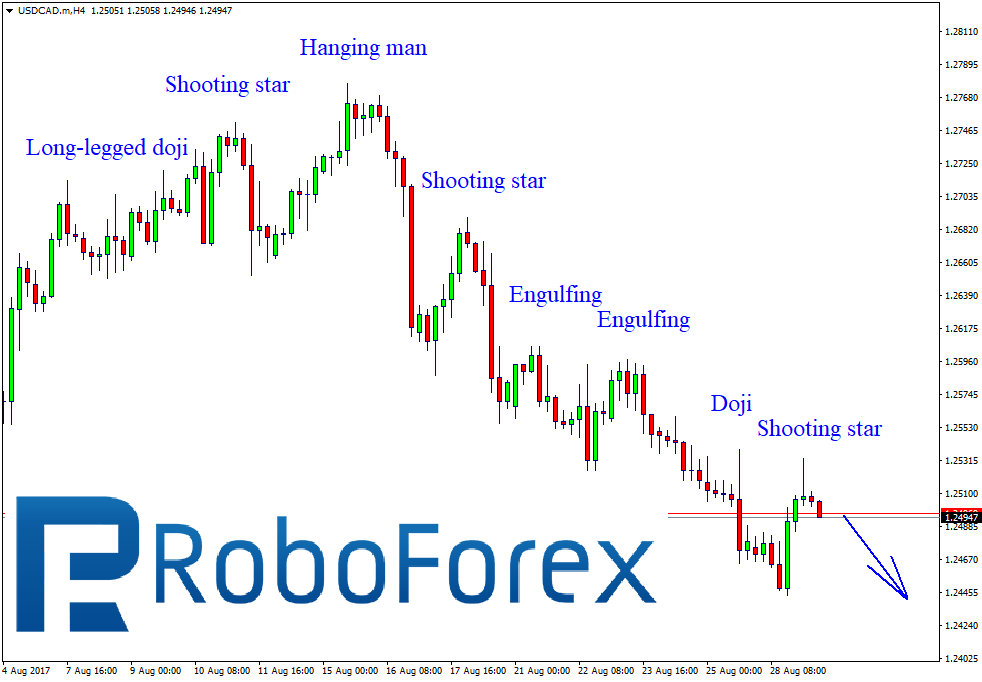
The Canadian Dollar continues strengthening against the USD. As we can see at the H4 chart, after forming Hanging Man, Shooting Star, Engulfing, and Doji patterns, the pair reached the support level. The price rebounded from it and formed another Shooting Star pattern. The closest downside target is at 1.24444; the next one is at 1.24131.


NZD USD, “New Zealand Dollar vs. US Dollar”

As we can see at the H4 chart of NZD USD, the price is still falling and forming Engulfing, Shooting Star, and Long-Legged Doji reversal patterns during pullbacks. After breaking the support level, the pair formed another correction with Shooting Star pattern at the top of it. If the price continues falling, the instrument will break the support level and reach a new low.


RoboForex Analytical Department

Article By RoboForex.com

Attention!
Forecasts presented in this section only reflect the author’s private opinion and should not be considered as guidance for trading. RoboForex LP bears no responsibility for trading results based on trading recommendations described in these analytical reviews.

EURUSD: triple top model nearing completion

By Gabriel Ojimadu, Alpari

Previous:

On Monday, the 29th of August, trading on the euro closed up. Buyers didn’t manage to reach 1.20, but renewed the Asian high from 1.1960 to 1.1986. Markets continue to feed off Janet Yellen’s and Mario Draghi’s speeches at Jackson Hole while the media is playing up Hurricane Harvey, saying that it is having a negative effect on the US economy. US 10Y bond yields have fallen to 2.11%.

Day’s news (GMT+3):

  • 09:00 Germany: Gfk consumer confidence survey.
  • 09:00 UK: Nationwide housing prices (Aug).
  • 15:30 Canada: raw material price index (Jul), industrial product price (Jul).
  • 16:00 USA: S&P/Case-Shiller home price indices (Jun).

EURUSD exchange rate on the hourly. Source: TradingView

My predictions for Monday didn’t work out. It seems that the market is playing out the alternate scenario of a triple top model. The U3 MA line held buyers up at 1.1984. After reaching a new high, the euro corrected to 1.1956, after which the price restored to 1.1979 over the course of the following 6 hours.

On the current hour, the U3 MA line runs through the 1.2022 mark. If we take a projection of the previous two tops, the target for our third is 1.2003. I’ve set the target for this slightly lower, because the Stochastic is now up, and the 202nd degree runs through 1.1990 level. A bearish divergence has formed between the price and the second top. With the three tops, a double divergence is forming.

One other factor that’s caused me to predict a slide is that the cycles on the hourly timeframe are showing a downwards trend. The euro tends to strengthen against the cycles, meaning that the longer this resistance holds, the greater the fall will be.

I reckon that it would be good for the euro/dollar pair to unload to the LB balance line. On the current bar, this line is at 1.1900. If we look at the dynamics, we should see it run through 1.1931 level during the US session. If we see growth, and the hour closes above 1.20, a different scenario will most likely play out.

Short-term trading idea FX EURAUD – bull speculation: expecting a breakout of the 1-1 channel

By Gabriel Ojimadu, Alpari

Trading opportunities on the currency pair: The euro has been provided with support by Draghi’s and Yellen’s speeches. In this idea, we’re looking at a breakout of the 1-1 channel at 1.5070 with subsequent growth to 1.5250. It’s worth betting on a rise should the price get a foothold above 1.5070. If the price exits the 3-3 channel downwards and trader sentiment switches from bullish to bearish, this scenario will not play out.

Background:

The previous idea on this currency pair was published on the 29th of May this year, when the Aussie dollar was trading at 1.5010. Bearish signals had formed on the daily and weekly timeframes, so I was expecting a downwards correction. I forecasted correctional movement towards the TR4 trend line at 1.4450 (I picked the wrong minimum value in this review). 1.4690 provided an intermediate target. The daily pin bar formation stopped after the third day. The correction started from the upper boundary of the 1-1 channel at 1.5227. During the first downwards wave, the price reached 1.4690, and hit 1.4450 on the second. I think that my idea didn’t work out due to the price divergence at the top.

Fig 1. Weekly chart.

The original TR4 trend line was broken through at 1.4577. After the price restored to above 1.4600, this line corrected to 1.4418. The single currency closed up against the Australian dollar last week. The highest growth on the pair was seen on Friday, the 25th of August. The euro rose across the market after speeches at Jackson Hole from Fed head Janet Yellen and the ECB’s Mario Draghi. Draghi didn’t say anything about current monetary policy. The euro’s growth before trading closed may be down to the fact that Draghi was silent on that very subject. Market participants took it to mean that the current exchange rate was not a problem for the European regulator.

The euro rate has returned to the upper boundary of the 1-1 channel. So long as optimism is the prevailing sentiment on the market regarding the euro since Draghi’s speech, and the bullish phase continues through the 1st of September this year, there is every chance the 1.5070 resistance will have its strength tested. If the price exits the 1-1 channel upwards and this growth gathers pace, we can expect the euro to rise to 1.5250. If buyers continue to strengthen their positions, there will be a high chance of the rise continuing as far as 1.5515.

Fig 2. Daily chart.

There are more detailed markings on the daily chart. The price is trading within the upwards 3-3 channel. If buyers are active this week and manage to get a foothold above 1.5070, we could see the price reach 1.5250.

If buyers fix the price above 1.5070, it’ll be worthwhile opening some long positions. If the price exits the 3-3 channel downwards, and the sentiment among traders changes from bullish to bearish, this scenario will not play out.