Author Archive for InvestMacro – Page 514

The Next Oil Price Spike May Cripple The Industry

By OilPrice.com

Two diametrically opposed views dominate the current debate about where the oil price is heading. On the one hand, there is the view that the price of oil will be “lower for longer“, or even “lower forever“, as the electrification of transport will eat away at oil demand more and more while, at the same time, technological innovation (shale in particular) will greatly increase economically recoverable resources. On the other hand, however, there is the view that the price of oil is set to explode, primarily due to underinvestment in the upkeep of brownfieldsdevelopment of greenfields, and exploration for new resources.

Our view is that most likely, both will happen. How it is possible for the price of oil to go both up and not up, and what would that mean for the oil industry? We will explain.

Why the price of oil actually isn’t that low

Contrary to general perception, the current price of oil is not very low. In fact, at a little over $50 per barrel, oil is trading slightly higher than its historic, inflation adjusted average of $47 per barrel, which in and off itself calls into the question the “spike” view: If the period 2001 – 2014 was a clear historic abnormality, why should one expect the price to return those levels?

Furthermore, we agree with the people in the lower for longer / forever camp that electric vehicles (EVs) will eventually offer better overall value to consumers than internal combustion engine vehicles (ICEVs) can, and that this will have a big impact on oil demand. (In fact, we have been highlighting this threat to the energy industry in articles since 2015, for example hereherehere and here.) However, two important things need to be considered in this regard.

The first is that at present EVs do not yet outperform ICEVs comprehensively. While they offer a smoother ride, more passenger and storage space per square foot, and less noise and environmental pollution at a lower “cost of operation” (fuel and maintenance), in terms of “cost of ownership” EVs can yet compete with ICEVs. Excluding subsidies the difference is said to be about $16,000 in the US, $18,500 in Germany and $13,200 in France, despite Tesla and GM reportedly selling their main EV models at a loss.

The second is that under the best of circumstances it will take the EV industry close to another decade to close this cost of ownership gap. (Why it is not a given that this will be achieved we explained here.)

Based on this, our assessment is that the electrification of transport will only slow down oil demand growth during the 2020s. It is after that, during the 2030s and 2040s, that the oil industry should expect to experience the really painful impacts.

Why the price of oil could spike before that

That leaves the period until the end of the 2020s, during which we believe overall oil demand will continue to grow (albeit slower than before).

Supply forecasts developed on this basis hold that more 20 million barrels per day of new production will need to be brought on stream until 2026 for natural production declines and demand growth to be properly addressed. According to WoodMackenzie, only half that quantity can be delivered by projects that are currently underway.

The other half will need to come from still-to-be-launched projects (Pre-FID). But, WoodMackenzie says, many of these still-to-be-launched projects are uneconomical at oil prices in the $50s per barrel, meaning that they should not be expected to get the all-clear anytime soon. Since (non-U.S. shale) oilfield development projects can easily require 5 to 8 years to be completed, all this means that the seeds for a supply crunch in the period 2020 – 2022 are currently being sowed.

Of course, a number of things could happen that would prevent such an oil supply crunch, and thus an oil price spike. For example, oil demand growth could turn out to be less than expected at present, as energy demand growth already disappointed in 2014, 2015 and 2016 and could well disappoint again in 2017. On the supply side, BP and Statoil have also proven that project re-engineering can slash substantial amounts of off greenfield development costs, as a consequence of which more projects could end up receiving the go-ahead than presently is held possible.

But again, other “risks” such as the U.S. shale “growth over profits” mindset coming to an end, support the oil price spike theory, which leads us to conclude that in all, a tightening of the global oil market is indeed the most realistic expectation for the near future.

Why an oil price spike would be bad for the industry

If indeed the price of oil were to break through $60 per barrel again during 2018, and spike in the years thereafter ($80 per barrel? $100 perhaps?), the “cost of operation” benefit of EVs would be strengthened further, closing (at least part of) the ICEV advantage in “cost of ownership”. In other words, an oil price spike would speed up the electrification of transportation, in particular in the Passenger Vehicle segment, as a consequence of which oil demand would peak earlier – not towards the end of the 2020s but perhaps during the middle of the 2020s already.

Those with an interest in a long term future for the oil industry, such as the nations that own most of the oil still in the ground, therefore have an interest in preventing the oil price from going up too much. (Which in a way is ironic, since many of them are the ones working the hardest to push up the price.)

For a future oil price spike would not indicate a sign of recovery of the oil industry. It would more of a “last gasp” by the industry, establishing not much more than a last opportunity for those who do not own the lowest cost resources to offload their oil related assets for a favorable price.

Link to original article: http://oilprice.com/Energy/Crude-Oil/The-Next-Oil-Price-Spike-May-Cripple-The-Industry.html

By Andreas de Vries and Dr. Salman Ghouri for Oilprice.com


Fibonacci Retracements Analysis 24.08.2017 (GOLD, USD/CHF)

Article By RoboForex.com

XAU USD, “Gold vs US Dollar”

As we can see at the H4 chart, the price is being corrected inside the Flat pattern within the uptrend. The next upside targets may be the post-correctional extension area between the retracements of 138.2% and 161.8% at 1308.63 and 1313.50 respectively. However, we should also note that the instrument is forming the divergence, which may indicate a possible reverse or a deeper correction. The targets of the correction may be the retracements of 23.6%, 38.2%, and 50.0% at 1278.45, 1263,89, and 1252.84 respectively.

At the H1 chart, the situation is pretty similar. The price may break the Triangle correctional pattern upwards or downwards and start moving in the corresponding direction.


USD CHF, “US Dollar vs Swiss Franc”

As we can see at the H4 chart, the USD/CHF pair is still forming the sideways correction. After being corrected by 50.0%, the price tried to test the highs. The next targets of this correction may be the retracements of 61.8% and 76.0% at 0.9564 and 0.9519 respectively. After breaking the highs, the pair may grow towards the retracement of 61.8% (the correction of the previous long-term downtrend) at 0.9845.

At the H1 chart, the situation is the same, but shows more detailed structure.


RoboForex Analytical Department

Article By RoboForex.com

Attention!
Forecasts presented in this section only reflect the author’s private opinion and should not be considered as guidance for trading. RoboForex LP bears no responsibility for trading results based on trading recommendations described in these analytical reviews.

Murrey Math Lines 24.08.2017 (EUR/GBP, CHF/JPY)

Article By RoboForex.com

EUR GBP, “Euro vs Great Britain Pound”

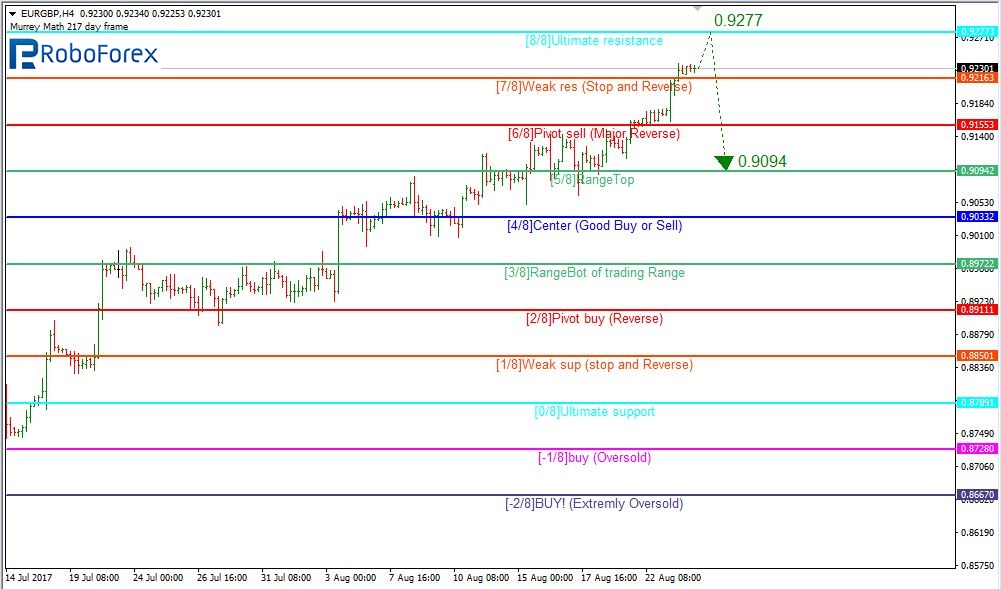
As we can see at the H4 chart, the EUR/GBP pair has broken the 7/8 level and fixed above it. Later, the price is expected to reach the 8/8 level at 0.9277, rebound from it, and then resume falling towards the 5/8 one at 0.9094.

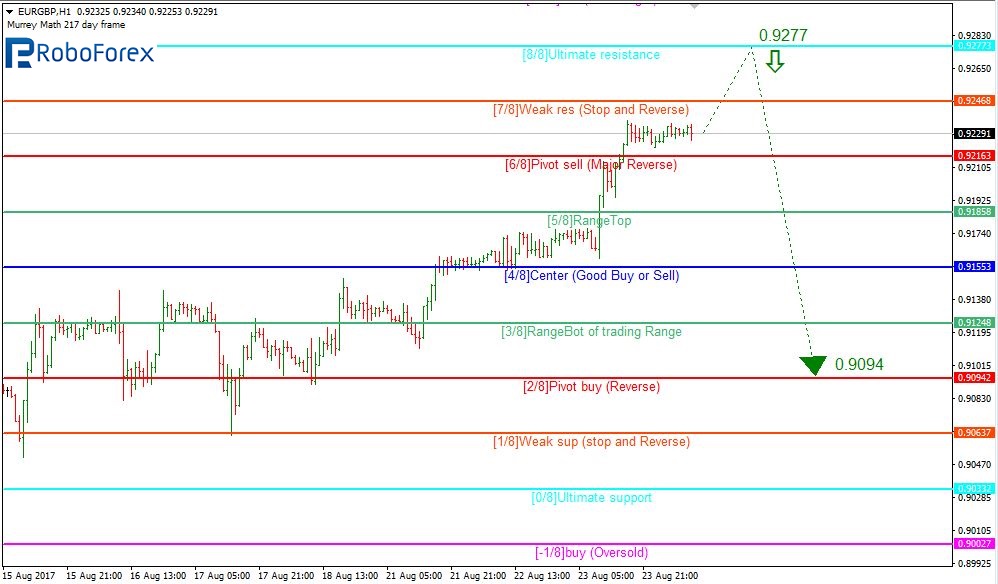
At the H1 chart, the 8/8 level at 0.9277 is the same as the 8/8 level from the H4 chart. The future scenario is similar to the H4 chart: the pair may rebound from 0.9277 and start falling to reach 0.9094.


CHF JPY, “Swiss Franc vs Japanese Yen”

As we can see at the H4 chart, the CHF/JPY pair has rebounded from the support at the 0/8 level at 112.50 and, as a result, may grow towards the resistance at the 3/8 one at 114.84.

At the H1 chart, the price may break the 3/8 level and then continue moving upwards to reach 114.84.

At the M15 chart, the pair has broken the upside line of the VoltyChannel indicator and, as a result, may start a new ascending movement towards 114.84.


RoboForex Analytical Department

Article By RoboForex.com

Attention!
Forecasts presented in this section only reflect the author’s private opinion and should not be considered as guidance for trading. RoboForex LP bears no responsibility for trading results based on trading recommendations described in these analytical reviews.

Artificial Intelligence Fights Against Terrorism

A company named Quantaverse has created a new system, with artificial intelligence, to discover when terrorists groups are being financed.

Witricity: The Future of Electricity

Electricity is about to change for the best, thanks to Witricity. It allows us to have all the power without any wires.


Fibonacci Retracements Analysis 23.08.2017 (AUD/USD, USD/CAD)

Article By RoboForex.com

AUD USD, “Australian Dollar vs US Dollar”

At the H4 chart, the AUD/USD pair is correcting the previous downtrend. After reaching the retracement of 50.0%, the price may continue the correction towards the one of 61.8% at 0.8003. The current movement may start a new ascending impulse, but this scenario will be confirmed only after the price breaks the local high at 0.8065. The targets of this possible impulse may be the post-correctional extension area between the retracements of 138.2% and 161.8% at 0.8163 and 0.8220 respectively. However, one shouldn’t exclude a possibility that the instrument still may be corrected to the downside. After breaking the local low at 0.7807, the price may reach the retracement of 61.8% at 0.7760.

At the H1 chart, the price is moving sideways. After breaking 0.7966, the pair may move towards the targets from the H4 chart. However, if the pair breaks the low at 0.7868, the instrument may fall to reach the lows from the same timeframe.


USD/CAD, “US Dollar vs Canadian Dollar”

As we can see at the H4 chart, the USD/CAD has been corrected to the downside by 61.8%. The next target is near the retracement of 76.0% at 1.2500. The important local low is at 1.2412. If the price breaks the local high at 1.2780, the instrument may move towards the post-correctional extension area between the retracements of 138.2% and 161.8% at 1.2880 and 1.2940 respectively.

At the H1 chart, the pair is forming the convergence and starting a new ascending correction. The targets of this correction are the retracements of 38.2%, 50.0%, and 61.8% at 1.2622, 1.2652, and 1.2684 respectively.


RoboForex Analytical Department

Article By RoboForex.com

Attention!
Forecasts presented in this section only reflect the author’s private opinion and should not be considered as guidance for trading. RoboForex LP bears no responsibility for trading results based on trading recommendations described in these analytical reviews.

Forex Technical Analysis & Forecast 23.08.2017 (EUR/USD, GBP/USD, USD/CHF, USD/JPY, AUD/USD, USD/RUB, GOLD, BRENT)

Article By RoboForex.com

EUR USD, “Euro vs US Dollar”

The EUR/USD pair is consolidating below 1.1769. We think, the price may break this range downwards and continue forming this descending wave. The target is at 1.1666. And this is just a half of the third wave with the target at 1.1515.


GBP USD, “Great Britain Pound vs US Dollar”

The GBP/USD pair has reached another new low. Possibly, the price may continue falling inside the downtrend towards 1.2732. Later, in our opinion, the market may be corrected to reach 1.2900 and then continue moving downwards.


USD CHF, “US Dollar vs Swiss Franc”

Being under pressure, the USD/CHF pair is moving upwards; it is breaking the top of ascending impulse. Possibly, the price may reach 0.9708 and then form another consolidation range. After breaking this range to the upside, the instrument may continue growing inside the uptrend with the target at 0.9800.


USD JPY, “US Dollar vs Japanese Yen”

The USD/JPY pair is still consolidating. Possibly, today the price may fall to reach the downside border of the range. Later, in our opinion, the market may break it and continue moving downwards with the target at 107.07.


AUD USD, “Australian Dollar vs US Dollar”

The AUD/USD pair is falling towards 0.7858. After that, the instrument may form another consolidation range, break it, and then continue falling with the target at 0.7766.


USD RUB, “US Dollar vs Russian Ruble”

The USD/RUB pair is still consolidating at the lows. Possibly, today the price may grow towards 59.43. Later, in our opinion, the market may fall towards 59.15. If later the instrument breaks this channel to the downside, the downtrend may continue towards 55.50; if to the upside – resume growing with the target at 59.89.


XAU USD, “Gold vs US Dollar”

Gold is still consolidating around 1266.54. We think, today the price may fall to reach 1279.15 and then grow towards 1289.89. If later the instrument breaks this channel to the downside, the market may fall towards 1255.00; if to the upside – continue growing with the target at 1312.00.


BRENT

Brent is still consolidating at the lows. Possibly, today the price may continue growing towards 54.08 and then fall to reach 52.58. After that, the instrument may move upwards with the local target at 55.15.


RoboForex Analytical Department

Article By RoboForex.com

Attention!
Forecasts presented in this section only reflect the author’s private opinion and should not be considered as guidance for trading. RoboForex LP bears no responsibility for trading results based on trading recommendations described in these analytical reviews.

The Cryptocurrency market is “overwhelmed” by the correction

The Bitcoin is falling significantly after skyrocketing to highs recently; sales may become more serious.


As early as Wednesday, it seemed that Bitcoin is on the verge of a serious correction, which is confirmed by technical charts. On August 15th, the market started covering long positions in the Bitcoin pairs and continued on August 16th morning, then it sharply turned in the opposite direction. After reaching the high at $4,430, the BTC/USD pair lost more than 38% and as of today, August 18th, it costs $4,309. Obviously, the market is going to continue selling.

The technical picture assumes that “bears” may push the Bitcoin price towards the area between $3,690 and $3,730. This forecast is valid for the next couple of days. However, if they don’t become more active until the end of the week, the target for “bulls” will be at $4,234 USD.

From the fundamental point of view, the market conditions for the Bitcoin right now are quite neutral. The global macro statistics, which is being published nowadays, is mostly pretty mixed and neutral, but not stressful. In this situation, investors do not require any independent assets. However, this is valid for the present moment. In the next two or three months, the demand for “safe haven” assets is expected to increase, thus pushing the Bitcoin to new highs. It seems like one should wait a bit before opening a lot of long positions.

We remind you that the Bitcoin is the world’s capitalization leader, which is $69.06 billion. The next ones are the Ethereum, $27.42 billion, and the Ripple, $6/15 billion. When trading cryptocurrencies, one should remember that the cryptocurrency market may get highly volatile very quickly and after skyrocketing, the currencies may start plummeting even faster.

Author: Dmitriy Gurkovskiy, senior analyst at RoboForex


Japanese Candlesticks Analysis 22.08.2017 (USD/CAD, NZD/USD)

Article By RoboForex.com

USD CAD, “US Dollar vs Canadian Dollar”

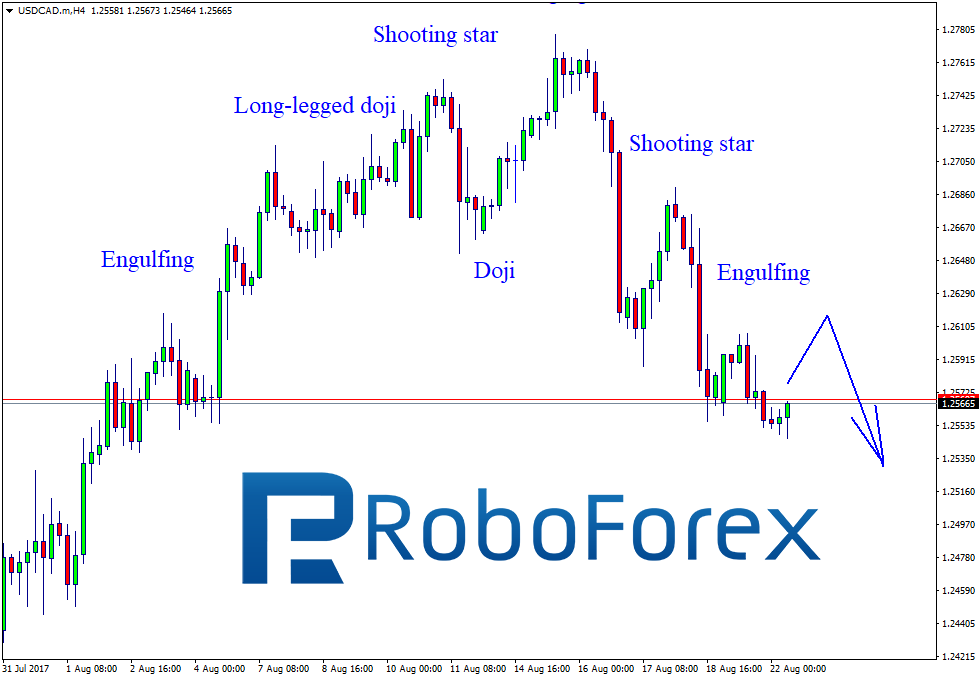
At the H4 chart of USD CAD, the price has completed the correction and right now we can see a new decline, which is confirmed by Engulfing, Long-Legged Doji, Hanging Man, and Shooting Star patterns. The downside target is at 1.2500.


NZD USD, “New Zealand Dollar vs. US Dollar”

As we can see at the H4 chart of NZD USD, the price is constantly forming Engulfing reversal patterns at the correction tops to confirm its decline, and the current pullback is no exception. The downside target is at 0.7272.


RoboForex Analytical Department

Article By RoboForex.com

Attention!
Forecasts presented in this section only reflect the author’s private opinion and should not be considered as guidance for trading. RoboForex LP bears no responsibility for trading results based on trading recommendations described in these analytical reviews.

Ichimoku Cloud Analysis 22.08.2017 (AUD/USD, NZD/USD, USD/CAD)

Article By RoboForex.com

AUD USD, “Australian Dollar vs US Dollar”

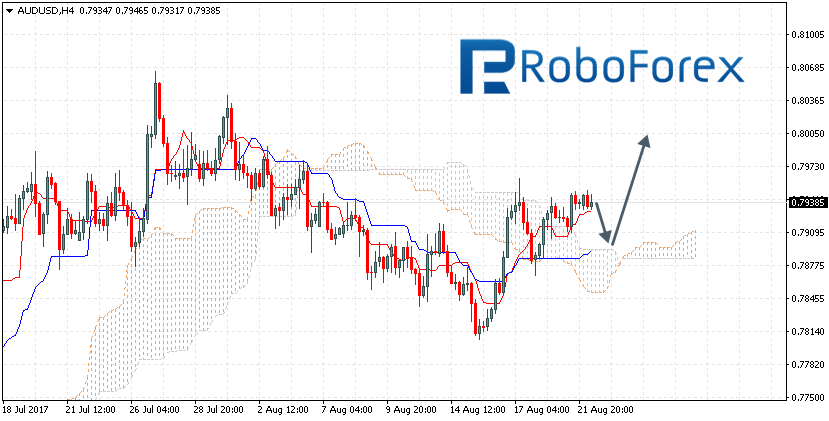
The AUD/USD pair is trading at 0.7938; the instrument is still moving above Ichimoku Cloud, which means that it may continue growing. We should expect the price to test the upside border of the cloud at 0.7905 and then continue moving upwards above 0.8005. However, this scenario may be cancelled if the price breaks the downside border of the cloud and fixes below 0.7870. In this case, the pair may continue falling towards 0.7785.


NZD/USD, “New Zealand Dollar vs US Dollar”

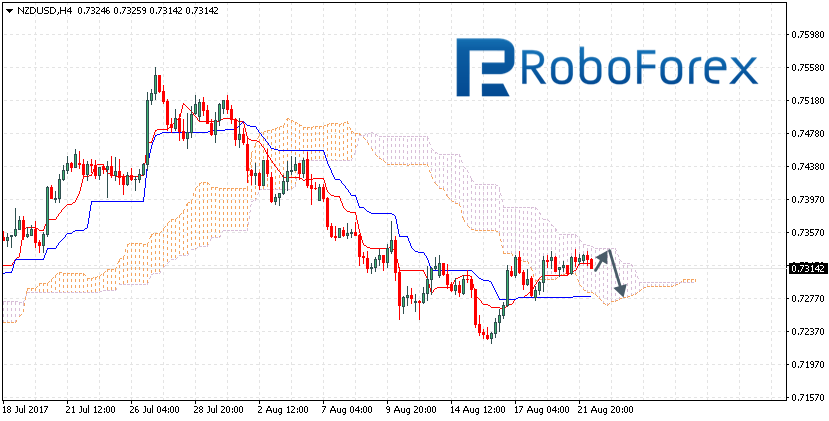
The NZD/USD pair is trading at 0.7314; the instrument is still moving inside Ichimoku Cloud, which means that the price is moving sideways. We should expect the price to rebound from the upside border of the cloud at 0.7320 and then continue moving downwards to reach 0.7275. However, the scenario that implies further decline may be cancelled if the price breaks the upside border of the cloud and fixes above 0.7355. In this case, the pair may continue growing towards 0.7440.


USD/CAD, “US Dollar vs Canadian Dollar”

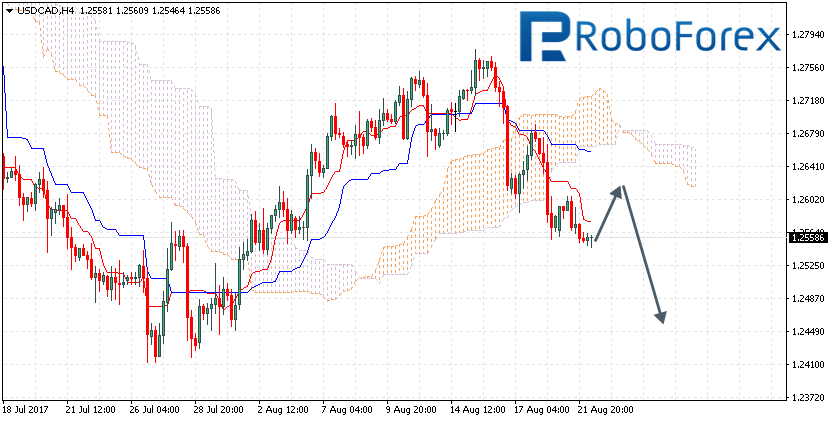
The USD/CAD pair is trading at 1.2558; the instrument is still moving below Ichimoku Cloud, which means that it may continue falling. We should expect the price to test Tenkan-Sen and Kijun-Sen at 1.2615 and then continue moving downwards below 1.2450. However, this scenario may be cancelled if the price breaks the upside border of the cloud and fixes above 1.2680. In this case, the pair may continue growing towards 1.2750.


RoboForex Analytical Department

Article By RoboForex.com

Attention!
Forecasts presented in this section only reflect the author’s private opinion and should not be considered as guidance for trading. RoboForex LP bears no responsibility for trading results based on trading recommendations described in these analytical reviews.