As we can see at the H4 chart, the USD/JPY pair has reached the downside border of the consolidation channel at the 3/8 level at 108.59. The price is expected to rebound from this level and start growing towards the upside border at the 5/8 one at 110.15.
At the H1 chart, the price may break the 3/8 level at 108.98 and, as a result, grow towards 110.15.
At the M15 chart, the pair may break the upside line of the VoltyChannel indicator. As a result, the price may continue moving upwards to reach 110.15.
NZD JPY, “New Zealand Dollar vs Japanese Yen”
At the H4 chart, the NZD/JPY pair is trading close to the support at the 0/8 level at 78.12. The price is expected to rebound from this level and start growing towards the 3/8 one at 80.46.
At the H1 chart, the price may break the 3/8 level at 78.71 and continue growing to reach 80.46.
At the M15 chart, the price is expected to break the upside line of the VoltyChannel indicator and, as a result, grow towards 80.46.
Attention! Forecasts presented in this section only reflect the author’s private opinion and should not be considered as guidance for trading. RoboForex LP bears no responsibility for trading results based on trading recommendations described in these analytical reviews.
On Tuesday the 5th of September, trading on the euro/dollar pair closed slightly up. After falling to 1.1868, the euro recovered to 1.1941. This growth was brought about by a general weakening of the dollar after the publication of weak data on factory orders in the US in July.
The index for factory orders in the US in July came out at -3.3% (forecast: -3.0%, previous: 3.2%).
US 10Y bond yields have fallen from 2.17% to 2.056%, its lowest level since the presidential election. After such a drop in bond yields, the euro should have risen to around 1.1980 but its growth was held up by the upcoming ECB meeting.
FOMC member Lael Brainard’s comments weighed down on the dollar. She said that due to a long period of low inflation, they should be particularly cautious on the question of further rate hikes. Now let’s take a look at the technical picture on the hourly timeframe.
Day’s news (GMT+3):
09:00 Germany: factory orders (Jul).
15:30 Canada: trade balance (Jul), labour productivity (Q2).
The euro/dollar pair has been in a sideways trend for the last 3 days. The price has been trading within the range from the 1st of September (1.1850 – 1.1980) for 2 out of these 3 days. Until the price exits this range, expect fluctuations around the LB balance line.
For now, the euro’s situation remains unclear. Bulls tried to break through the downwards trend line yesterday, but fell short. They failed because the bears received some support from the falling euro/pound cross as we await the ECB meeting.
So, look at what we have now. Buyers continue to believe that the ECB could announce the reversal of its quantitative easing program at their meeting on monetary policy on the 7th of September. Sellers reckon that the regulator will maintain this program until the end of October, before going on to announce a reduction in their asset purchasing program, which is currently at 60bn EUR a month.
Who’s right? I don’t know, and there’s no need to get in a twist over this. It’s better to wait until the ECB meeting has concluded and Mario Draghi gives his press conference. In such an uncertain situation, you’re more likely to trigger a stop level than make a profit. Today, I’m predicting an unsuccessful test of the downwards trend line to 1.1935, followed by a return to the upwards trend line at 1.1893.
See 11 charts from ONE page of Robert Prechter’s Elliott Wave Theorist.
3 Videos + 8 Charts = Opportunities You Need to See.
Join this free event hosted by Elliott Wave International and you’ll get a clear picture of what’s next in a variety of U.S. markets. After seeing this videos and charts you will be ready to jump on opportunities and sidestep risks in some major markets. This free report (a $29 value) will present a unique outlook and give you a new perspective on the markets you won’t get anywhere else.
This article was syndicated by Elliott Wave International and was originally published under the headline 2017 is NOT “Just Another Year” for the Stock Market: Here’s Why. EWI is the world’s largest market forecasting firm. Its staff of full-time analysts led by Chartered Market Technician Robert Prechter provides 24-hour-a-day market analysis to institutional and private investors around the world.
The EIA has once again undercut its previous estimates for U.S. oil production, offering further evidence that the U.S. shale industry is not producing as much as everyone thinks.
The monthly EIA oil production figures tend to be more accurate than the weekly estimates, although they are published on several months after the fact. The EIA just released the latest monthly oil production figures for June, for example. Meanwhile, the agency releases production figures on a weekly basis that are only a week old – the latest figures run up right through August.
The weekly figures are more like guestimates though, less solid, but the best we can do in nearly real-time. It is not surprising that they are subsequently revised as time passes and the agency gets more accurate data.
But the problem is that for several months now, the monthly and the weekly data have diverged by non-trivial amounts. The weekly figures have been much higher than what the monthly data reveal only later. And remember, it is the monthly data that tends to be more accurate.
Let’s take a look. A month ago, I wrote about how the EIA’s monthly data for May put U.S. oil production at 9.169 million barrels per day (mb/d). But back in May, the EIA’s weekly figures told a different story. The agency thought at the time that the U.S. was producing nearly 200,000 bpd more than turned out to be the case. Here were the weekly estimates at the time:
• May 5: 9.314 mb/d • May 12: 9.305 mb/d • May 19: 9.320 mb/d • May 26: 9.342 mb/d
But two months later, the EIA published its final estimate for May, and put the figure at 9.169 mb/d. So, as it turns out, the U.S. was producing much less in May than we thought at the time.
Now, the EIA has once again skewered its own weekly estimates. On August 31, it released monthly figures for June, and the discrepancy is even larger than the month before. The EIA says oil production in the U.S. actually declined in June, falling by 73,000 bpd to just 9.097 mb/d. Compare that to what the agency thought at the time with its weekly estimates:
• June 2: 9.318 mb/d • June 9: 9.330 mb/d • June 16: 9.350 mb/d • June 23: 9.250 mb/d • June 30: 9.338 mb/d
If those figures were correct, the U.S. would have averaged something like 9.317 mb/d for June. But the EIA now says that data was wrong, and in reality the figure should have been 9.097. In other words, in June, the U.S. produced 220,000 bpd less than we thought at the time.
This may seem like nitpicking, but it’s not exactly a tiny number. If that gap were to persist for the full-year, it’s nearly equivalent to half of what Saudi Arabia promised to cut as part of the OPEC deal, or substantially more than what the IEA expects Canada to add in new supplies this year.
More importantly, if the U.S. is actually producing much less than the market thinks, there is a much stronger bullish case for oil than conventional wisdom dictates. After all, there are massive shale production gains from the U.S. baked into oil price forecasts. For example, the EIA sees U.S. oil production surging from 9.3 mb/d this year to 9.9 mb/d in 2018, a gain of 600,000 bpd.
But the problem is that not only will it be difficult to reach that 9.9 mb/d, but it now looks like an uphill battle for the U.S. to reach that 9.3 mb/d figure in 2017. For the first six months of this year, the U.S. only averaged 9.071 mb/d. It will have to seriously ramp up production in order to reach that 9.3 mb/d estimate for the full-year. In reality, that looks very unlikely.
That means that ramping up to 9.9 mb/d next year would also appear out of reach, particularly since the shale industry seemed to stall out this summer. Production actually fell from May to June; the rig count has plateaued; some shale companies are already reporting some problems; the lingering effects of Hurricane Harvey will likely impact shale growth rates for months to come (although refinery outages are bearish in the near-term); and sub-$50 WTI prices will keep shale companies from recklessly spending more than they already are.
In short, the U.S. shale industry is on track to disappoint, which would mean there is a lot of upside risk to oil prices.
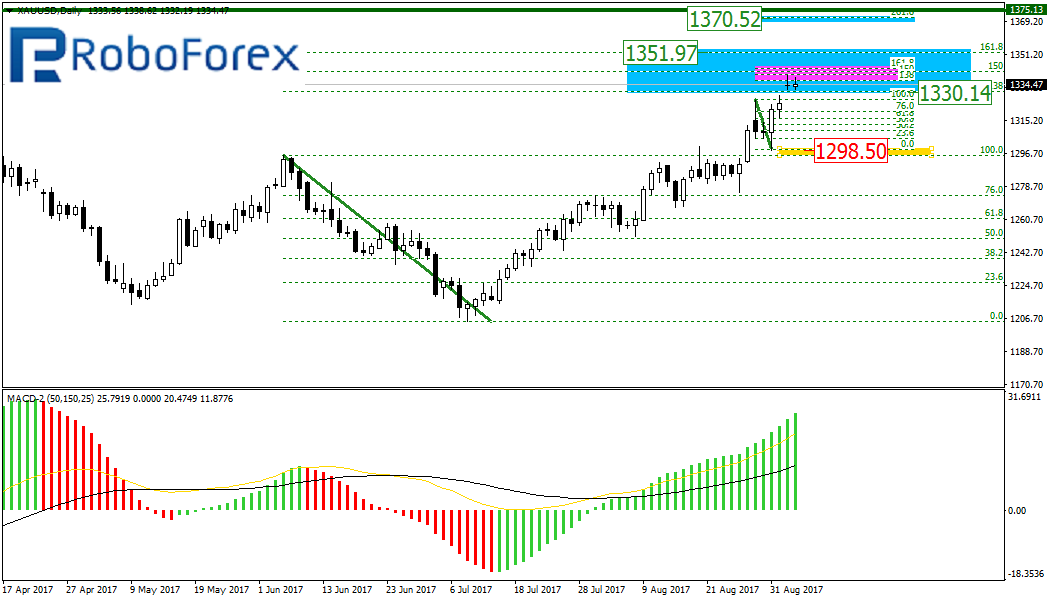
At the daily chart of the XAU/USD pair, the uptrend continues as the price has reached the post-correctional extension area. The next upside targets are at 1370.52 (the retracement of 261.8%) and 1375.13 (this year’s high). The local support for the current movement is at 1298.50.
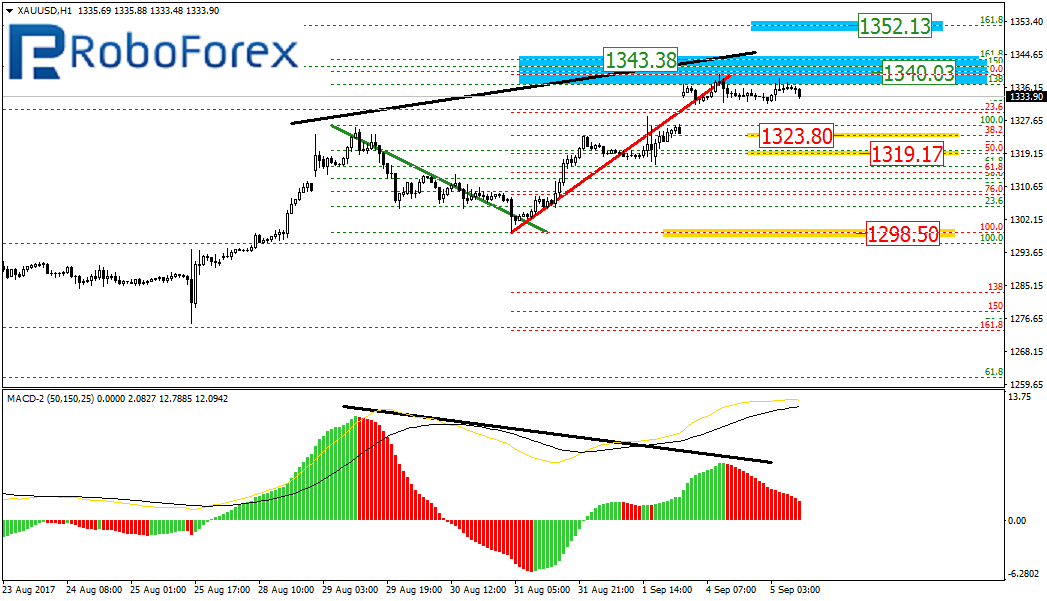
As we can see at the H1 chart, the pair has broken the highs and right now is forming the divergence, which indicates a possible correction or a reverse soon. In addition to that, the price has reached the post-correctional area. The closest targets of the current uptrend may be the retracements of 161.8% at 1343.38, and 1352.13. we should also take into account the current internal correction of the previous ascending impulse. The targets of this correction may be the retracements of 38.2% and 50.0% at 1323.80 and 1319.17 respectively.
USD CHF, “US Dollar vs Swiss Franc”
At the H4 chart, after reaching 0.9680 close to the retracement of 76.0%, the USD/CHF pair started the correction, which may complete quite soon at the retracement of 50.0%. The next downside target is the retracement of 61.8% at 0.9428. However, to continue moving upwards, the price has to break the local high at 0.9680 first. The targets of this ascending movement may be inside the post-correctional extension area between the retracements of 138.2% and 161.8% at 0.9732 and 0.9764 respectively.
Attention! Forecasts presented in this section only reflect the author’s private opinion and should not be considered as guidance for trading. RoboForex LP bears no responsibility for trading results based on trading recommendations described in these analytical reviews.
The EUR/USD pair is still trading above 1.1888. Possibly, today the price may grow to reach 1.1923 and complete this ascending wave. After that the instrument may fall towards 1.1800, break it, and then form another downside continuation pattern with the target at 1.1668.
GBP USD, “Great Britain Pound vs US Dollar”
The GBP/USD pair is trading above 1.2941. We think, today the price may fall to reach 1.2886 and then grow towards 1.3045 to complete the correction. Later, in our opinion, the market may continue falling inside the downtrend with the target at 1.2667.
USD CHF, “US Dollar vs Swiss Franc”
The USD/CHF pair is consolidating at the bottom of the range. If later the instrument breaks this consolidation range to the downside, the market may fall to reach 0.9514; if to the upside – continue growing towards 0.9700.
USD JPY, “US Dollar vs Japanese Yen”
Being under pressure, the USD/JPY pair is trading downwards. Possibly, today the price may reach 108.42 and then form another correctional structure towards 109.22. After that, the instrument may continue falling inside the downtrend with the target at 107.14.
AUD USD, “Australian Dollar vs US Dollar”
The AUD/USD pair is still consolidating near the lows. Possibly, the price may extend this wave towards 0.8040 (an alternative scenario). According to the main scenario, the market may fall to reach 0.7870, break it, and then continue falling inside the downtrend with the target at 0.7755.
USD RUB, “US Dollar vs Russian Ruble”
The USD/RUB pair is being corrected. Possibly, the price may grow to reach 58.11 and then continue falling inside the downtrend to reach the local target at 56.76.
XAU USD, “Gold vs US Dollar”
Gold is consolidating near the highs; this consolidation range may be considered as a reversal pattern. Possibly, the price may be corrected towards 1317. Later, in our opinion, the market may form another consolidation range, break it upwards, and extend the wave towards 1350.
BRENT
Brent is consolidating around 52.55 and trying to break the downside border of the range. Possibly, the price may be corrected towards 51.40. If later the instrument breaks this range to the upside, the market may reach grow to the local target at 54.60.
Attention! Forecasts presented in this section only reflect the author’s private opinion and should not be considered as guidance for trading. RoboForex LP bears no responsibility for trading results based on trading recommendations described in these analytical reviews.
On Monday the 4th of September, trading on the euro/dollar pair closed up. The rate went up as the dollar fell in the aftermath of North Korea’s nuclear bomb test. Since the US and Canada both celebrated Labor Day yesterday, banks and exchanges in these countries were all closed and so activity was low on the currency market in the second half of the day. During the US session, the euro/dollar rate stabilised around the 1.1900 mark.
Day’s news (GMT+3):
10:15 Switzerland: CPI (Aug).
10:55 Germany: Markit services PMI (Aug).
11:00 Eurozone: Markit services PMI (Aug).
11:30 UK: Markit services PMI (Aug).
12:00 Eurozone: retail sales (Jul).
12:10 Australia: RBA governor Philip Lowe’s speech.
In Monday’s forecast, I predicted the price to trade within a corridor of 1.1860 to 1.1920. The euro actually hit 1.1922 before falling to 1.1889. Because of the national holiday in the US and Canada, sellers were unable to reach the lower target.
At the time of writing this review, the euro is trading at 1.1905. Trader attention this week will be focused on the meetings to be held at the ECB and Bank of Canada. Canada’s central bank may raise interest rates. In Europe, traders are hoping to get a clearer picture of the ECB’s QE program.
The North Korea situation is still unclear. New sanctions have yet to be fully prepared, while North Korea is getting ready for further tests. The yen, the franc, and gold, as safe haven assets, continue to enjoy high demand from investors.
In my forecast today, I’m predicting a slide for the euro down to the trend line at 1.1875. I think that pressure on the euro on the euro/pound cross will remain until the 7th of September. Since I’m not sure how American investors will react to North Korea’s nuclear test, my forecast only goes as far as the start of the US session.
There’s a resistance at 1.1925. Keep an eye on the dynamics of the yen, franc, gold, and European stock indices. If the safe havens rise while stocks fall, don’t sell your euros. The euro is a funding currency, so upon the sale of American and European stocks, it will rise against the dollar, regardless of the upcoming ECB meeting.
Admiral Markets announces the launch of a free two-part series of webinars with trading experts Jack Schwager and Steve Nison, scheduled on September 21 and September 28, respectively. The series will be followed by a Q&A session with Nenad Kerkez.
The aim of the series is to educate traders using real-life experience-based examples and boost their knowledge with the most up-to-date tips of the industry.
Registration: Traders can participate for free, however registering in advance is mandatory.
Dates:
Webinar 1 – Market Wizard Lessons Thursday 21 September, 2017 Host: Nenad Kerkez Special Guest: Jack Schwager Time: 19:00 EEST (16:00 GMT)
Webinar 2 – Candlestick Strategies That Are Working Right Now Thursday 28 September, 2017 Host: Nenad Kerkez Special Guest: Steve Nison Time: 19:00 EEST (16:00 GMT)
About the special guests:
Jack Schwager is the author of the best-selling book – Market Wizards. His webinar will tackle the concept of trading psychology and theory.
Steve Nison, also known as the “Father of Japanese Candlestick Charts” is the world’s most famous expert on candlesticks. During the webinar, he will delve into top trading techniques to use with one of the most popular trading chart types of all times.
Risk disclosure: Forex and CFD’s carry a high level of risk and losses may exceed your initial deposit. Admiral Markets UK Ltd. recommends you seek advice from an independent financial advisor to ensure that you understand the risks involved with Forex, CFD’s, Margin and Leveraged trading.
The high liquidity of the foreign exchange market and the opportunity to make money quickly, represents an attractive business venture for investors. However, often times these investors are not thoroughly knowledgeable about the fundamentals and technicalities involved in Forex trading. In order to succeed in Forex trading, traders need to possess discipline, persistence, and a certain emotional capacity. Most of all, would-be investors need to understand the different factors that contribute to the moving markets.
Forex trading is not exactly the most user-friendly market. It’s easy to get confused with all the charts and patterns, and it can be intimidating to navigate the waters alongside more experienced traders. For this reason copy trading is becoming an increasingly popular investment method, as it allows beginner traders to engage in the exciting but complex world of trading even without any form of education or training.
What is copy trading and why is it popular?
Copy trading allows Forex traders to copy the trading styles and strategies of other, more experienced traders, using an automated platform. Often, the copying takes place through a social trading platform, where traders are able to choose whose trading style they want to copy based on their success rate, risk management style, instruments traded and other factors.
Traders will then assign the trading capital to their chosen trade leader and simply wait for the trades to be automatically carried out into their accounts. Those who engage in copy trading may even have the liberty to choose the size of a trade and add a personal touch to manually adjust the trade to enhance results or put in a stop loss. Moreover, newbie traders can also minimize risk levels.
Simply put, copy trading allows aspiring traders to partake in the forex market with confidence, and start building on their experience by learning directly from the pros. One of the major benefits of these systems is that they provide the convenience for traders to not need to be tied to their computers. Copy traders no longer need to get directly involved for their trading instructions to be carried out by the system.
Apart from this, copy trading systems are also beneficial to those traders being copied. Often times, depending on the trading platform, by making their trades available for investors to copy, they earn commissions from investors who make money on the trades that are successful.
Different political and economic factors that are making today’s currency market more volatile, are making copy trading platforms more popular. Copy trading platforms are only expected to grow in popularity and spark more interest in foreign exchange, as they ease beginner traders into the market and give them the chance to maximize the earnings they get from trades that are successful and profitable.
About the Author:
Adinah Brown is a professional writer who has worked in a wide range of industry settings, including corporate industry, government and non-government organizations. Within many of these positions, Adinah has provided skilled marketing and advertising services and is currently the Content Manager at Leverate.
The AUD/USD pair is trading at 0.7951; the instrument is still moving above Ichimoku Cloud, which means that it may continue growing. We should expect the price to test the upside border of the cloud t 0.7930 and then continue moving upwards above 0.8030. However, this scenario may be cancelled if the price breaks the downside border of the cloud and fixes below 0.7900. In this case, the pair may continue falling towards 0.7815.
NZD/USD, “New Zealand Dollar vs US Dollar”
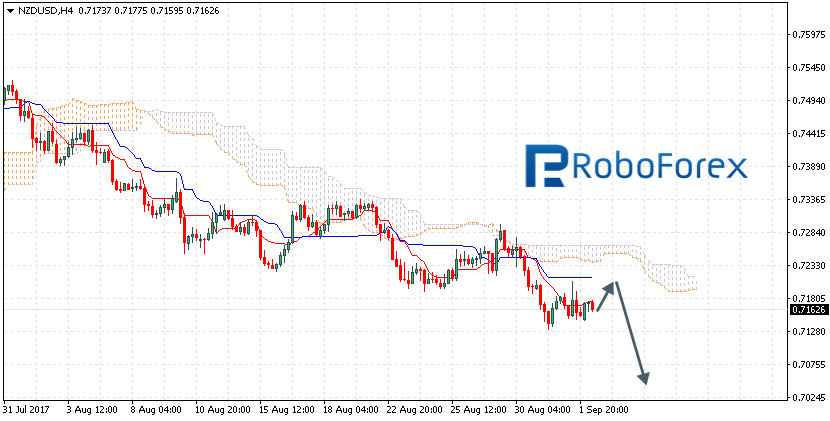
The NZD/USD pair is trading at 0.7162; the instrument is still moving below Ichimoku Cloud, which means that it may continue falling. We should expect the price to test Tenkan-Sen and Kijun-Sen at 0.7190 and then continue moving downwards to reach 0.7045. However, the scenario that implies further decline may be cancelled if the price breaks the upside border of the cloud and fixes above 0.7285. In this case, the pair may continue growing towards 0.7350.
USD/CAD, “US Dollar vs Canadian Dollar”
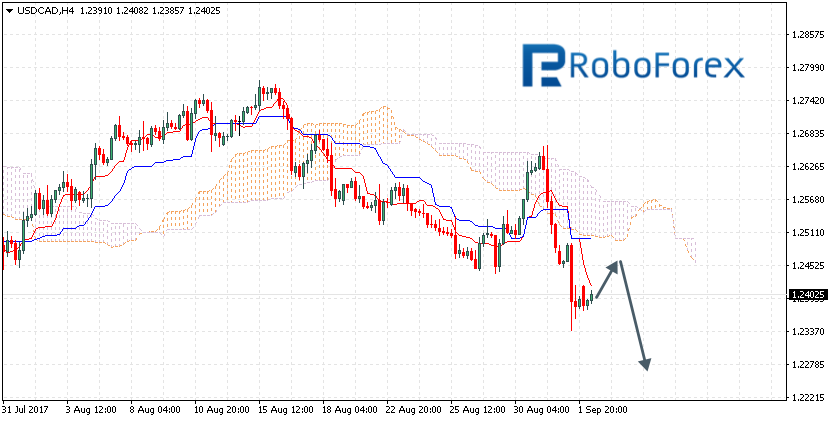
The USD/CAD pair is trading at 1.2402; the instrument is still moving below Ichimoku Cloud, which means that it may continue falling. We should expect the price to test Tenkan-Sen and Kijun-Sen at 1.2450 and then continue moving downwards below 1.2275. However, this scenario may be cancelled if the price breaks the upside border of the cloud and fixes above 1.2510. In this case, the pair may continue growing towards 1.2620.
Attention! Forecasts presented in this section only reflect the author’s private opinion and should not be considered as guidance for trading. RoboForex LP bears no responsibility for trading results based on trading recommendations described in these analytical reviews.