Investor sentiment pursues the “hot opportunity.” But history shows it’s better to use sentiment as a contrary indicator.
Learn to Use Sentiment to Time Your Investments Better
In this 14-minute video, you’ll learn how to combine Elliott wave analysis with extremes in market sentiment to reliably anticipate turning points in the markets. EWI Chief Market Analyst Steve Hochberg explains using an example in gold.
This article was syndicated by Elliott Wave International and was originally published under the headline The Stock Market, Mood Swings, and Your Investments. EWI is the world’s largest market forecasting firm. Its staff of full-time analysts led by Chartered Market Technician Robert Prechter provides 24-hour-a-day market analysis to institutional and private investors around the world.
…The system goes online August 4th, 1997.’ No, it’s not really the Terminator, but technological leaders are worried about our futures being in the hands of AI.
After being one of the strongest supporters for the Hugo Chavez administration, these two government officials are standing up against Nicolas Maduro’s policies.
BRIC economies continue to grow. In the late 2020s, the size of China’s economy will surpass that of the US. By the early 2030s, the BRICs’ combined economic power will surpass that of major advanced nations.
The BRICS Summit in Xiamen, Fujian province, signals the rising might of the large emerging economies, such as China, India, Russia, and Brazil. South Africa does not fulfill the criteria of a true BRIC economy – large population, strong growth record and catch-up potential – but it has historically played a key role in African governance.
As global economic prospects now look brighter in the major advanced economies, some observers believe their recovery will weaken the role of the BRICS in global economy and governance. But the realities are quite different.
China the largest economy by the late 2020s
The four key BRIC economies are often compared with major advanced economies, or the so-called G6: the United States, Japan and the four core European nations: Germany, UK, France and Italy.
In 2000, China’s economy was barely a tenth of that of the US, whereas Japan’s GDP was still as large as the three largest European economies together: Germany, the UK and France. Brazil was struggling for stability, Russian economy had been crushed by US-led “reforms,” while change was only beginning in India.
By the early 2010s, the world economy looked very different. The US economy was still more than twice as big as that of China but Japan’s growth had been penalized by stagnation. Chancellor Merkel’s Germany and President Sarkozy’s France ruled over Europe. In Brazil, the Lula era brought about a dramatic catch-up. In India, growth had accelerated. In Russia, President Putin’s rule had multiplied the size of the economy by almost six-fold.
If China can stay on course, the size of its economy shall surpass that of the US by the late 2020s. Despite growth deceleration, which is normal after intensive industrialization, China has strong growth potential until the 2030s, whereas US growth is slowing by maturing economy and aging demographics.
Should President Trump succeed in the plan to cut immigration by 50 percent, US productivity and growth would deteriorate significantly more. In Europe, the net effect of anti-immigration sentiment is likely to generate similar adverse damage.
By 2050, Chinese economy could be almost 50 percent bigger than its US counterpart, while the Indian economy may follow in the footprints and surpass America a few years later. Japan and the core EU economies follow far behind (Figure 1).
In early 2030s, emerging economies will override G6
What will the catch-up by the BRIC economies mean in terms of global economic power? In 2000, the major advanced nations, as reflected by the G6, were almost ten times bigger than the the BRICs.
Figure 1 The BRIC and G6 Countries, 2000-2050 (USD trillion)
In the aftermath of the global crisis, their dominance had shrunk dramatically. In 2010, they were only three times as large as the BRICs.
In the coming decade, secular stagnation in the US, Western Europe and Japan will sustain relatively low growth, whereas large emerging economies, despite relative growth deceleration, will continue their historical catch-up.
In barely a decade and half – by the early 2030s – the BRICs collective economic power will surpass that of the G6. And by the mid-21st century, the BRICs could be some 50 percent bigger than their advanced counterparts (Figure 2).
Figure 2 The G6 and BRIC Economies, 2000-2050 (USD trillion)
In these scenarios, I have used publicly-available economic data by the International Monetary Fund (IMF) and projections based on history, industrialization and sustained growth potential.
However, even if something is possible does not mean that it will be actualized. Over time, both advanced and emerging economies must engage in structural reforms to realize their full potential.
Nevertheless, BRIC scenarios may not be optimistic enough because there are still other fairly large emerging economies that are likely to expand fast and significantly by 2050. Indonesia could become the fourth largest economy in the world, while Mexico and Turkey could grow bigger than Germany and France, respectively. Meanwhile, the economies of new rising powers – Saudi Arabia, Nigeria, Egypt, Pakistan, Iran, the Philippines and Vietnam – could each prove bigger than that of Italy.
Overall, large emerging nations are most likely to realize their potential if they can work together and intensify global trade and investment.
About the Author:
Dr Dan Steinbock is the founder of Difference Group and has served as research director at the India, China and America Institute (USA) and visiting fellow at the Shanghai Institutes for International Studies (China) and the EU Center (Singapore). For more, see http://www.differencegroup.net/
A slightly shorter version of this commentary was originally released by China Daily on September 6, 2017
The EUR/USD pair is consolidating above 1.1907. Possibly, today the price may rebound from the center of the range and fall to break the downside border. The target is at 1.1888. After that the instrument may form another consolidation range, break it downwards, and then continue falling inside the downtrend with the target at 1.1800.
GBP USD, “Great Britain Pound vs US Dollar”
The GBP/USD pair is still consolidating at the top of the ascending wave. We think, today the price may break the downside border. The first downside target is at 1.2950.
USD CHF, “US Dollar vs Swiss Franc”
The USD/CHF pair is still forming another consolidation range; it has already expanded the range both to the upside and downside. Possibly, today the price may form another ascending impulse, break the upside birder, and then continue growing with the first target at 0.9600.
USD JPY, “US Dollar vs Japanese Yen”
The USD/JPY pair has completed the correction with the target at 109.38. Later, in our opinion, the market may fall to reach 108.38 and then form another correctional structure to return to 109.38. After that, the instrument may continue falling inside the downtrend with the target at 107.00.
AUD USD, “Australian Dollar vs US Dollar”
The AUD/USD pair has formed another consolidation range below 0.7977. We think, today the price may form another descending structure towards 0.7956. If later the instrument breaks this consolidation range to the downside, the market may fall to reach 0.7755; if to the upside – continue growing towards 0.8040.
USD RUB, “US Dollar vs Russian Ruble”
The USD/RUB pair is trading near the lows of the descending wave ad forming another consolidation range. If later the instrument breaks this consolidation range to the upside, the market may be corrected towards 57.60; if to the downside – continue falling with the local target at 56.76.
XAU USD, “Gold vs US Dollar”
Gold is consolidating above 1336.40. We think, today the price may fall towards 1329.00. If later the instrument breaks this consolidation range to the downside, the market may be corrected to reach 1285.00; if to the upside – extend this wave towards 1357.00 (an alternative scenario).
BRENT
Brent has broken 52.80 to the upside and completed the ascending structure. Possibly, today the price may be corrected towards 53.00. After that, the instrument may continue growing the local target at 55.15.
Attention! Forecasts presented in this section only reflect the author’s private opinion and should not be considered as guidance for trading. RoboForex LP bears no responsibility for trading results based on trading recommendations described in these analytical reviews.
The AUD/USD pair is trading at 0.7983; the instrument is still moving above Ichimoku Cloud, which means that it may continue growing. We should expect the price to test Tenkan-Sen and Kijun-Sen at 0.7975 and then continue moving upwards above 0.8060. However, this scenario may be cancelled if the price breaks the downside border of the cloud and fixes below 0.7930. In this case, the pair may continue falling towards 0.7845.
NZD/USD, “New Zealand Dollar vs US Dollar”
The NZD/USD pair is trading at 0.7177; the instrument is still moving below Ichimoku Cloud, which means that it may continue falling. We should expect the price to test the downside border of the cloud at 0.7180 and then continue moving downwards to reach 0.7090. However, the scenario that implies further decline may be cancelled if the price breaks the upside border of the cloud and fixes above 0.7225. In this case, the pair may continue growing towards 0.7315.
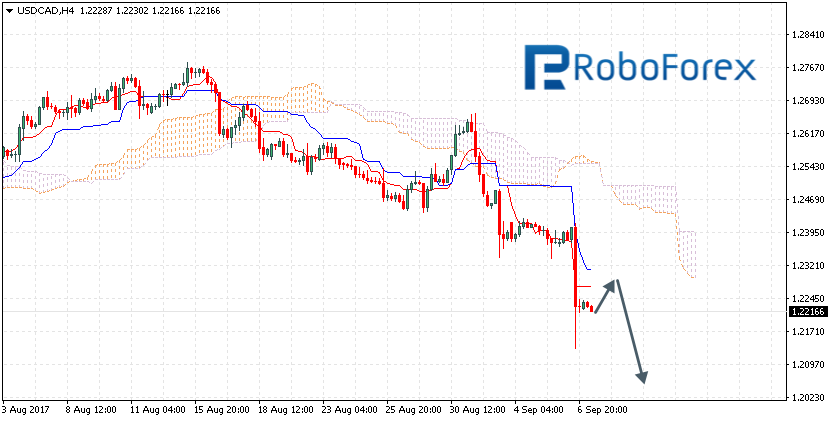
USD/CAD, “US Dollar vs Canadian Dollar”
The USD/CAD pair is trading at 1.2216; the instrument is still moving below Ichimoku Cloud, which means that it may continue falling. We should expect the price to test Tenkan-Sen and Kijun-Sen at 1.2265 and then continue moving downwards below 1.2070. However, this scenario may be cancelled if the price breaks the upside border of the cloud and fixes above 1.2410. In this case, the pair may continue growing towards 1.2540.
Attention! Forecasts presented in this section only reflect the author’s private opinion and should not be considered as guidance for trading. RoboForex LP bears no responsibility for trading results based on trading recommendations described in these analytical reviews.
On Wednesday the 6th of September, trading on the euro/dollar pair closed slightly up (+9 pips). The price spent the whole day within a range of 1.1903 to 1.1950, staying within the 1st of September’s range of 1.1850 to 1.1980.
The euro rose to 1.1950 during the European session. From there, the price went back down to 1.1914. There was a jump in volatility during the US session after the Bank of Canada announced its decision to raise its key rate by 25 base points to 1.00%. The US dollar collapsed against its Canadian counterpart, shedding 279 pips to reach 1.2136.
The publication of US data didn’t bring any respite. The ISM non-manufacturing index came out lower than expected. Trader activity on the EURUSD pair was low in anticipation of the ECB meeting and Mario Draghi’s press conference.
15:30 Eurozone: ECB monetary policy statement and press conference.
15:30 USA: initial jobless claims (1 Sep), nonfarm productivity (Q2), unit labour costs (Q2).
17:00 Canada: Ivey PMI (Aug).
18:00 USA: EIA crude oil stocks change (28 Aug).
EURUSD rate on the hourly. Source: TradingView
On Wednesday, our pair traded within a 47-pip corridor. After an unsuccessful attempt at breaking 1.1950, buyers retreated to the LB balance line. Now, markets are awaiting the results of the ECB meeting and Mario Draghi’s press conference to follow.
I won’t be making a forecast in today’s review. It’s rather pointless to do so when the head of the ECB is set to give a press conference. He could easily cause a storm on currency markets today. Market participants are interested to know what he’ll say about the strength of the euro, and whether he will announce a date for the reversal of the ECB’s QE program. During Draghi’s speech, I’m expecting to see a price range of 1.1840 – 1.2014. There’s a resistance at 1.1965 and a support at 1.1900 (trend line).
“Guessing or going by gut instinct won’t work over the long run. If you don’t have a defined trading methodology, then you don’t have a way to know what constitutes a buy or sell signal. Moreover, you can’t even consistently correctly identify the trend.”
– Jeffrey Kennedy
Jeffrey Kennedy is an accomplished teacher and a Senior Analyst here at Elliott Wave International. He feels strongly that, in addition to risk management and emotional discipline, the right technical tools can also add confidence and clarity to your Elliott wave counts.
Jeffrey’s 3 favorite technical tools are Japanese Candlesticks, RSI (Relative Strength Index) and MACD (Moving Average Convergence-Divergence). Today’s lesson shows you how MACD can help identify trading opportunities with an example from USDCAD, the U.S. dollar vs. Canadian dollar.
This video is an overview of MACD. It was adapted from Jeffrey’s Trader’s Classroom educational service, which empowers subscribers with information on nearly every aspect of trading.
More from Jeffrey:
Moving average convergence divergence (MACD) is a momentum indicator developed by Gerald Appel. It consists of two exponential moving averages, the MACD line and Signal line. The difference between these two lines yields an additional indicator, MACD Histogram.
Since these studies evaluate momentum, they work optimally in trending markets. When combined with reversal candlestick patterns, MACD and MACD Histogram can increase confidence in these patterns as well as continuation of the larger trend.
MACD divergence occurs when prices move one way and MACD moves the other. Bearish divergence forms when prices make new highs and MACD does not. Conversely, new price lows without lower MACD readings is bullish divergence. These conditions aid traders in identifying potential changes in momentum and trend.
MACD is constructed using two lines referred to as the MACD line and the Signal line. When the MACD line appears to penetrate the Signal line, but fails to do so, a hook forms. The significance of a hook is that it coincides with countertrend price moves.
MACD is excellent technical tool provided you know how to use it and what to look for.
Learn How You Can Find High-Confidence Trading Opportunities Using Moving Averages
Moving averages are one of the most widely-used methods of technical analysis because they are simple to use, and they work. Learn how to apply them to your trading and investing with this free 10-page eBook from Trader’s Classroom editor Jeffrey Kennedy.
This article was syndicated by Elliott Wave International and was originally published under the headline Top 3 Technical Tools Part 3: MACD. EWI is the world’s largest market forecasting firm. Its staff of full-time analysts led by Chartered Market Technician Robert Prechter provides 24-hour-a-day market analysis to institutional and private investors around the world.
Macroeconomic overview: The Federal Reserve is getting more dovish in the face of weak inflation data, reducing the likelihood of a third rate hike this year, which traders already see as very unlikely.
Three Fed policymakers on Tuesday expressed doubts about further rate hikes, with one influential policymaker calling for a delay in raising U.S. interest rates until the Fed is confident inflation will rebound.
A second Fed policymaker blamed the Fed’s rate hikes to date not only for weak inflation, but also for undermining the recovery in the labor market that many policymakers including Fed Chair Janet Yellen have cited as they have justified raising rates.
Taken together, the comments from one third of the Fed’s current policy-setting panel suggest that months of falling or flat inflation readings could scuttle plans to raise rates once more this year and three times next year. Fed policymakers next meet September 19-20 and are due to release fresh economic forecasts that may envision a flatter path for rate hikes ahead.
In a speech at the Economic Club of New York, Fed Governor Lael Brainard said the U.S. central bank should go so far as to make clear it is comfortable pushing prices modestly above the Fed’s 2% target. The Fed’s preferred gauge now stands at 1.4%.
Brainard drew a similar line in the sand a year ago, helping delay a policy tightening by a few months. Two weeks ago, the other sitting governor, Jerome Powell, said low inflation allowed the Fed to be patient on a hike.
Speaking later on Tuesday, Minneapolis Federal Reserve Bank President Neel Kashkari went even further. “Maybe our rate hikes are actually doing real harm to the economy,” Kashkari said in a speech at the University of Minnesota’s business school. Kashkari was the only Fed policymaker to dissent on rate hikes this year, though some Fed policymakers who are not voters this year have also expressed disagreement with the current rate hike path.
Robert Kaplan, president of the Dallas Fed, said he believes “we can afford to be patient” on rate hikes because growth is slow and so is inflation.
Investors are skeptical about another rate now and give a December rate hike a 27% probability, and only even odds of a rate hike by next June.
The European Central Bank decision is scheduled for tomorrow. Euro strength is unlikely to derail the euro zone recovery, leaving the ECB on track for a tapering announcement relatively soon. However, currency appreciation makes the ECB nervous because it complicates its job to revive inflation – we expect this to be reflected by slight downward revisions to the central bank’s CPI forecasts next week. All this has two implications. First, it strengthens our conviction that the tapering trajectory in 2018 will be “dovish”, with net asset purchases slowing to EUR 40 bn per month in the first half of 2018 and drawing to a close only at the end of next year. Outright cancellation of tapering plans remains a risk scenario related to further material currency appreciation, probably if the trade-weighted euro rises by a further 3-4%. Second, ECB President Mario Draghi is likely to start verbal intervention next week to try to put a lid on currency appreciation. The time of the formal announcement of the fate of QE remains a close call: as signaled by M. Draghi, it will be either next week or at the 26 October meeting. We think the latter is slightly more likely. Regardless of the exact timing of the announcement, what really matters is the final outcome: expect the ECB to reduce stimulus next year, but in a very gradual and open-ended fashion.
Technical analysis: The EUR/USD stays close to the short-term moving averages that remain positively aligned. A break of last Friday’s 1.1980 peak would concern bears and open the way above 1.2000. Much depends on tomorrow’s ECB statement, that is why we stay cautious.
Short-term signal: Buy at 1.1750
Long-term outlook: Bullish
AUD/USD: 0.8000 resistance remains solid
Macroeconomic overview: The AUD/USD backed away from stiff chart resistance around 0.8000 today after a report on domestic economic growth was not as exuberant as bulls had wagered on.
The Australian economy expanded 0.8% in the June quarter of 2017, much stronger than a 0.3% growth in the first quarter and matching market consensus. The solid expansion was mainly supported by strength in domestic demand and net exports.
In the three months to June, household consumption added 0.4 percentage points to growth, government spending contributed 0.2 percentage points to growth and exports added 0.6 percentage points to growth. On the other hand, non-residential construction subtracted 0.4 percentage points from growth and inventories detracted 0.6 percentage points from growth.
Final consumption expenditure rose 0.8%. Household spending increased by 0.7%, and government consumption expenditure increased by 1.2%.
Gross fixed capital formation expanded by 1.5%. Public investment rose 11.9%, driven by state and local general government (25.5%). This included the acquisition of the recently completed Royal Adelaide Hospital from the private sector. Private investment declined by 1.1%, due to non-dwelling construction (-7.7%). Partially offsetting the fall was machinery and equipment (2.9%). Total gross fixed capital formation contributed 0.4 percentage points to GDP growth.
Exports of goods and services grew by 2.7%. Imports of goods and services rose 1.2%.
The changes in total inventories was a decrease of AUD 419 million in seasonally adjusted terms following a rise of AUD 1.982 million in the prior quarter. The fall was driven by a rundown in wholesale trade inventories, the largest since June 2010, as grain wholesalers run down stock following the strong grain harvest this year. Offsetting the decrease was an increase in manufacturing inventories.
GDP data has shown no sign of rekindling inflation and, with plenty of spare capacity in the labour market, the Reserve Bank of Australia seems content to leave interest rates at record lows for months to come.
That was very much the view laid out by RBA Governor Philip Lowe in a speech late Tuesday. “It will be some time before we are at what could be considered full employment and before underlying inflation is at the mid-point of the medium-term target range,” he declared.
Interbank futures imply virtually no prospect of a move in the 1.5% cash rate this year and around a 50-50 chance of a hike by June 2018.
Although the head of the RBA made it clear there were no plans to raise interest rates anytime soon we expect the AUD/USD to strengthen in the medium term. Prices for iron ore, Australia’s single biggest export earner, have been supported by Chinese demand and copper hit its highest in three years this week.
Technical analysis: The AUD/USD broke above 0.8000 resistance yesterday but did not manage to close above that level. But the pair remains above short-term moving averages that are positively aligned. We think that another attempt to break above that key resistance is likely in the coming days.
Short-term signal: Long for 0.8150
Long-term outlook: Bullish
TRADING STRATEGIES SUMMARY:
FOREX – MAJOR PAIRS:
FOREX – MAJOR CROSSES:
PRECIOUS METALS:
How to read these tables?
1.Support/Resistance – three closest important support/resistance levels 2. Position/Trading Idea: BUY/SELL – It means we are looking to open LONG/SHORT position at the Entry Price. If the order is filled we will set the suggested Target and Stop-loss level. LONG/SHORT – It means we have already taken this position at the Entry Price and expect the rate to go up/down to the Target level. 3. Stop-Loss/Profit Locked In – Sometimes we move the stop-loss level above (in case of LONG) or below (in case of SHORT) the Entry price. This means that we have locked in profit on this position. 4. Risk Factor – green “*” means high level of confidence (low level of uncertainty), grey “**” means medium level of confidence, red “***” means low level of confidence (high level of uncertainty) 5. Position Size (forex)– position size suggested for a USD 10,000 trading account in mini lots. You can calculate your position size as follows: (your account size in USD / USD 10,000) * (our position size). You should always round the result down. For example, if the result was 2.671, your position size should be 2 mini lots. This would be a great tool for your risk management! Position size (precious metals) – position size suggested for a USD 10,000 trading account in units. You can calculate your position size as follows: (your account size in USD / USD 10,000) * (our position size). 6. Profit/Loss on recently closed position(forex) – is the amount of pips we have earned/lost on recently closed position. The amount in USD is calculated on the assumption of suggested position size for USD 10,000 trading account. Profit/Loss on recently closed position (precious metals) – is profit/loss we have earned/lost per unit on recently closed position. The amount in USD is calculated on the assumption of suggested position size for USD 10,000 trading account.
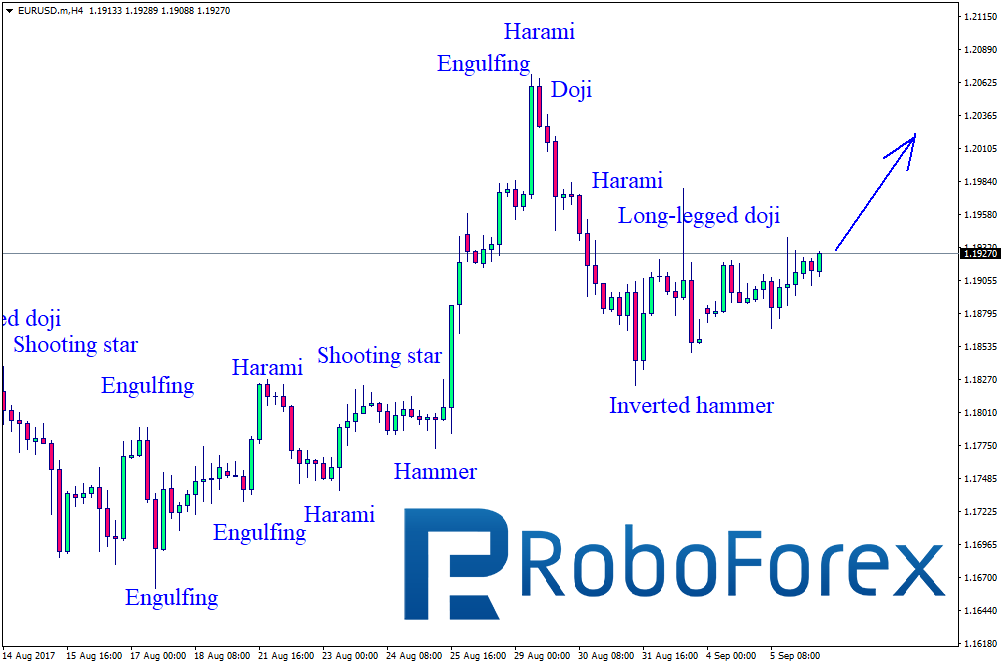
As we can see at the H4 chart, being influenced by the weakening of the USD, the pair completed the correction, formed Harami, Engulfing, Doji, and Long-Legged Doji patterns, and then started moving upwards slowly and breaking bearish signals. At the moment, the upside target is at the resistance level at 1.2060.
XAU USD, “Gold vs US Dollar”
The instrument is still moving upwards. At the H4 chart of XAU USD, the price is constantly forming Hammer, Engulfing, Doji, and Inverted Hammer patterns at the bottoms of the corrections. Right now, the pair is being corrected again. The upside target is at the resistance level at 1356.80.
Attention! Forecasts presented in this section only reflect the author’s private opinion and should not be considered as guidance for trading. RoboForex LP bears no responsibility for trading results based on trading recommendations described in these analytical reviews.