Author Archive for InvestMacro – Page 509

EURUSD: euro rising on the back of a retreat to safe havens

By Gabriel Ojimadu, Alpari

Previous:

On Friday the 1st of September, trading on the euro/dollar pair closed slightly up. Volatility increased after the US jobs report was published. 156,000 new jobs were added in the US outside the agricultural sector in August against a forecast of 180,000. The value for June was revised from 231,000 to 210,000 and for July from 209,000 to 189,000. The aggregate revision for the 2 months amounts to -41,000.

The workforce participation rate remained unchanged at 62.9%. Unemployment rose from 4.3% to 4.4% (forecast: 4.3%). The average hourly earnings index in the US fell from 0.3% to 0.1% (forecast: 0.2%).

This news brought a 70-pip surge for the euro, taking it to 1.1980, although it quickly erased all its gains. The NFP report was weak; I have no doubt about this. The price returned to 1.1890 in response to a Bloomberg article, in which it suggested that the ECB might not make a final decision on next year’s QE program by the end of this year.

Then, negative sentiment on the dollar further subsided due to a strong manufacturing PMI as well as growth in US bond yields. The manufacturing PMI from Markit grew to 58.8, while US 10Y bond yields grew to 2.1744. The euro ended up sliding to 1.1850.

Day’s news (GMT+3):

  • 11:30 Eurozone: Sentix investor confidence (Sep).
  • 11:30 UK: PMI construction (Aug).
  • 12:00 Eurozone: PPI (Jul).

EURUSD rate on the hourly. Source: TradingView

On Monday the 4th of September, trading has opened up on the euro and other currencies. North Korea conducted their 6th nuclear test. The power of the nuclear charge was thought to be up to 100 kilotons; 10 times more powerful than last year’s bomb. As tensions mount once again between the US and North Korea, investors made their retreat to the safe havens (franc, yen, gold).

The euro reacted meekly to this retreat, since on the one hand, the Bloomberg article is piling pressure on buyers, but on the other, there is a national holiday in the US today, and the debt market and stock exchanges are closed.

The finance ministries of the US and Eurozone are discussing new sanctions on North Korea. The Pentagon is assessing it military options. Donald Trump tweeted that the US in considering “stopping all trade with any country doing business with North Korea”.

Since today is Monday, and the economic calendar is empty, the North Korea problem will be the key focus of financial markets. I’m forecasting a flat ranging from 1.1860 to 1.1920. I expect quotes to rise to 1.1920 in the European session, followed by a drop to 1.1860. If the market’s particularly thin, we could see the euro reach 1.1950. Here, we need to keep an eye on crosses with the euro and trading volume as we approach 1.1904 (45 degrees).

The dynamics from 1.1823 to 1.1980 represent a correction of the drop from 1.2070 to 1.1823. If the situation with North Korea continues to deteriorate, we could see the euro drop as far as 1.1750 before the ECB meeting on the 7th of September.

Japanese Candlesticks Analysis 04.09.2017 (USD/CAD, NZD/USD)

Article By RoboForex.com

USD CAD, “US Dollar vs Canadian Dollar”

At the H4 chart of USD CAD, the stable downtrend continues. The pair is falling and forming Hanging Man, Shooting Star, Engulfing, and Doji patterns during pullbacks. After finishing another correction, the pair formed Shooting Star and Engulfing patterns at the top, and, as a result, fell and broke the support level. Right now, the instrument is about to complete another correction before starting a new decline. The downside target is at 1.2222.


NZD USD, “New Zealand Dollar vs. US Dollar”

As we can see at the H4 chart of NZD USD, the price was falling and forming Engulfing, Shooting Star, and Long-Legged Doji reversal patterns during pullbacks, but then stopped at the support level. Right now, the pair is being corrected once again and forming Engulfing and Hanging Man patterns at the top, which means that the instrument may start a new decline and break the support level. The downside target is at 0.7123.


RoboForex Analytical Department

Article By RoboForex.com

Attention!
Forecasts presented in this section only reflect the author’s private opinion and should not be considered as guidance for trading. RoboForex LP bears no responsibility for trading results based on trading recommendations described in these analytical reviews.

COT Report: US Dollar bets more short. Metals, 10YR bets go higher. Crude falls sharply

By CountingPips.com

Here is a short summary and this week’s links (below) to the latest Commitment of Traders changes.

– US Dollar Speculators pushed USD bearish bets higher, USD now down 9 out of 10 weeks

– WTI Crude Oil Speculator bets decline for 4th week, bets now under +400,000 net position

– 10-Year Note Speculators bullish bets rise for 2nd week, above the +250,000 contract level

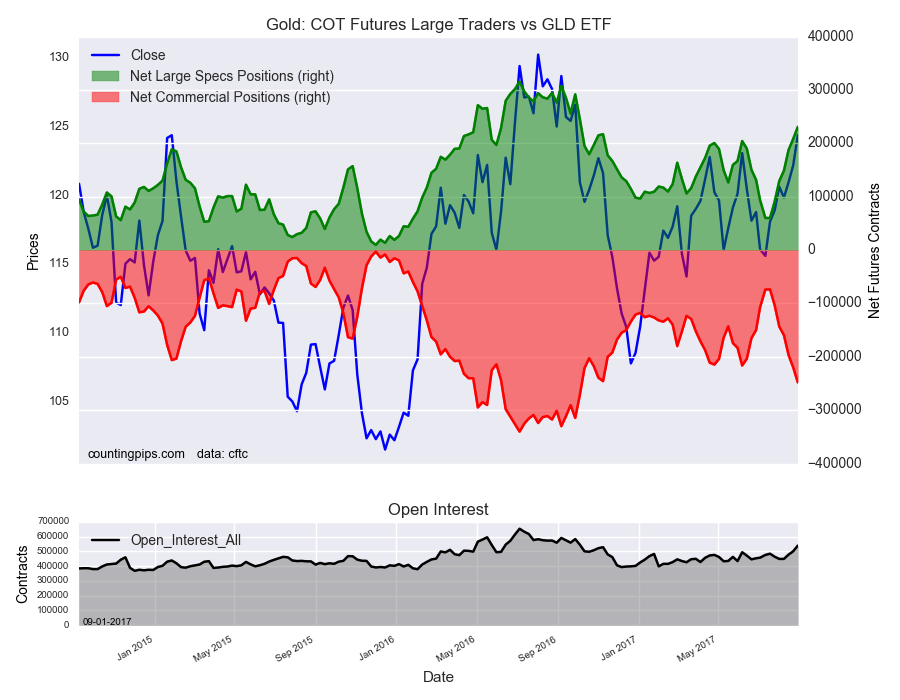
– Gold spec bets continue higher for 6th straight week, best since October 4th 2016

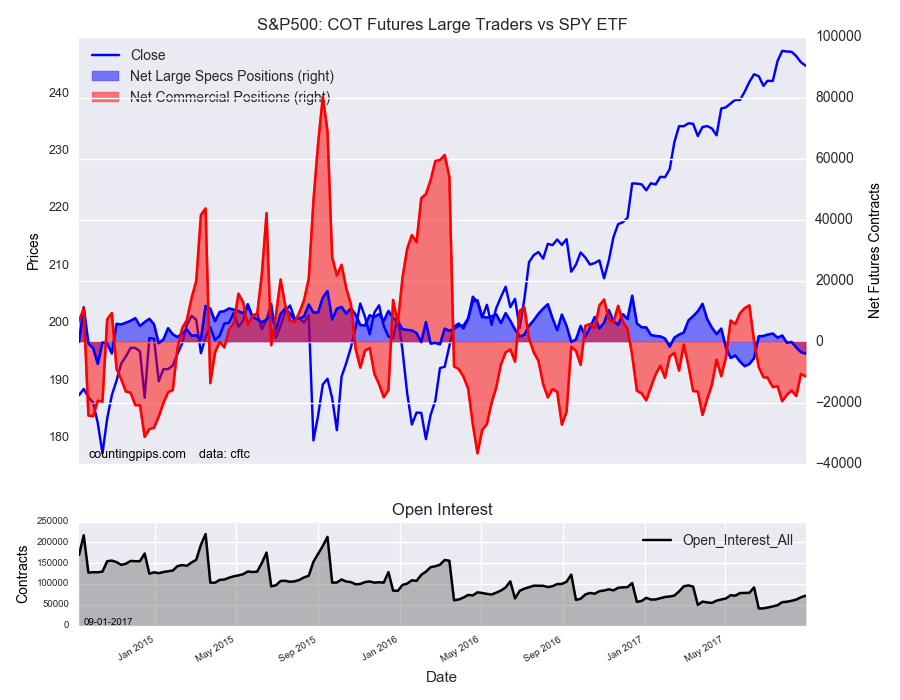
– Large S&P500 Speculators pushed bearish bets higher for 3rd week, most bearish since June 13th

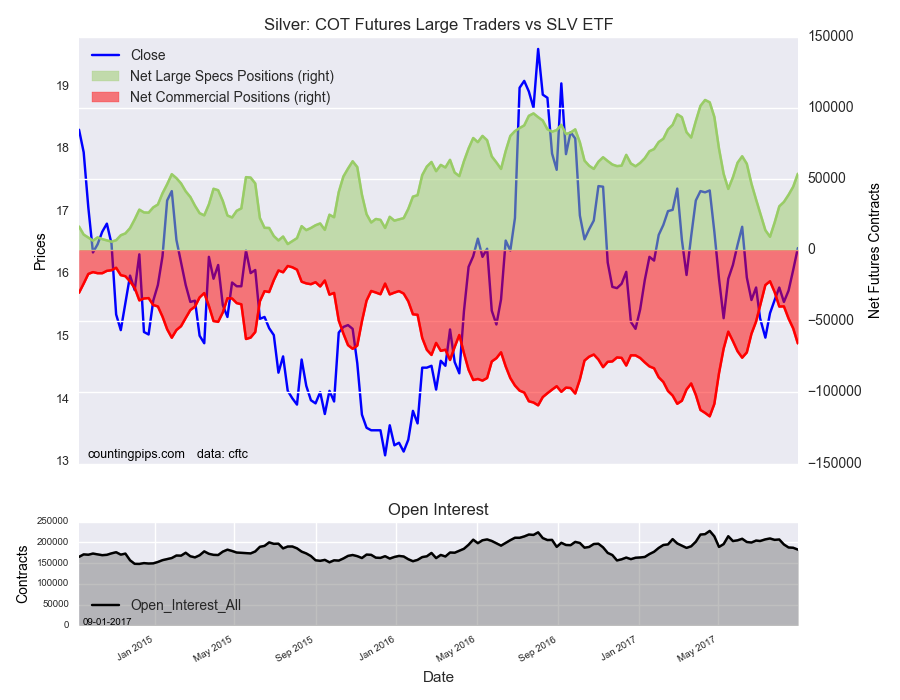
– Silver Speculator bets gain for 6th consecutive week, highest since June 13th

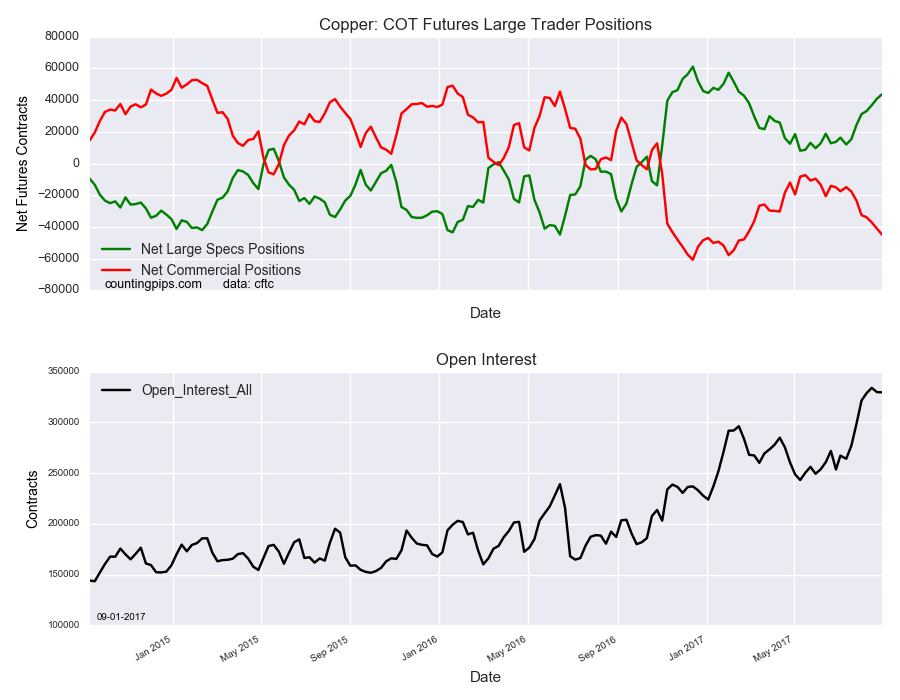
– Copper bets keep rising, up now for 7th week in a row, high since February 14th


Forex Speculators again raised their bearish US Dollar positions this week

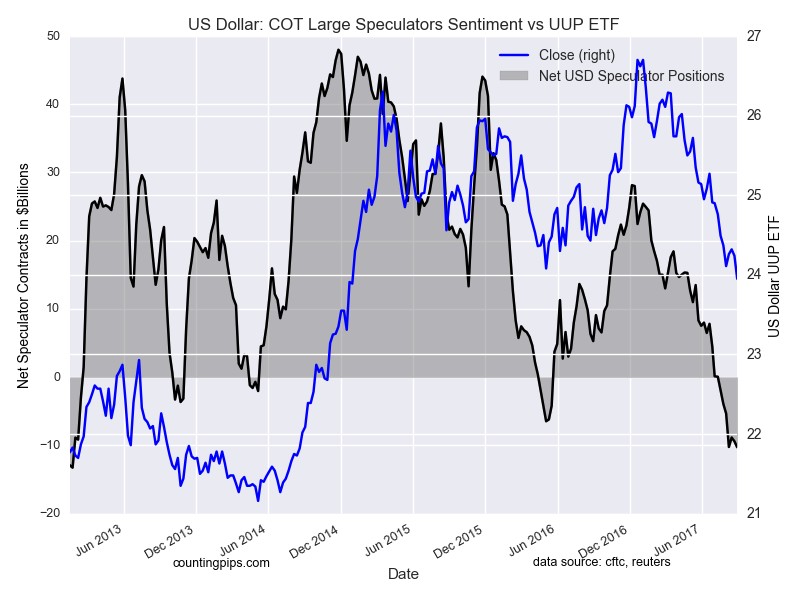
US Dollar net speculator positions leveled at $-10.28 billion as of Tuesday

The latest data for the weekly Commitment of Traders (COT) report, released by the Commodity Futures Trading Commission (CFTC) on Friday, showed that large traders and currency speculators continued to increase their bearish bets for the US dollar this week. See full article


WTI Crude Oil Speculators sharply dropped their bullish bets this week

The non-commercial contracts of WTI crude futures totaled a net position of 365,865 contracts, according to data from last week. This was a slide of -79,583 contracts from the previous weekly total. See full article


Gold Speculators boosted bullish net positions to highest in almost a year

The large speculator contracts of gold futures totaled a net position of 231,047 contracts. This was a weekly advance of 22,609 contracts from the previous week. See full article


10-Year Note Speculators advanced their bullish net positions for 2nd week

The large speculator contracts of 10-year treasury note futures totaled a net position of 283,719 contracts. This was a weekly increase of 22,474 contracts from the previous week. See full article


Large S&P500 Speculators raised their bearish positions for 3rd week

The large speculator contracts of S&P 500 futures totaled a net position of -3,955 contracts. This was a decrease of -486 contracts from the reported data of the previous week. See full article


Silver Speculators once again pushed bullish net positions higher

The non-commercial contracts of silver futures totaled a net position of 53,645 contracts, according to data from last week. This was a weekly gain of 9,099 contracts from the previous totals. See full article


Copper Speculators raise bullish net positions for 7th straight week

The large speculator contracts of copper futures totaled a net position of 43,652 contracts. This was a weekly boost of 2,806 contracts from the data of the previous week. See full article


Article by CountingPips.com

The Commitment of Traders report data is published in raw form every Friday by the Commodity Futures Trading Commission (CFTC) and shows the futures positions of market participants as of the previous Tuesday (data is reported 3 days behind).

To learn more about this data please visit the CFTC website at http://www.cftc.gov/MarketReports/CommitmentsofTraders/index.htm


Forex Speculators again raised their bearish US Dollar positions this week

By CountingPips.comGet our weekly COT Reports by Email

US Dollar net speculator positions declined to $-10.28 billion this week

The latest data for the weekly Commitment of Traders (COT) report, released by the Commodity Futures Trading Commission (CFTC) on Friday, showed that large traders and currency speculators continued to increase their bearish bets for the US dollar this week.

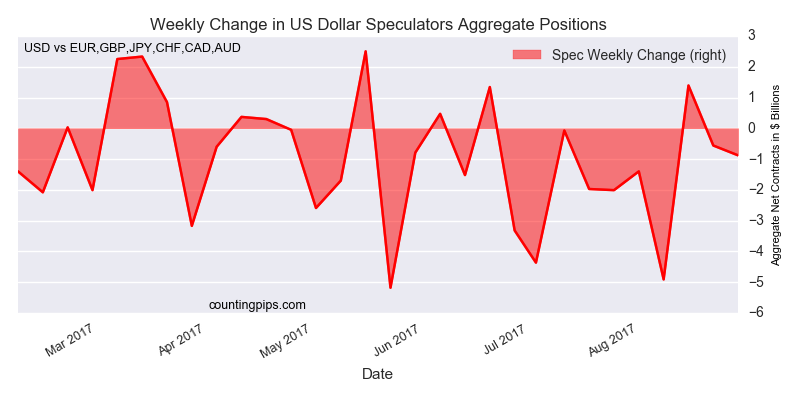
Non-commercial large futures traders, including hedge funds and large speculators, had an overall US dollar short position totaling $-10.28 billion as of Tuesday August 29th, according to the latest data from the CFTC and dollar amount calculations by Reuters. This was a weekly decline of $-0.88 billion from the $-9.4 billion total short position that was registered the previous week, according to the Reuters calculation (totals of the US dollar contracts against the combined contracts of the euro, British pound, Japanese yen, Australian dollar, Canadian dollar and the Swiss franc).

The decline in the aggregate dollar position marks the ninth time out of the last ten weeks that speculator bets for the dollar have fallen. The current dollar position is now at the most bearish level since January 22nd of 2013 when the short position totaled $-13.26 billion.


Weekly Speculator Contract Changes:

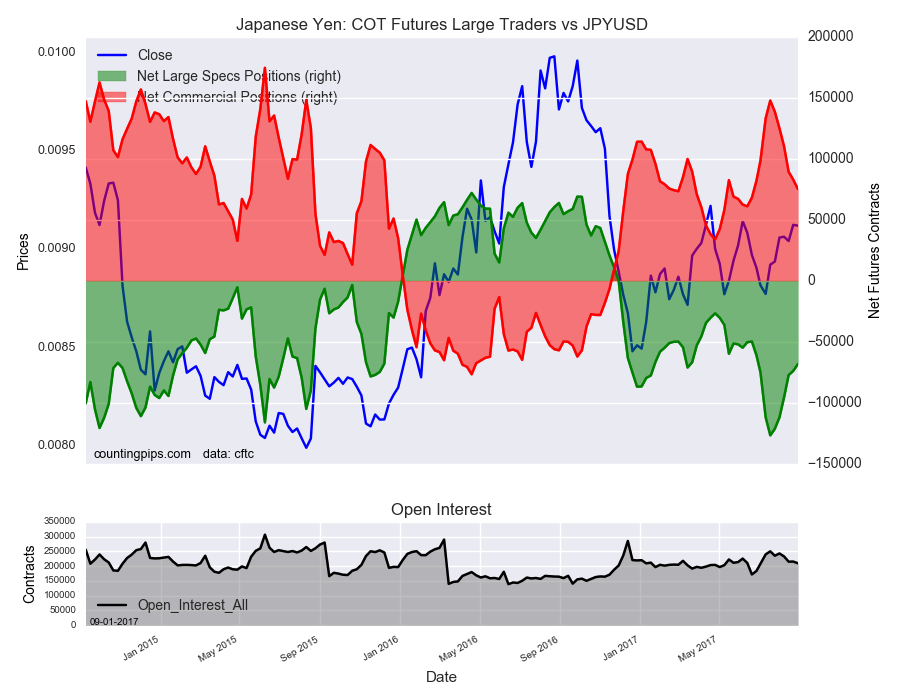
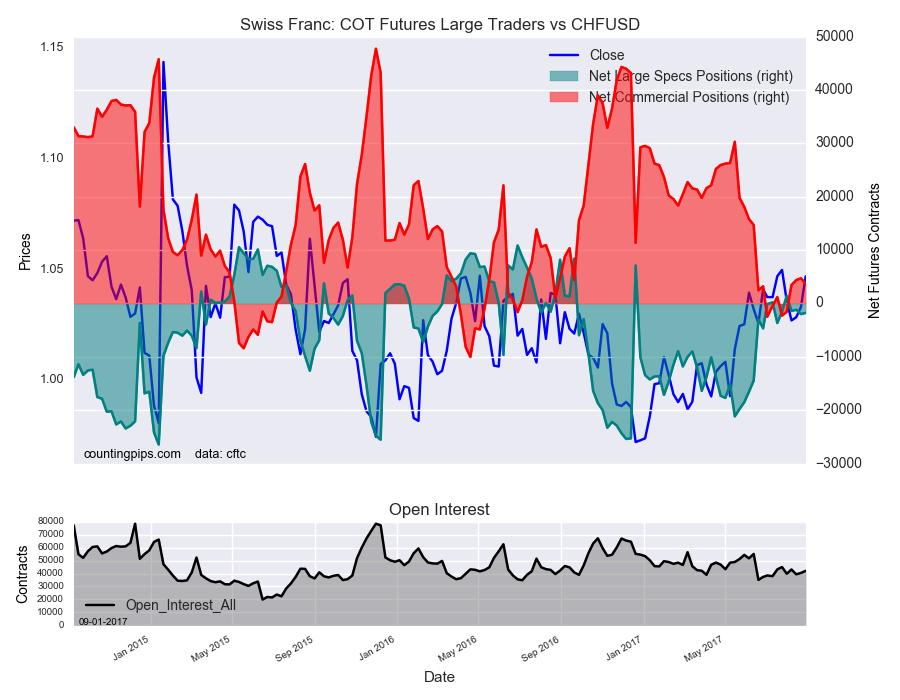
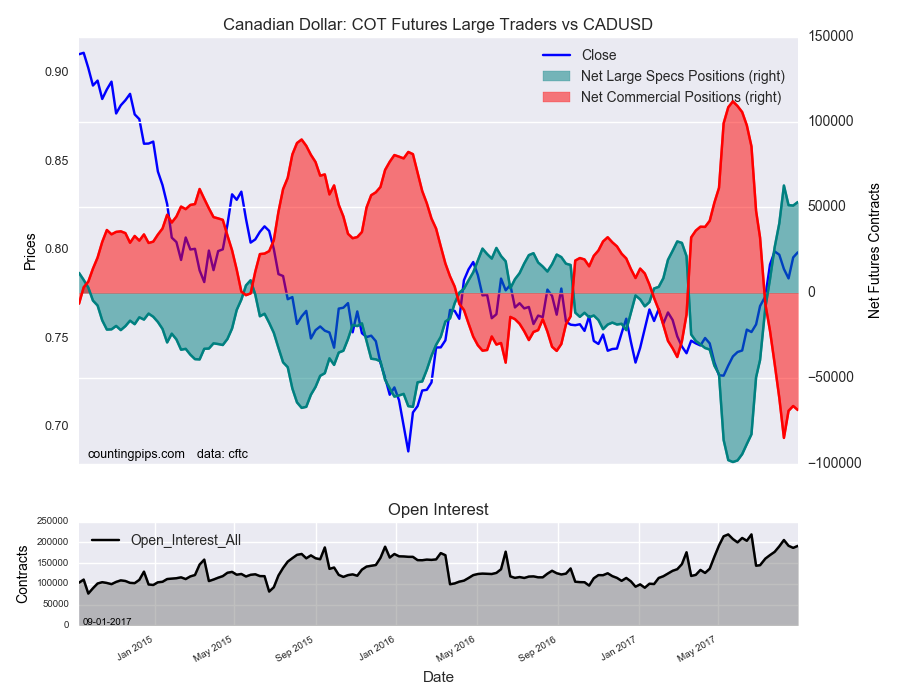
The major currencies that rose against the US dollar last week were the Japanese yen (5,562 weekly change in contracts), Swiss franc (209 contracts), Canadian dollar (2,068 contracts) and the Australian dollar (6,043 contracts).

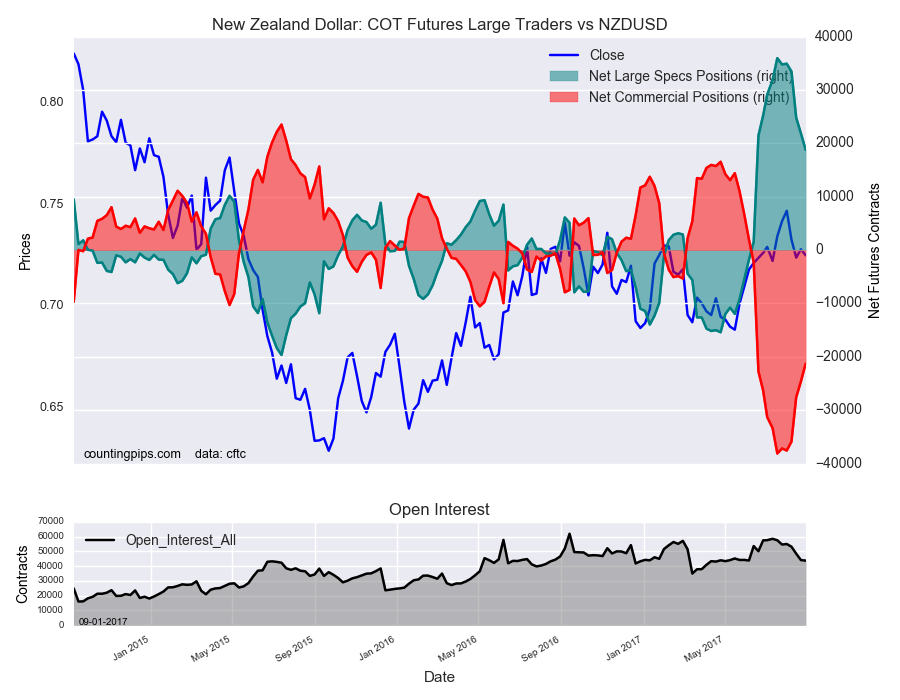
The currencies whose speculative bets fell last week versus the dollar were the euro (-1,457 weekly change in contracts), British pound sterling (-5,655 contracts), New Zealand dollar (-3,078 contracts) and the Mexican peso (-608 contracts).


Table of Weekly Commercial Traders and Speculators Levels & Changes:

CurrencyNet CommercialsComms Weekly ChgNet SpeculatorsSpecs Weekly Chg
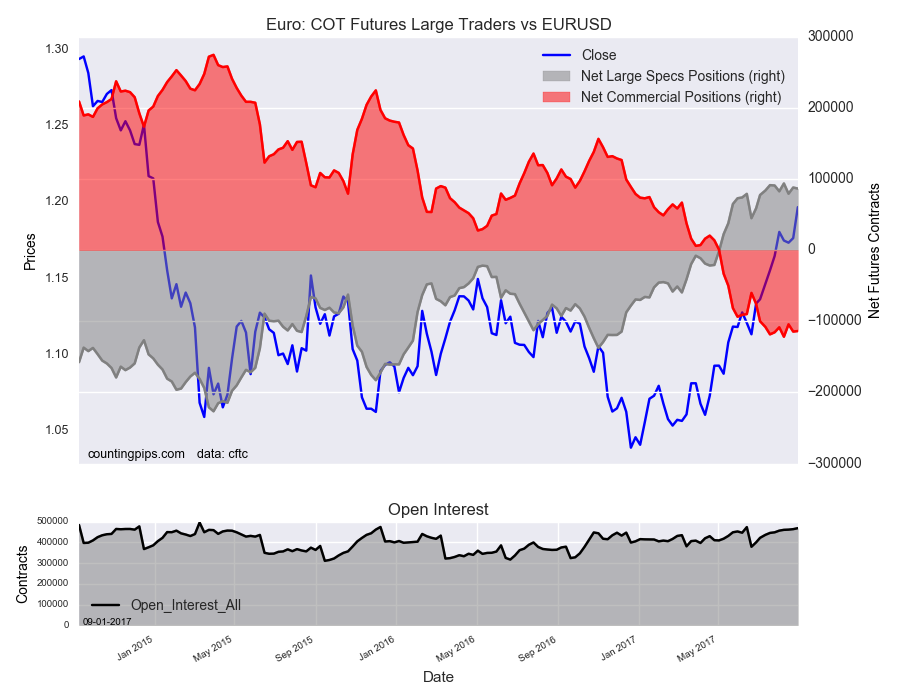
EuroFx-113,76076686,519-1,457
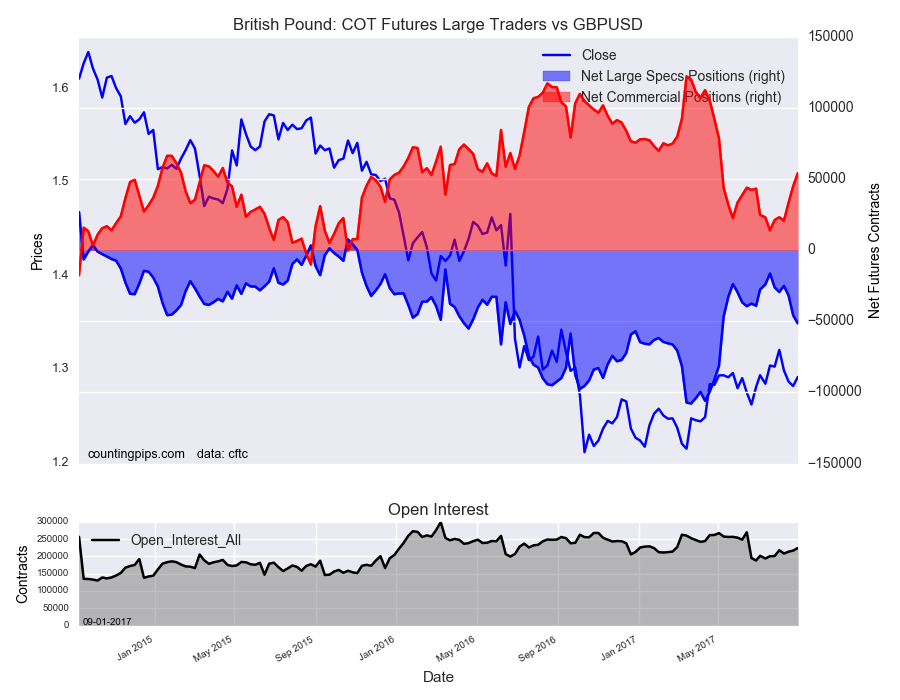
GBP54,1419,148-51,555-5,655
JPY75,204-7,587-68,5245,562
CHF3,703-1,035-1,778209
CAD-68,676-2,37053,1672,068
AUD-81,414-5,54266,5276,043
NZD-21,3043,31618,804-3,078
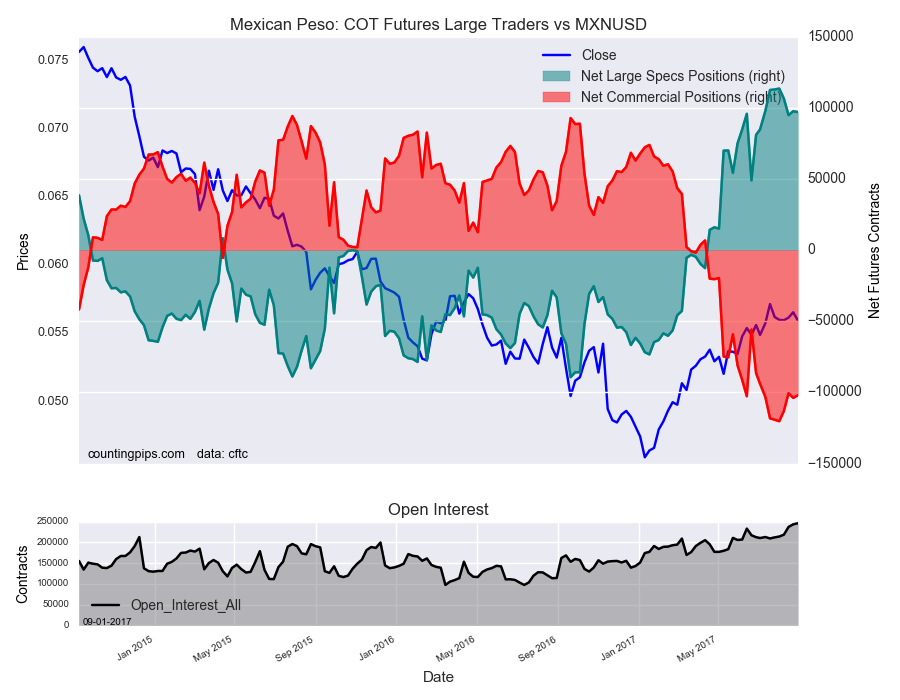
MXN-102,0271,84597,010-608


This latest COT data is through Tuesday and shows a quick view of how large speculators or non-commercials (for-profit traders) as well as the commercial traders (hedgers & traders for business purposes) were positioned in the futures markets. All currency positions are in direct relation to the US dollar where, for example, a bet for the euro is a bet that the euro will rise versus the dollar while a bet against the euro will be a bet that the dollar will gain versus the euro.


Weekly Charts: Large Trader Weekly Positions vs Price

EuroFX:


British Pound Sterling:


Japanese Yen:


Swiss Franc:


Canadian Dollar:


Australian Dollar:


New Zealand Dollar:


Mexican Peso:

*COT Report: The weekly commitment of traders report summarizes the total trader positions for open contracts in the futures trading markets. The CFTC categorizes trader positions according to commercial hedgers (traders who use futures contracts for hedging as part of the business), non-commercials (large traders who speculate to realize trading profits) and nonreportable traders (usually small traders/speculators). Find CFTC criteria here: (http://www.cftc.gov/MarketReports/CommitmentsofTraders/ExplanatoryNotes/index.htm).

The Commitment of Traders report is published every Friday by the Commodity Futures Trading Commission (CFTC) and shows futures positions data that was reported as of the previous Tuesday (3 days behind).

Each currency contract is a quote for that currency directly against the U.S. dollar, a net short amount of contracts means that more speculators are betting that currency to fall against the dollar and a net long position expect that currency to rise versus the dollar.

(The charts overlay the forex closing price of each Tuesday when COT trader positions are reported for each corresponding spot currency pair.) See more information and explanation on the weekly COT report from the CFTC website.

Article by CountingPips.com


WTI Crude Oil Speculators sharply dropped their bullish bets this week

By CountingPips.comReceive our weekly COT Reports by Email

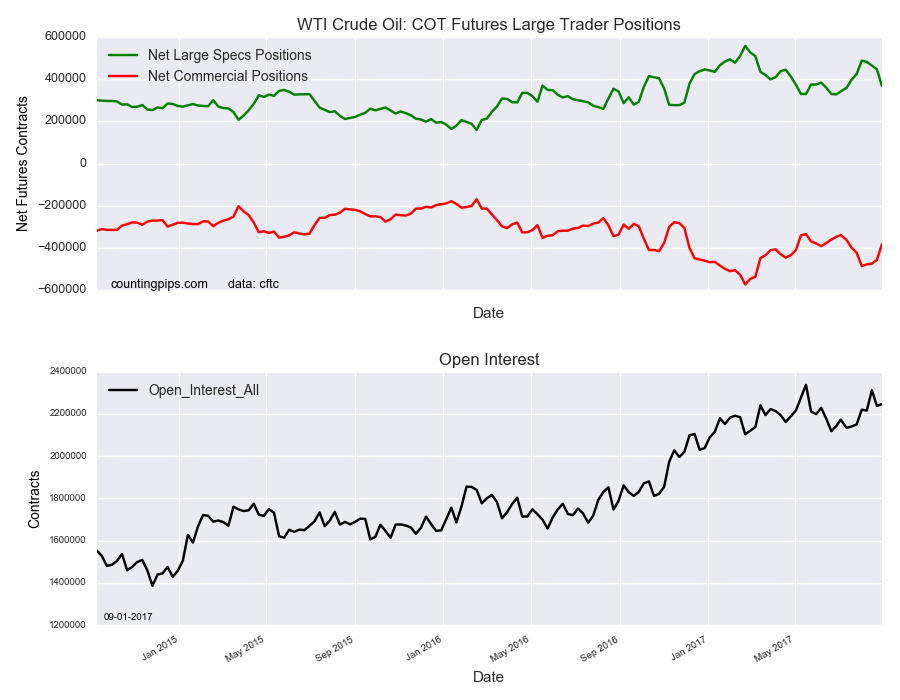
WTI Crude Oil Non-Commercial Speculator Positions:

Large oil speculators sharply cut back on their bullish net positions in the WTI Crude Oil futures markets this week, according to the latest Commitment of Traders (COT) data released by the Commodity Futures Trading Commission (CFTC) on Friday.

The non-commercial futures contracts of WTI Crude Oil futures, traded by large speculators and hedge funds, totaled a net position of 365,865 contracts in the data reported through Tuesday August 29th. This was a weekly fall of -79,583 contracts from the previous week which had a total of 445,448 net contracts.

Speculative positions have fallen for four straight weeks and have now declined to the lowest standing since July 11th when positions totaled +358,025 contracts. The last four weeks have seen a total drop of -120,900 net contracts and have brought the net position under the +400,000 contract level for the first time in six weeks.

WTI Crude Oil Commercial Positions:

The commercial traders position, categorized by the CFTC as hedgers or traders engaged in buying and selling for business purposes, totaled a net position of -381,180 contracts on the week. This was a weekly uptick of 74,686 contracts from the total net of -455,866 contracts reported the previous week.

USO:

Over the same weekly reporting time-frame, from Tuesday to Tuesday, the USO Crude Oil ETF, which tracks the price of WTI crude oil, closed at approximately $9.46 which was a fall of $-0.31 from the previous close of $9.77, according to unofficial market data.

*COT Report: The COT data, released weekly to the public each Friday, is updated through the most recent Tuesday (data is 3 days old) and shows a quick view of how large speculators or non-commercials (for-profit traders) as well as the commercial traders (hedgers & traders for business purposes) were positioned in the futures markets. The CFTC categorizes trader positions according to commercial hedgers (traders who use futures contracts for hedging as part of the business), non-commercials (large traders who speculate to realize trading profits) and nonreportable traders (usually small traders/speculators). Find CFTC criteria here: (http://www.cftc.gov/MarketReports/CommitmentsofTraders/ExplanatoryNotes/index.htm).

Article by CountingPips.comWeekly COT Report

10-Year Note Speculators advanced their bullish net positions for 2nd week

By CountingPips.comReceive our weekly COT Reports by Email

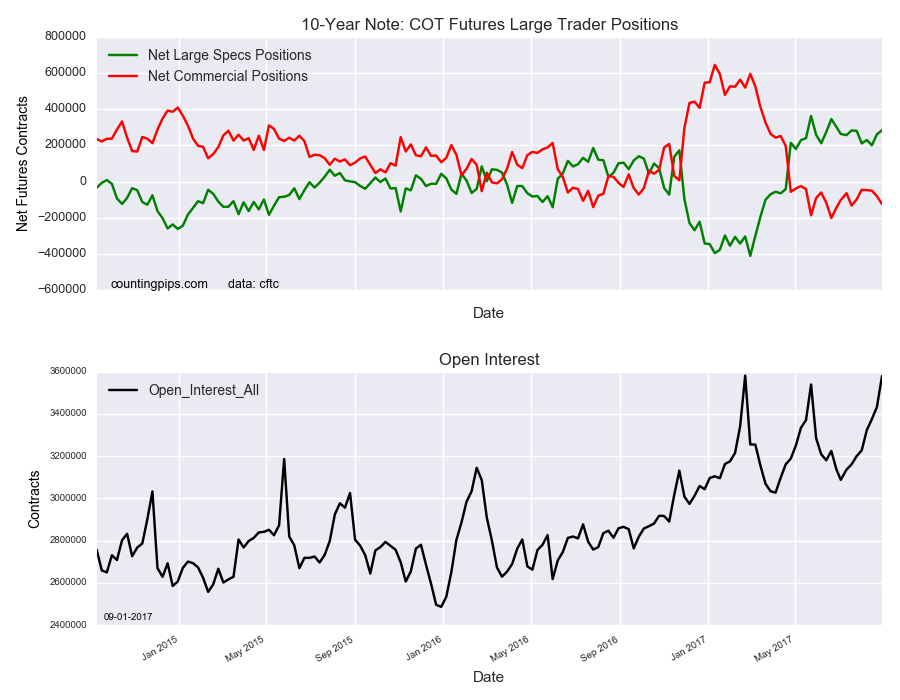
10-Year Note Non-Commercial Speculator Positions:

Large bond speculators lifted their bullish net positions in the 10-Year Note futures markets this week, according to the latest Commitment of Traders (COT) data released by the Commodity Futures Trading Commission (CFTC) on Friday.

The non-commercial futures contracts of 10-Year Note futures, traded by large speculators and hedge funds, totaled a net position of 283,719 contracts in the data reported through Tuesday August 29th. This was a weekly rise of 22,474 contracts from the previous week which had a total of 261,245 net contracts.

Speculative bets have gained for a second consecutive week to the highest level since June 27th when net positions totaled +302,098 contracts and are now above the +250,000 contract level for a second straight week as well.

10-Year Note Commercial Positions:

The commercial traders position, categorized by the CFTC as hedgers or traders engaged in buying and selling for business purposes, totaled a net position of -123,701 contracts on the week. This was a weekly decline of -43,398 contracts from the total net of -80,303 contracts reported the previous week.

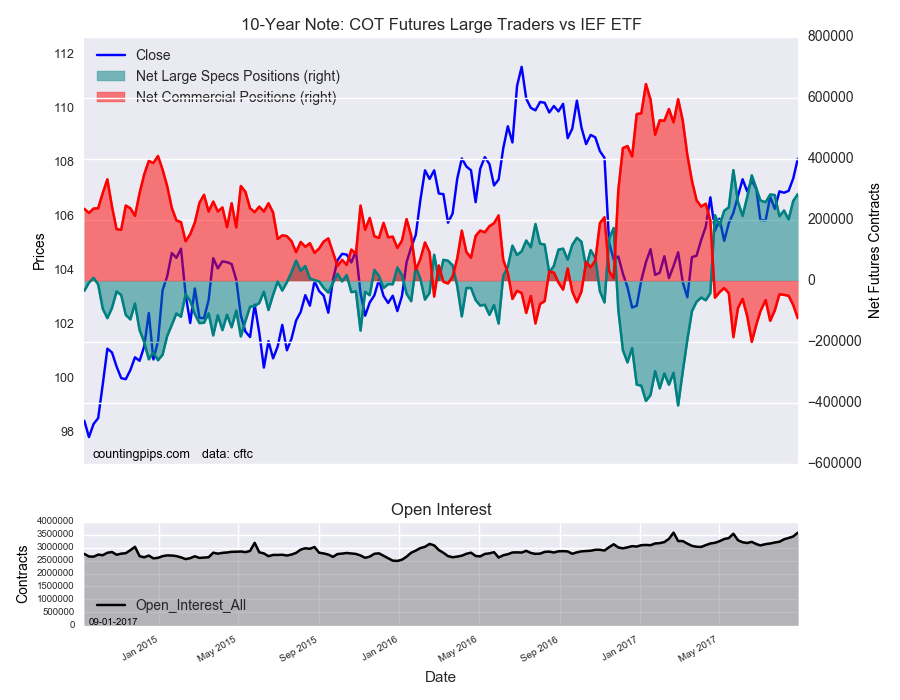
IEF ETF:

Over the same weekly reporting time-frame, from Tuesday to Tuesday, the 7-10 Year Treasury Bond ETF (IEF) closed at approximately $108.16 which was an advance of $0.73 from the previous close of $107.43, according to unofficial market data.

*COT Report: The COT data, released weekly to the public each Friday, is updated through the most recent Tuesday (data is 3 days old) and shows a quick view of how large speculators or non-commercials (for-profit traders) as well as the commercial traders (hedgers & traders for business purposes) were positioned in the futures markets. The CFTC categorizes trader positions according to commercial hedgers (traders who use futures contracts for hedging as part of the business), non-commercials (large traders who speculate to realize trading profits) and nonreportable traders (usually small traders/speculators). Find CFTC criteria here: (http://www.cftc.gov/MarketReports/CommitmentsofTraders/ExplanatoryNotes/index.htm).

Article by CountingPips.comWeekly COT Report


Gold Speculators boosted bullish net positions to highest in almost a year

By CountingPips.comReceive our weekly COT Reports by Email

Gold Non-Commercial Speculator Positions:

Large precious metal speculators continued to beef up their bullish net positions in the Gold futures markets this week, according to the latest Commitment of Traders (COT) data released by the Commodity Futures Trading Commission (CFTC) on Friday.

The non-commercial futures contracts of Gold futures, traded by large speculators and hedge funds, totaled a net position of 231,047 contracts in the data reported through Tuesday August 29th. This was a weekly gain of 22,609 contracts from the previous week which had a total of 208,438 net contracts.

The speculative bets have sharply gained for six straight weeks and by a total of +170,909 contracts over that time to the highest overall net position since October 4th of 2016 when net bullish bets totaled +245,508 contracts.

Gold Commercial Positions:

The commercial traders position, categorized by the CFTC as hedgers or traders engaged in buying and selling for business purposes, totaled a net position of -248,029 contracts on the week. This was a weekly decrease of -28,111 contracts from the total net of -219,918 contracts reported the previous week.

GLD ETF:

Over the same weekly reporting time-frame, from Tuesday to Tuesday, the GLD ETF, which tracks the price of gold, closed at approximately $124.42 which was an increase of $2.21 from the previous close of $122.21, according to unofficial market data.

*COT Report: The COT data, released weekly to the public each Friday, is updated through the most recent Tuesday (data is 3 days old) and shows a quick view of how large speculators or non-commercials (for-profit traders) as well as the commercial traders (hedgers & traders for business purposes) were positioned in the futures markets. The CFTC categorizes trader positions according to commercial hedgers (traders who use futures contracts for hedging as part of the business), non-commercials (large traders who speculate to realize trading profits) and nonreportable traders (usually small traders/speculators). Find CFTC criteria here: (http://www.cftc.gov/MarketReports/CommitmentsofTraders/ExplanatoryNotes/index.htm).

Article by CountingPips.comWeekly COT Report

Large S&P500 Speculators raised their bearish positions for 3rd week

By CountingPips.comReceive our weekly COT Reports by Email

S&P500 Non-Commercial Speculator Positions:

Large speculators increased their bets against the S&P500 futures again this week, according to the latest Commitment of Traders (COT) data released by the Commodity Futures Trading Commission (CFTC) on Friday.

The non-commercial futures contracts of S&P500 futures, traded by large speculators and hedge funds, totaled a net position of -3,955 contracts in the data reported through Tuesday August 29th. This was a weekly lowering of -486 contracts from the previous week which had a total of -3,469 net contracts.

Speculators have now increased their bearish positions for a third straight week and the overall bearish level is at the most bearish stance since June 13th when net positions totaled -5,466 contracts.

S&P500 Commercial Positions:

The commercial traders position, categorized by the CFTC as hedgers or traders engaged in buying and selling for business purposes, totaled a net position of -11,430 contracts on the week. This was a weekly decline of -821 contracts from the total net of -10,609 contracts reported the previous week.

SPY ETF:

Over the same weekly reporting time-frame, from Tuesday to Tuesday, the SPY ETF, which tracks the price of S&P500 Index, closed at approximately $244.85 which was a decrease of $-0.59 from the previous close of $245.44, according to unofficial market data.

*COT Report: The COT data, released weekly to the public each Friday, is updated through the most recent Tuesday (data is 3 days old) and shows a quick view of how large speculators or non-commercials (for-profit traders) as well as the commercial traders (hedgers & traders for business purposes) were positioned in the futures markets. The CFTC categorizes trader positions according to commercial hedgers (traders who use futures contracts for hedging as part of the business), non-commercials (large traders who speculate to realize trading profits) and nonreportable traders (usually small traders/speculators). Find CFTC criteria here: (http://www.cftc.gov/MarketReports/CommitmentsofTraders/ExplanatoryNotes/index.htm).

Article by CountingPips.comWeekly COT Report


Silver Speculators once again pushed bullish net positions higher

By CountingPips.comReceive our weekly COT Reports by Email

Silver Non-Commercial Speculator Positions:

Large speculators raised their bullish net positions in the Silver futures markets this week, according to the latest Commitment of Traders (COT) data released by the Commodity Futures Trading Commission (CFTC) on Friday.

The non-commercial futures contracts of Silver futures, traded by large speculators and hedge funds, totaled a net position of 53,645 contracts in the data reported through Tuesday August 29th. This was a weekly gain of 9,099 contracts from the previous week which had a total of 44,546 net contracts.

Silver speculative positions have risen for six straight weeks (by a total of +44,269 contracts over that time) and are now at the highest level since June 13th when net positions totaled +60,658 contracts.

Silver Commercial Positions:

The commercial traders position, categorized by the CFTC as hedgers or traders engaged in buying and selling for business purposes, totaled a net position of -65,588 contracts on the week. This was a weekly decline of -10,539 contracts from the total net of -55,049 contracts reported the previous week.

SLV ETF:

Over the same weekly reporting time-frame, from Tuesday to Tuesday, the SLV ishares ETF, which tracks the price of silver, closed at approximately $16.42 which was an advance of $0.35 from the previous close of $16.07, according to unofficial market data.

*COT Report: The COT data, released weekly to the public each Friday, is updated through the most recent Tuesday (data is 3 days old) and shows a quick view of how large speculators or non-commercials (for-profit traders) as well as the commercial traders (hedgers & traders for business purposes) were positioned in the futures markets. The CFTC categorizes trader positions according to commercial hedgers (traders who use futures contracts for hedging as part of the business), non-commercials (large traders who speculate to realize trading profits) and nonreportable traders (usually small traders/speculators). Find CFTC criteria here: (http://www.cftc.gov/MarketReports/CommitmentsofTraders/ExplanatoryNotes/index.htm).

Article by CountingPips.comWeekly COT Report


Copper Speculators raise bullish net positions for 7th straight week

By CountingPips.comReceive our weekly COT Reports by Email

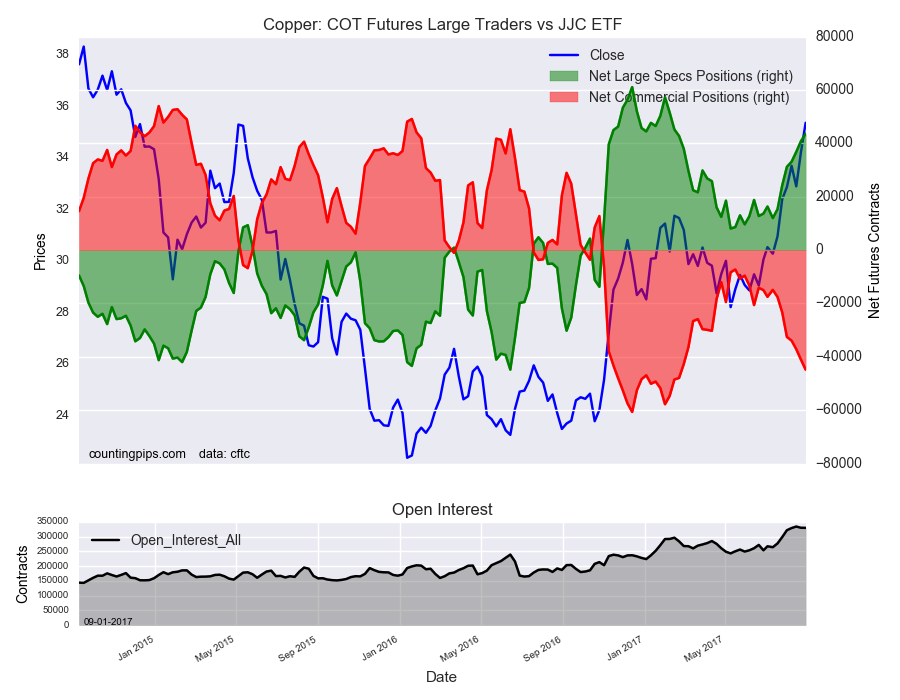
Copper Non-Commercial Speculator Positions:

Large speculators continued to boost their net positions in the Copper futures markets this week, according to the latest Commitment of Traders (COT) data released by the Commodity Futures Trading Commission (CFTC) on Friday.

The non-commercial futures contracts of Copper futures, traded by large speculators and hedge funds, totaled a net position of 43,652 contracts in the data reported through Tuesday August 29th. This was a weekly advance of 2,806 contracts from the previous week which had a total of 40,846 net contracts.

The rise in speculative positions was the seventh straight weekly gain and pushes the net position to the highest bullish level since February 14th when the standing was +45,243 contracts.

Copper Commercial Positions:

The commercial traders position, categorized by the CFTC as hedgers or traders engaged in buying and selling for business purposes, totaled a net position of -44,826 contracts on the week. This was a weekly fall of -3,764 contracts from the total net of -41,062 contracts reported the previous week.

JJC ETF:

Over the same weekly reporting time-frame, from Tuesday to Tuesday, the JJC iPath Bloomber Copper ETN, which tracks the price of copper, closed at approximately $35.38 which was a gain of $1.14 from the previous close of $34.24, according to unofficial market data.

*COT Report: The COT data, released weekly to the public each Friday, is updated through the most recent Tuesday (data is 3 days old) and shows a quick view of how large speculators or non-commercials (for-profit traders) as well as the commercial traders (hedgers & traders for business purposes) were positioned in the futures markets. The CFTC categorizes trader positions according to commercial hedgers (traders who use futures contracts for hedging as part of the business), non-commercials (large traders who speculate to realize trading profits) and nonreportable traders (usually small traders/speculators). Find CFTC criteria here: (http://www.cftc.gov/MarketReports/CommitmentsofTraders/ExplanatoryNotes/index.htm).

Article by CountingPips.comWeekly COT Report