Author Archive for InvestMacro – Page 469

OPEC Will Extend The Cut

By OilPrice.com

There will be an OPEC deal extension—no matter the public tussling between opposing forces in the industry cartel—if the world’s largest oil producers are really determined to end the supply glut.

A failure to agree on the market remediation would cause oil prices to plummet immediately, forfeiting any gains that have been made in the last year.

Saudi Arabia needs $60 per barrel for its Aramco initial public offering to be a success in the second half of next year. It plans to sell just five percent of its prized company in the largest IPO in financial history, but a low price could force the country to sell a larger share, siphoning off government revenues at a time of strained budgets.

Aramco’s IPO is important not just for Saudi Arabia’s non-oil future. As one of the world’s most efficient and low-cost oil producers, its longevity can be seen as an indicator of how the larger industry will fare. An unstable oil price—fueled by the indecisiveness of OPEC members—will trigger an extended period of low oil prices as demand continues to grow. In the short to medium term, this will heighten demand as consumers in the market for new cars will likely put off buying expensive hybrid or electric cars due to the plethora of cheap fuel. Similarly, the pace of natural gas and renewables adoption by utilities companies will slow as oil floods the markets.

Pushed to the edge, the leanest oil companies will buy out their bankrupt contemporaries, continuing the consolidation trend that has dominated the sector over the past two years. But in the long run, dwindling exploration budgets should stagnate the industry’s development.

None of this would correspond to an ideal situation for any of the OPEC countries. All members are charting their economy’s course out of oil. The Gulf is using its savings, stored in huge sovereign wealth funds, to retrain its workforce, build industrial cities, and find a new niche. Algeria, Venezuela, and Nigeria are suffering through the political blowback of years of corruption and mismanagement. Their civilian populations ask where decades of oil profits are now. They question how their nations fell so deep into the oil curse and demand change—whether economic or political.

Prices need to rise for these governments to afford wars against terrorist groups in the region (Boko Haram for Nigeria), medical supplies for its ill citizens (Venezuela), and salaries for the massive public workforce (Algeria).

For some countries, the final years of oil’s dominance in world energy markets will fund the diversification of over-dependent yet semi-developed countries (Saudi Arabia, the UAE, Kuwait, and Qatar). In other cases, it will spell the end of entrenched corruption (Algeria, Nigeria, Venezuela, Angola) or provide the capital to reconstruct entire cities torn by years of conflict or sanctions (Iraq, Iran, Libya).

The world’s top oil and gas exporters know their trophy commodity’s days are numbered. They are in search of anything that will allow the last of the glory days to be as profitable as possible, and a ‘no deal’ on an extension agreement simply won’t cut it.

“We’re in extensive consultations with all our colleagues around the world within and outside OPEC and we can’t make any statements at this stage until we get to Vienna [at the end of the month],” Saudi Oil Minister Khalid al-Falih told reporters coyly last week. “Everybody wants to call it the right way, but stay tuned and you’ll find out when I find out in Vienna.”

Consider al-Falih a fan of the will-they-won’t-they romance between OPEC and its commitments. All political and economic incentives, however, point toward a green-light for an extension.

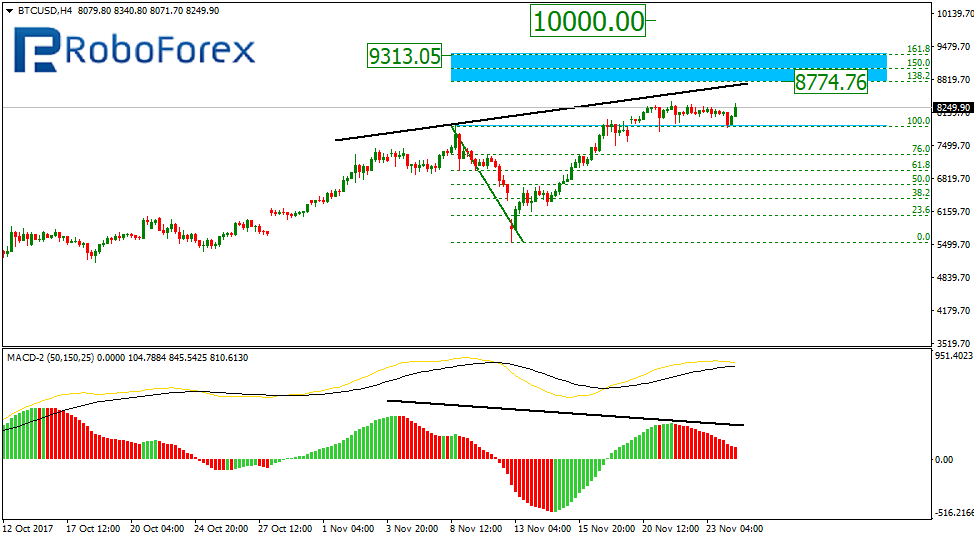
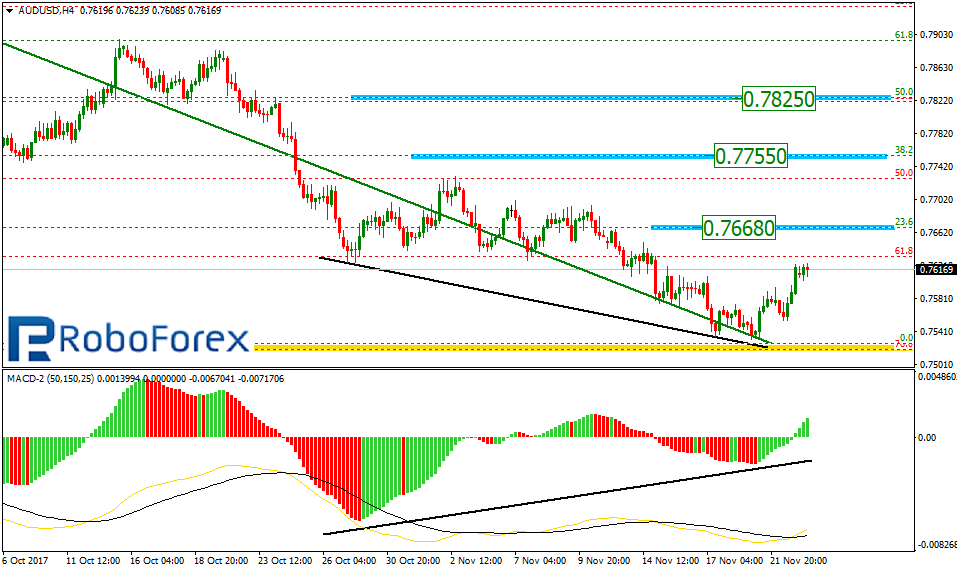
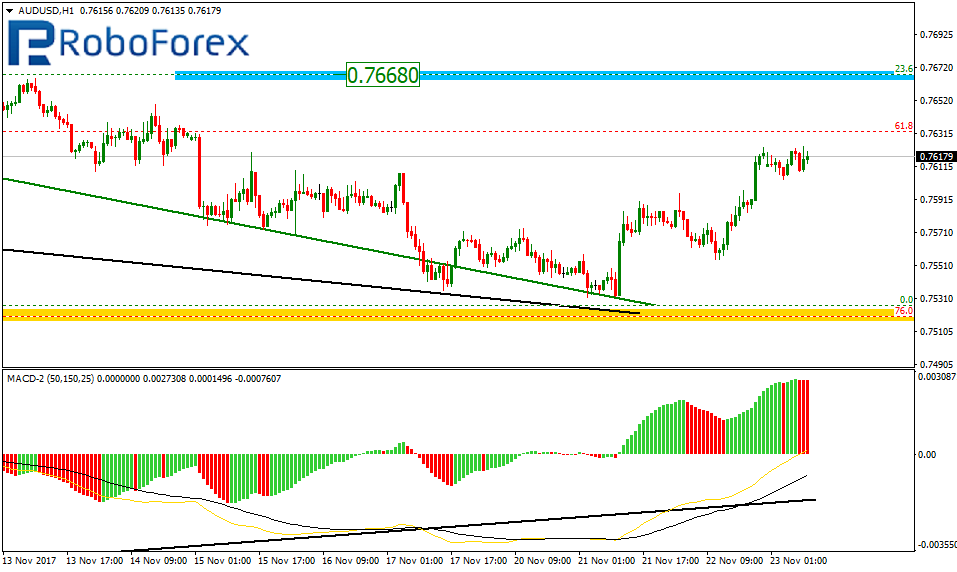
To keep a closer eye on all of OPEC’s oil prices as this situation develops, you can check out our Oil Price Charts page.

Link to original article: https://oilprice.com/Energy/Crude-Oil/OPEC-Will-Extend-The-Cut.html

By Zainab Calcuttawala for Oilprice.com


How to Tap into the Wisdom of the Crowd to Direct Your Trading

By Adinah Brown

“The Trend is Your Friend”. Five simple words that essentially mean the world to anyone who risks their own or their company’s money when trading in the international financial markets. The real challenge is deciding on which direction the market is trending before you “place your bet”.

Traders use a variety of techniques to give them a sense of future market direction – a financial “tap the barometer” cue. These techniques range from the analysis of market fundamentals and statistical data analysis, often called “fundamental” analysis. Still others, not necessarily mutually exclusively, turn to price charts and computer analysis of pure market price movements. This second type of barometer tapping is termed “technical” analysis. Both forms of market direction analysis are valid, although each has its steadfast proponents who are quick to decry the value of the other team.

A third form of analysis, and possibly one larger than either fundamental or technical analysis is “sentiment” analysis. This essentially involves opinion polls taken from market traders, bankers, businessmen, and others affected by the current and future directions of financial market movements. Sentiment analysis ranges from straw polls to broad surveys performed on many of the key players in the market.

Of course, if there was one form of analysis that worked better than all the others, then everyone would probably be using it, and that would likely lead to an efficient, illiquid, and non-performing market environment. The fact that there is no one method that is superior to any other means that markets are inefficient and therefore provide the opportunity for traders and investors to take advantage of those analysis differentiations to make money.

The one factor that each of these analysis tools has in common is that they are “crowd following”. The greatest amount of money that anyone can make from a market movement is to spot the trend early, and sell out just before it turns. The problem with most forms of analysis is that by the time they provide their signals, the major market movement has already taken place and the opportunity to profit from the move is almost over. Worse still, the late opportunists may take up their positions only to find that the market then moves against them as a new trend builds in the opposite direction.

The best indicator of all is certainly to follow what is called “smart money”. These are the vast sums of cash thrown into and taken out of markets by huge insurance and investment funds, normally on the basis of future anticipated fundamental analysis. Catch one of those moves in time, and you’re “quids-in”. Of course, unless you are working for one of these funds and have insider information of your company’s future market activity, then the best way to follow the smart money is to use sensitive technical analysis. Trend direction indicators and trend-following tools will enable you to take advantage of those large market movements.

About the Author:

Adinah Brown is a professional writer who has worked in a wide range of industry settings, including corporate industry, government and non-government organizations. Within many of these positions, Adinah has provided skilled marketing and advertising services and is currently the Content Manager at Leverate.


Are All Bonds EQUALLY Low Risk?

By Elliott Wave International


Your Bond Fund: It’s Riskier Than You Think

Quantitative Easing (QE) changed the bond markets in ways many don’t realize. And now that QE is unwinding, investing in bonds comes with pitfalls that are too risky to overlook. This new resource from EWI’s Murray Gunn offers insights you don’t want to miss. Get your free report, Your Bond Fund: It’s Riskier Than You Think.

Learn more and register for free!

This article was syndicated by Elliott Wave International and was originally published under the headline Are All Bonds EQUALLY Low Risk?. EWI is the world’s largest market forecasting firm. Its staff of full-time analysts led by Chartered Market Technician Robert Prechter provides 24-hour-a-day market analysis to institutional and private investors around the world.

Fibonacci Retracements Analysis 24.11.2017 (BITCOIN, ETHEREUM)

Article By RoboForex.com

BTC USD, “Bitcoin vs US Dollar”

As we can see at the H4 chart, the BTC/USD pair is still moving upwards. The next upside targets may be inside the post-correctional extension area between the retracements of 138.2% and 161.8% at 8774.76 and 9313.05 respectively. However, we can’t help but notice that the psychologically-crucial level at 10000.00 may be the main ambitious target of the instrument.

BTCUSD1

At the H1 chart, the pair is about to complete the being correction to the downside and may start a new ascending impulse. However, the correction hasn’t been finished yet and may continue towards the retracements of 23.6%, 38.2%, and 50.0% at 7704.95, 7286.36, and 6993.45 respectively.

BTCUSD2


ETH USD, “Ethereum vs. US Dollar”

At the H4 chart, the uptrend continues and may break al-time high. The next upside targets for the ETH/USD pair may be inside the post-correctional extension area between the retracements of 138.2% and 161.8% at 467.79 and 513.64 respectively.

ETHUSD1

As we can see at the H1 chart, the pair is being corrected to the downside. The target are the retracements of 38.2%, 50.0%, and 61.8% 392.63, 372.52, and 356.25 respectively.

ETHUSD2


RoboForex Analytical Department

Article By RoboForex.com

Attention!
Forecasts presented in this section only reflect the author’s private opinion and should not be considered as guidance for trading. RoboForex LP bears no responsibility for trading results based on trading recommendations described in these analytical reviews.

Forex Technical Analysis & Forecast 24.11.2017 (EUR/USD, GBP/USD, USD/CHF, USD/JPY, AUD/USD, USD/RUB, GOLD, BRENT)

Article By RoboForex.com

BTC USD, “Bitcoin vs US Dollar”

As we can see at the H4 chart, the BTC/USD pair is still moving upwards. The next upside targets may be inside the post-correctional extension area between the retracements of 138.2% and 161.8% at 8774.76 and 9313.05 respectively. However, we can’t help but notice that the psychologically-crucial level at 10000.00 may be the main ambitious target of the instrument.

BTCUSD1

At the H1 chart, the pair is about to complete the being correction to the downside and may start a new ascending impulse. However, the correction hasn’t been finished yet and may continue towards the retracements of 23.6%, 38.2%, and 50.0% at 7704.95, 7286.36, and 6993.45 respectively.

BTCUSD2


ETH USD, “Ethereum vs. US Dollar”

At the H4 chart, the uptrend continues and may break al-time high. The next upside targets for the ETH/USD pair may be inside the post-correctional extension area between the retracements of 138.2% and 161.8% at 467.79 and 513.64 respectively.

ETHUSD1

As we can see at the H1 chart, the pair is being corrected to the downside. The target are the retracements of 38.2%, 50.0%, and 61.8% 392.63, 372.52, and 356.25 respectively.

ETHUSD2


RoboForex Analytical Department

Article By RoboForex.com

Attention!
Forecasts presented in this section only reflect the author’s private opinion and should not be considered as guidance for trading. RoboForex LP bears no responsibility for trading results based on trading recommendations described in these analytical reviews.

EURUSD: price caught at the 112th degree

By Gabriel Ojimadu, Alpari

Previous:

On Thursday the 23rd of November, the US dollar index hit a monthly low of 93.07. Accordingly, trading on the euro/dollar pair closed up. Given the euro’s 57.6% weighting on the DXY, the EURUSD pair practically mirrors the index’s movements. The single currency was boosted by European data (German GDP and Eurozone business activity), as well as the US dollar’s weakness.

During the European session, the euro jumped to 1.1856. Since the US was celebrating Thanksgiving and exchanges were closed across the country, the euro spent the rest of the day at 1.1850 due to low trading activity.

Day’s news (GMT+3):

  • 11:15 Switzerland: industrial production (Q3).
  • 12:00 Germany: IFO – business climate (Nov), IFO – current assessment (Nov), IFO – expectations (Nov).
  • 12:30 UK: BBA mortgage approvals (Oct).
  • 15:30 Eurozone: ECB Vice President Vitor Constancio’s speech.
  • 17:45 USA: Markit manufacturing PMI (Nov), Markit services PMI (Nov).
  • 21:15 Eurozone: ECB’s Cœuré Speech.

Fig 1. EURUSD rate on the hourly. Source: TradingView

Yesterday, I was expecting the euro to rise to the 112th degree with a subsequent retreat to the lower boundary of the B-B channel in the US session. The 112th degree stopped buyers in their tracks, but there was no drop to follow. In such a thin market, the pair consolidated within a narrow range around the 1.1850 mark until the session closed.

On Friday, during the Asian session, the euro dropped to the lower boundary of the B-B channel, although since yesterday, this line has moved up from 1.1824 to 1.1837. Now, I’ve decided not to make a forecast given the contradictory situation on the pair. The euro continues to get support from the crosses, so it, along with the Aussie dollar, is trading up against the US dollar, while the other majors are trading down.

Buyers have gained a foothold at the 1.1861 resistance, which is formed from the 15th of November’s high. Given that the US trading day will be shorter than usual and that trading activity is set to remain at low levels, I reckon we’ll see a breakout of the B-B channel today. For me, the ideal situation would be a return to the LB balance line at 1.1818. Hourly cycles show the euro dropping over the next two days. The only thing propping up the euro is the crosses, and when they start to see a downwards correction, the euro will follow suit.

Fibonacci Retracements Analysis 23.11.2017 (AUD/USD, USD/CAD)

Article By RoboForex.com

AUD USD, “Australian Dollar vs US Dollar”

At the H4 chart, the AUD/USD pair is moving downwards and has already reached the retracement of 76.0%. The convergence may indicate a possible correction to the upside. The closest target are the retracements of 23.6%, 38.2%, and 50.0% at 0.7668, 0.7755, and 0.7825 respectively.

AUDUSD1

At the H1 chart, the pair is trading upwards to reach the target at 0.7668.

AUDUSD2


USD CAD, “US Dollar vs Canadian Dollar”

As we can see at the H4 chart, the price is about to complete the ascending impulse and start a new decline. The correction has already reached the retracement of 23.6%. The next targets are the retracements of 38.2% and 50.0% at 1.2590 and 1.2490 respectively.

USDCAD1

At the H1 chart, the current downtrend is moving towards the low at 1.2667 and the post-correctional extension area between the retracements of 138.2% and 161.8% at 1.2601 and 1.2561 respectively.

USDCAD2


RoboForex Analytical Department

Article By RoboForex.com

Attention!
Forecasts presented in this section only reflect the author’s private opinion and should not be considered as guidance for trading. RoboForex LP bears no responsibility for trading results based on trading recommendations described in these analytical reviews.

EURUSD long for 1.1960, USDJPY short target lowered to 110.30

By GrowthAces.com

Macroeconomic overview:

  • Many Federal Reserve policymakers expect that interest rates will have to be raised in the “near term,” according to the minutes of the U.S. central bank’s last policy meeting released on Wednesday.
  • The readout from the October 31-November 1 meeting, at which the Fed kept rates unchanged, also showed policymakers generally agreed the economy was poised for strong growth. Several Fed officials also saw improved chances that the U.S. Congress would pass significant tax cuts that would boost business investment.
  • While some policymakers said they still needed to see more data before deciding the timing of a rate hike, many of the officials said the jobless rate appeared to be too low for inflation to remain at its current weak level.
  • “Participants expected solid growth in consumer spending in the near term, supported by ongoing strength in the labor market,” the Fed said in the minutes. “Many participants thought that another increase in the target range for the federal funds rate was likely to be warranted in the near term.”
  • In the minutes, policymakers engaged in what has become a regular debate over why inflation has remained below the Fed’s 2% target for several years. Most agreed that tightness in the labor market would likely fuel higher inflation in the medium term.
  • Some of the members who vote on policy, however, expressed concern over the inflation outlook, according to the minutes. These policymakers emphasized they would be looking at upcoming economic data before deciding the timing of future rate rises.
  • A couple of policymakers were concerned enough about persistently weak price gains that they suggested the Fed consider a new framework in which it committed to allowing higher inflation to make up for periods of low price rises.
  • Since the last policy meeting, Yellen has stuck by her prediction that inflation will soon rebound toward the Fed’s target, although on Tuesday she said she is “very uncertain” about this and is open to the possibility that prices could remain low for years to come.
  • The USD weakened on the release of minutes from the Federal Reserve’s most recent policy meeting and U.S. data.
  • New orders for key U.S.-made capital goods unexpectedly fell in October after three straight months of hefty gains, but a sustained increase in shipments pointed to robust business investment and economic momentum as the year winds down. The Commerce Department on Wednesday said orders for non-defense capital goods excluding aircraft, a closely watched proxy for business spending plans, declined 0.5% last month. That was the biggest drop since September 2016 and followed an upwardly revised 2.1% increase in September.
  • Orders of these so-called core capital goods increased at a 14.5% annualized pace in the three months prior to October, the strongest since June 2013. The market had forecast orders of core capital goods increasing 0.5% last month after a previously reported 1.7% jump in September. Core capital goods orders rose 4.4% on a year-on-year basis.
  • Shipments of core capital goods advanced 0.4% last month after accelerating by 1.2% in September, pushing the annualized three-month pace to 13.1%. Core capital goods shipments are used to calculate equipment spending in the government’s GDP measurement. Business spending on equipment has buoyed economic growth for the past four quarters and is expected to make a solid contribution to GDP in the October-December period.
  • The economy’s prospects were bolstered by other data on Wednesday showing a decline in the number of Americans filing claims for unemployment benefits. Strong business investment and tightening labor market conditions will likely keep the Federal Reserve on track to raise interest rates next month.
  • We expect thin trading today due to Thanksgiving holiday.

Technical analysis and trading signals:

  • Bull sentiment is upped as Tuesday’s doji saw an upside extension on Wednesday. RSIs are biased up to bolster a bullish view. An inverse head and shoulders bottom might be forming. If that picture is confirmed strong gains will be likely.
  • We stay long for 1.1960.

EURUSD Daily Forex Signals Chart


USD/CAD: Loonie rallies on rising oil prices

Macroeconomic overview:

  • The Canadian dollar strengthened to a nine-day high against the USD on Wednesday as oil prices climbed and minutes from the Federal Reserve’s most recent policy meeting weighed on the greenback.
  • Oil settled at a two-year high Wednesday after the shutdown of one of the largest crude pipelines from Canada cut supply to the United States.
  • The restart of the 590k bpd Keystone pipeline, shut last week due to a spill, could take several weeks.
  • U.S. supplies have been a key factor in determining how quickly a global supply overhang can be reduced. The tug-of-war between concerns over supply cuts due to the Keystone delivery cuts and more robust overall inventories shows how the oil market is grappling to untangle the U.S. supply picture.
  • Oil has also been supported by an effort led by the Organization of the Petroleum Exporting Countries to end a global supply overhang by restraining output. The deal to curb production expires in March but is widely expected to be extended at a November 30 meeting.
  • Strong inflows of foreign money into Canadian stocks and bonds this year are adding to investor confidence that the rally since May in the country’s currency is sustainable because it is not just supported by speculative flows.
  • Equity and bond market investors, so-called “real money,” tend to have longer horizons than often-leveraged speculators betting on the direction of a currency. Increased buying of Canadian securities by foreign portfolio managers could leave the loonie more resilient should market sentiment turn bearish on the currency.
  • Foreign investment in Canadian securities rose to CAD 52 billion in the third quarter from the second quarter on the back of two interest rate increases by the Bank of Canada that boosted the appeal of Canada’s government bonds and its corporate debt. That has pushed the year-to-date foreign inflows to CAD 152 billion, on track to match or beat last year’s record of CAD 172 billion. Net inflows easily exceed the amount needed to cover Canada’s annual current account deficit of about CAD 60 billion.
  • The loonie has been pressured recently by concern that an uncertain outlook for the North American Free Trade Agreement will stall Bank of Canada interest rate hikes.
  • The United States, Mexico and Canada failed to resolve any major differences in a fifth round of talks to rework the NAFTA trade deal, drawing a swift complaint from the Trump administration on Tuesday that the lack of progress could doom the process.
  • Canadian retail sales data for September is due on Thursday.

Technical analysis and trading signals:

  • The USD/CAD broke and closed below short-term moving averages and 23.6% fibo of September-October rise (1.2714), the two support level that we mentioned yesterday. The next support is November 10 low of 1.2666. A break would open the way to 50% fibo at 1.2488.
  • We stick to our bearish view with the short position opened at 1.2815. We have lowered the target to 1.2500.

USDCAD Daily Forex Signals Chart


TRADING STRATEGIES SUMMARY:

FOREX – MAJOR PAIRS:

Please enable images to upload to view this email properly

FOREX – MAJOR CROSSES:

Please enable images to upload to view this email properly

PRECIOUS METALS:

Please enable images to upload to view this email properly

How to read these tables?

1. Support/Resistance – three closest important support/resistance levels
2. Position/Trading Idea:
BUY/SELL – It means we are looking to open LONG/SHORT position at the Entry Price. If the order is filled we will set the suggested Target and Stop-loss level.
LONG/SHORT – It means we have already taken this position at the Entry Price and expect the rate to go up/down to the Target level.
3. Stop-Loss/Profit Locked In – Sometimes we move the stop-loss level above (in case of LONG) or below (in case of SHORT) the Entry price. This means that we have locked in profit on this position.
4. Risk Factor – green “*” means high level of confidence (low level of uncertainty), grey “**” means medium level of confidence, red “***” means low level of confidence (high level of uncertainty)
5. Position Size (forex)– position size suggested for a USD 10,000 trading account in mini lots. You can calculate your position size as follows: (your account size in USD / USD 10,000) * (our position size). You should always round the result down. For example, if the result was 2.671, your position size should be 2 mini lots. This would be a great tool for your risk management!
Position size (precious metals) – position size suggested for a USD 10,000 trading account in units. You can calculate your position size as follows: (your account size in USD / USD 10,000) * (our position size).
6. Profit/Loss on recently closed position (forex) – is the amount of pips we have earned/lost on recently closed position. The amount in USD is calculated on the assumption of suggested position size for USD 10,000 trading account.
Profit/Loss on recently closed position (precious metals) – is profit/loss we have earned/lost per unit on recently closed position. The amount in USD is calculated on the assumption of suggested position size for USD 10,000 trading account.


VIP Traders Club members should expect to receive forex and precious metals trading signals updates at least twice a day. We will send you:

  1. Buy and sell forex, precious metals signals (entry level, target, stop-loss)
  2. Suggested position size that you can easily adjust to your trading account size – this would help you in risk management and you will survive longer drawdown periods
  3. Early heads-up about the potential trading opportunities or rationale to taken positions ( fundamental analysis, technical analysis )
  4. Forecasts of most important macroeconomic indicators prepared by our economists and econometricians.

JOIN VIP TRADERS CLUB – BLACK FRIDAY OFFER – 50% OFF FOR ALL SUBSCRIPTION PLANS!

About the Author:

By GrowthAces.com – Daily Forex Trading Strategies


Forex Technical Analysis & Forecast 23.11.2017 (EUR/USD, GBP/USD, USD/CHF, USD/JPY, AUD/USD, USD/RUB, GOLD, BRENT)

Article By RoboForex.com

EUR USD, “Euro vs US Dollar”

The EUR/USD pair has broken 1.1770 upwards and may choose an alternative scenario, which implies that the market may form another structure to extend the correction. Possibly, today the price may reach 1.1857 and then fall towards 1.1798. Later, in our opinion, the market may start another growth with the target at 1.1884.

EURUSD


GBP USD, “Great Britain Pound vs US Dollar”

The GBP/USD pair has reached the target of the third ascending wave. We think, today the price may form another consolidation channel and fall towards 1.3265. After that, the instrument may be corrected inside the fourth wave. The target is at 1.3198.

GBPUSD


USD CHF, “US Dollar vs Swiss Franc”

The USD/CHF pair has broken its consolidation channel and expanded it downwards. Possibly, today the price may move upwards to reach 0.9873 and then form another consolidation channel. Later, in our opinion, the market may break it to the upside and then continue growing with the target at 0.9940.

USDCHF


USD JPY, “US Dollar vs Japanese Yen”

The USD/JPY pair has reached the correctional target. We think, today the price may grow to reach 112.00 and then fall towards 111.523, thus forming another consolidation range. After that, the instrument may break this range upwards and continue growing with the target at 113.20.

USDJPY


AUD USD, “Australian Dollar vs US Dollar”

The AUD/USD pair is forming the second ascending impulse with the target at 0.7652. Later, in our opinion, the market may fall to reach 0.7604 and then start another growth towards the first target at 0.7676.

AUDUSD


USD RUB, “US Dollar vs Russian Ruble”

The USD/RUB pair has reached the target of the fourth wave. Possibly, today the price may form another consolidation range. After breaking it upwards, the instrument may start the fifth wave with the target at 60.60.

USDRUB


XAU USD, “Gold vs US Dollar”

Gold has broken 1284 and expanded the range upwards. We think, today the price may fall to return to 1284. According to the main scenario, the price may continue forming the wave towards 1271. An alternative scenario implies that the market may reach 1296, break it, and then continue growing with the target at 1311.

GOLD


BRENT

Brent is consolidating to break 63.15 upwards. Possibly, the price may break this level and continue growing towards 64.85. After that, the instrument may fall to return to 63.30 and then resume moving to the upside with the first target at 65.30.

BRENT


RoboForex Analytical Department

Article By RoboForex.com

Attention!
Forecasts presented in this section only reflect the author’s private opinion and should not be considered as guidance for trading. RoboForex LP bears no responsibility for trading results based on trading recommendations described in these analytical reviews.

EURUSD: lower liquidity due to US holidays

By Gabriel Ojimadu, Alpari

On Wednesday the 22nd of November, trading on the euro/dollar closed up by 81 pips at 1.18. This sharp increase was brought about by the decline in the dollar and US 10Y bond yields resulting from the publication of weak durable goods data and the FOMC minutes.

Durable goods orders fell after three months of growth. US 10Y bond yields dropped from 2.376% to 2.340%.

A lot of FOMC members support gradually increasing interest rates over the coming months so long as macroeconomic indicators stay in line with mid-term projections. On the other hand, some members are inclined to refrain from tightening monetary policy any further until they are sure that the recent growth in inflation is sustainable.

Day’s news (GMT+3):

  • 10:00 Germany: GDP (Q3).
  • 11:00 France: Markit manufacturing PMI (Nov), Markit services PMI (Nov).
  • 11:30 Germany: Markit manufacturing PMI (Nov), Markit services PMI (Nov).
  • 11:35 Eurozone: ECB’s Praet speech.
  • 12:00 Eurozone: Markit manufacturing PMI (Nov), Markit services PMI (Nov).
  • 12:30 UK: GDP (Q3).
  • 14:00 UK: CBI distributive trades survey (Nov).
  • 16:30 Eurozone: ECB monetary policy meeting accounts.
  • 16:30 Canada: retail sales (Sep).
  • 19:30 Switzerland: SNB chairman Jordan’s speech.
  • 21:15 Eurozone: ECB’s Cœuré Speech.

Fig 1. EURUSD rate on the hourly. Source: TradingView

Political uncertainty in Germany didn’t cause the euro to drop as I expected. The US dollar’s decline together with disappointing US data stopped sellers from making any inroads. Prospects of a decline for the euro were dashed when the price exited the A-A channel. From the 45th degree, the price initially recovered to the 67th degree, making it to the 90th degree after the FOMC minutes were published.

There was also another factor at play against the dollar. Traders needed some kind of driver to help them determine which currency would be better to hold over the long weekend. The data that came has created a negative outlook for the dollar and the FOMC minutes have strengthened this outlook.

As today is the 4th Thursday in November, the US is celebrating Thanksgiving Day. American exchanges are closed today and will close early on Friday. Volumes are thin on the market, so from our current price of 1.1829, we could move up to 50 pips in either direction. Considering that traders are buying euros on the crosses and that markets are paying less attention to the German coalition talks, I’m predicting a test of the 112th degree followed by a rebound towards the lower boundary of the B-B channel. When the crosses are rising, buyers don’t give up so easily.

If markets do decide to pay attention to Germany, I’d like to see the price return to the LB balance line, which currently runs through 1.1763.

Source: EURUSD: lower liquidity due to US holidays