Article By RoboForex.com
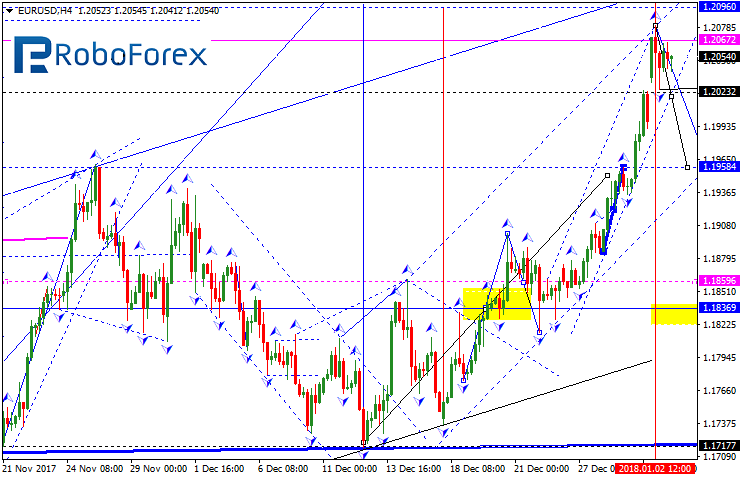
EUR USD, “Euro vs US Dollar”
The EUR/USD pair has broken the low of the first descending impulse. We think, today the price may continue consolidating around 1.2020. According to the main scenario, the instrument may fall towards 1.1976 and then grow to return to 1.2020. Later, in our opinion, the market may move downwards to reach the first target at 1.1930.

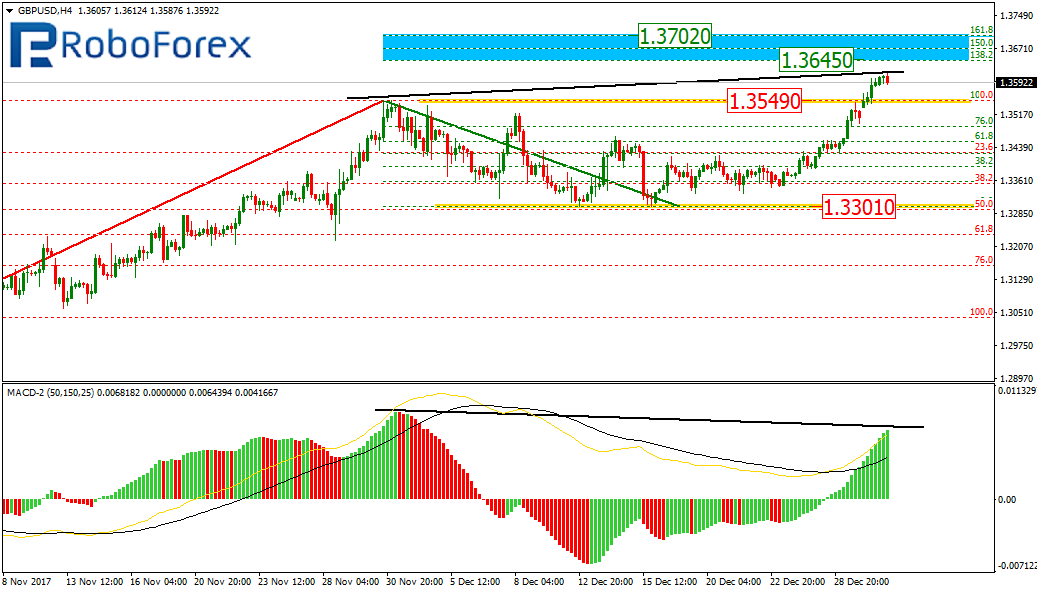
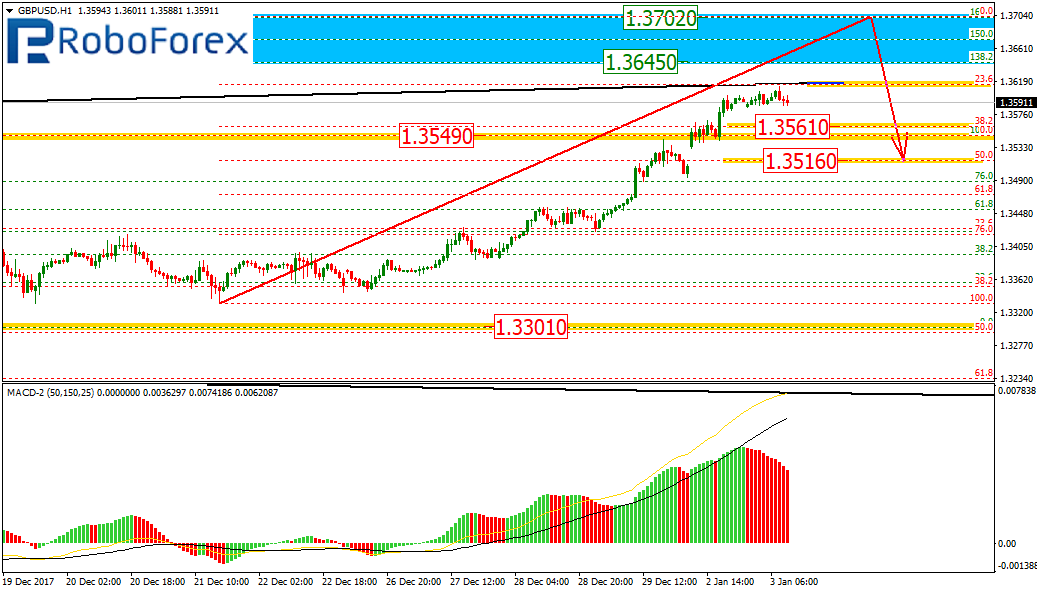
GBP USD, “Great Britain Pound vs US Dollar”
The GBP/USD pair has completed the first descending impulse and right now is consolidating near the lows. Possibly, the price may be corrected towards 1.3555 and then resume falling with the first target at 1.3424.

USD CHF, “US Dollar vs Swiss Franc”
The USD/CHF pair has reached the first target of the ascending structure. Possibly, today the price may start another correction towards 0.9742. After that, the instrument may start another growth to reach the second target at 0.9840.

USD JPY, “US Dollar vs Japanese Yen”
The USD/JPY pair is trading upwards to reach 112.84. Later, in our opinion, the market may be corrected towards 112.47 and then grow to reach 113.30.

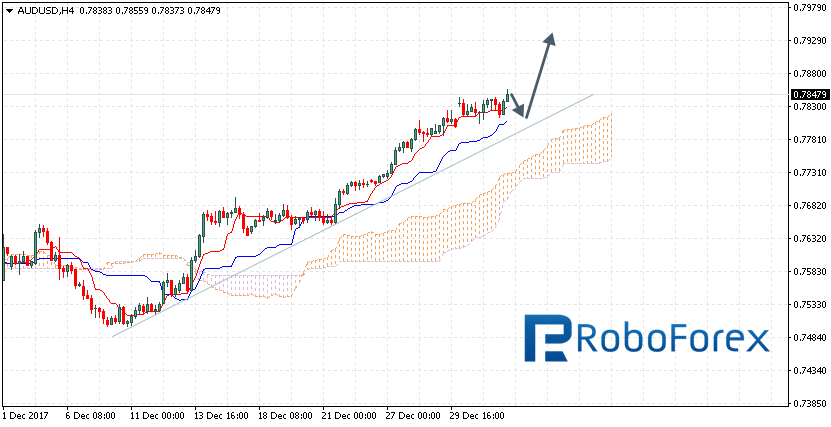
AUD USD, “Australian Dollar vs US Dollar”
The AUD/USD pair is still moving upwards; right now, it is consolidating at the top. According to the main scenario, the price may break this range to the downside to reach the first target at 0.7755.

USD RUB, “US Dollar vs Russian Ruble”
The USD/RUB pair is trading to break the consolidation range downwards. The next downside target is at 56.80. After that, the instrument may grow towards 57.35 and then falling to reach 56.55.

Later, in our opinion, the market may resume moving downwards with the first target at 1300.

BRENT
Brent is still moving upwards; it has completed a half of another ascending structure. Possibly, today the price may consolidate at the current levels and be corrected towards 67.00. According to the main scenario, the market may continue growing inside the uptrend to reach the local target at 70.70.

RoboForex Analytical Department
Article By RoboForex.com
Attention!
Forecasts presented in this section only reflect the author’s private opinion and should not be considered as guidance for trading. RoboForex LP bears no responsibility for trading results based on trading recommendations described in these analytical reviews.


