The European Central Bank should revisit its communication stance in early 2018, accounts of its December meeting showed, suggesting that policymakers could soon start preparing markets for the end of the bank’s massive stimulus scheme.
With the euro zone seeing its best growth in a decade, the ECB should gradually shift its stance to avoid a more disruptive move later and should look at a broader revision of its policy guidance to reduce the focus on bond purchases and raise the emphasis on interest rates, the accounts showed.
“The language pertaining to various dimensions of the monetary policy stance and forward guidance could be revisited early in the coming year,” the accounts showed, referring to 2018. “The view was widely shared that… communication would need to evolve gradually, without a change in sequencing.”
Sidelining his critics, ECB President Mario Draghi stuck to his pledge last month to keep money pouring into the euro zone economy for as long as needed, despite improved growth and inflation prospects.
But growth is into its fifth year, employment is at a record high and convergence between the 19-member currency bloc’s core and periphery has restarted, all pointing to unabated growth and a declining need for central bank help.
Indeed, while policymakers suggested a gradual and careful shift, they argued for a guidance comprising the broader policy stance, a move that would signal the declining importance of bond buys and seen by some as a precursor to ending asset buys.
“As progress was made toward a sustained adjustment in the path of inflation, the relative importance of the forward guidance on policy rates would increase,” policymakers said.
With euro zone output eliminating spare capacity this year, policymakers argued that no further easing in financial conditions was needed, and some even warned about the ECB falling behind the curve.
“It was important for the forward guidance to be updated in line with evolving data with a view to avoiding more abrupt or disorderly adjustments at a later stage,” the ECB said.
Some policymakers are already openly discussing life after the quantitative easing scheme ends, suggesting growing support for a decision to wind down the programme later this year.
The accounts suggested the first change might be dropping a pledge to buy bonds until inflation heads back to target. Running at 30 billion EUR per month at least until the end of September, the bond buys are expected by investors to end this autumn after a brief tapering period.
The euro surged above 1.21 to a three-year high Friday on bets the European Central Bank is getting ready to wind down its huge monetary stimulus, and after German Chancellor Angela Merkel reached a deal that should lead to the formation of a “grand coalition” government.
New York Fed President Bill Dudley gave an upbeat speech on the economic outlook. While he reiterated that three hikes in 2018 are a reasonable starting point for the outlook, he highlighted the risk that the economy could overheat in the next few years. Accordingly, the Fed should continue to gradually normalize its policy stance even as inflation is running below the 2% target.
Today, the key release will be the December CPI, which likely rose a moderate 0.1% mom as energy prices eased at the end of last year. As a result, the headline inflation rate would decline back to 2.0% yoy from 2.2%. The CPI ex food & energy should have increased 0.2% mom, leaving the core inflation rate unchanged at 1.7% yoy. Following yesterday’s soft PPI report, the risk to our forecast seems to be tilted somewhat to the downside. Retail sales should have risen a solid 0.4% mom in December, mostly reflecting a strong holiday shopping season and 2% growth in car sales.
Technical analysis and trading signals:
EUR/USD bulls are in the driving seat having taken out the 1.2097 Fibonacci level (38.2% of the 1.4940 to 1.0340 fall), a level which had for months frustrated bulls. Tenkan and kijun lines are positive aligned, reinforcing the upside bias.
Our long is close to 1.2150 target.
TRADING STRATEGIES SUMMARY:
FOREX – MAJOR PAIRS:
FOREX – MAJOR CROSSES:
PRECIOUS METALS:
How to read these tables?
1.Support/Resistance – three closest important support/resistance levels 2. Position/Trading Idea: BUY/SELL – It means we are looking to open LONG/SHORT position at the Entry Price. If the order is filled we will set the suggested Target and Stop-loss level. LONG/SHORT – It means we have already taken this position at the Entry Price and expect the rate to go up/down to the Target level. 3. Stop-Loss/Profit Locked In – Sometimes we move the stop-loss level above (in case of LONG) or below (in case of SHORT) the Entry price. This means that we have locked in profit on this position. 4. Risk Factor – green “*” means high level of confidence (low level of uncertainty), grey “**” means medium level of confidence, red “***” means low level of confidence (high level of uncertainty) 5. Position Size (forex)– position size suggested for a USD 10,000 trading account in mini lots. You can calculate your position size as follows: (your account size in USD / USD 10,000) * (our position size). You should always round the result down. For example, if the result was 2.671, your position size should be 2 mini lots. This would be a great tool for your risk management! Position size (precious metals) – position size suggested for a USD 10,000 trading account in units. You can calculate your position size as follows: (your account size in USD / USD 10,000) * (our position size). 6. Profit/Loss on recently closed position(forex) – is the amount of pips we have earned/lost on recently closed position. The amount in USD is calculated on the assumption of suggested position size for USD 10,000 trading account. Profit/Loss on recently closed position (precious metals) – is profit/loss we have earned/lost per unit on recently closed position. The amount in USD is calculated on the assumption of suggested position size for USD 10,000 trading account.
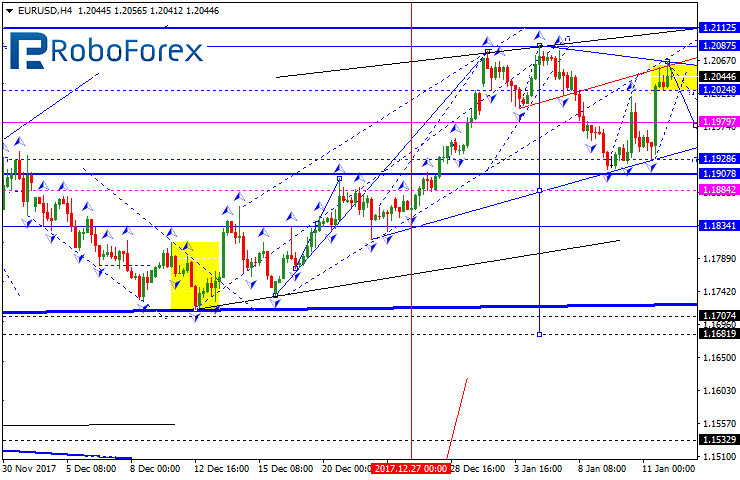
The EUR/USD pair is consolidating at the top of the ascending wave. Possibly, the price may break this range to the downside and reach 1.1979. Later, in our opinion, the market may grow to reach 1.2000 and then start another descending structure with the first target at 1.1884.
GBP USD, “Great Britain Pound vs US Dollar”
The GBP/USD pair has completed the third structure of the descending wave along with the correction. Possibly, today the price may fall inside the fifth structure to reach the first target at 1.3422.
USD CHF, “US Dollar vs Swiss Franc”
The USD/CHF pair is trading upwards. We think, today the price may form another ascending wave towards 0.9888. After that, the instrument may be corrected to reach 0.9800.
USD JPY, “US Dollar vs Japanese Yen”
The USD/JPY pair is moving downwards. The next target is at 110.68. Later, in our opinion, the market may form another consolidation range and then continue moving to the downside towards 110.20.
AUD USD, “Australian Dollar vs US Dollar”
The AUD/USD pair is still consolidating at the top of the ascending structure. We think, today the price may fall to break 0.7815. The target of the correction is at 0.7666.
USD RUB, “US Dollar vs Russian Ruble”
The USD/RUB pair is moving downwards. The main downside target is at 56.55. Possibly, today the price may fall to reach 55.88, because the instrument is forming the fifth wave with extensions.
XAU USD, “Gold vs US Dollar”
Gold is moving upwards. Possibly, today the price may fall towards 1310 and then grow to reach 1318. Later, in our opinion, the market may break 1305 downwards. The local target is at 1295.
BRENT
Brent continues rising; it has reached 70.00 and right now is being corrected. Possibly, the price may reach 69.00. After that, the instrument may continue growing inside the uptrend with the target at 71.00.
Attention! Forecasts presented in this section only reflect the author’s private opinion and should not be considered as guidance for trading. RoboForex LP bears no responsibility for trading results based on trading recommendations described in these analytical reviews.
On Wednesday the 10th of January, the euro jumped after a report from Bloomberg that China was preparing to either reduce or stop its purchases of US government bonds. The Chinese regulator, however, dismissed these rumours.
On Thursday the 11th of January, the euro jumped again after the minutes of the ECB’s latest meeting on monetary policy were disclosed. This sent Eurobonds up, along with the euro crosses and our main EURUSD pair. The European regulator remarked that the economic situation is improving, so it’s possible that the bank could revise its monetary policy in the early stages of this year.
The sharp rise of the single currency and weak US inflation data put the dollar under pressure. The producer price index for December dropped by 0.1% against a forecast of +0.2%, and a previous reading of +0.4% (a negative factor for the US Fed).
On Thursday, trading on the euro closed up above 1.20. Now we’ll look at the hourly chart and construct some intraday models for the past 3 days.
Day’s news (GMT+3):
10:45 France: CPI (Dec).
16:30 USA: CPI (Dec), retail sales (Dec).
18:00 USA: business inventories (Nov).
19:30 Germany: German Buba President Weidmann’s speech.
21:00 USA: Baker Hughes US oil rig count.
Fig 1. EURUSD hourly chart. Source: TradingView
The only way to protect yourself from unexpected news items is through stop levels. Since the minutes of the ECB meeting were published, the euro has recovered to 1.2066, with this recovery extending into the Asian session. Growth stopped at around the 112th degree. The area between the 112th and 135th degrees is a reversal zone, so the euro could drop to the LB balance line without hindrance during the European session.
Since yesterday’s upwards movement hasn’t been erased, like it was on Wednesday, I think a triple top could form today. I’ve gone for a triple top because in Asia, all the euro crosses are trading up. I’m sure that on these rising crosses, buyers will try to reach new highs. So, once a new high is reached, if there’s a double bearish divergence between the AO indicator and the price, we can start looking downwards.
The target is 1.2075, with a closing price in the region of 1.2042. If the crosses reverse, the target will be 1.1984. If the crosses are falling, the 45th degree won’t stop sellers.
On January 9th, Cypress Development Corp. (TSX-V: CYP) / (OTCQB: CYDVF) / (Frankfurt: C1Z1) [market cap = C$ 15.5 M] released 2 additional core holes from its Fall 2017 Clayton Valley, Nevada, drill program. Results include the best intersection to date, {hole # DCH-13}; 107 meters (350 feet) of 1,134 ppm lithium (“Li“) at the Dean property. Note: {I consider the Dean (2,700 acre) and Glory (1,520 acre) claims to be parts of the same overall project}. Cypress continues to expand the claystone-hosted Li mineralized zone.
In DCH-13, Li values increased at depth, starting at 24.8 meters, the grade averaged 1,206 ppm Li over 88.4 m. NOTE: {the hole terminated in mineralization and remains open at depth}
The 2 holes support the observed continuity of mineralization over a long northeast trend, extending roughly 4 km in length by 2 km in width across the Dean property alone. 4 drill holes have also been completed on the neighboring Glory property claims, assays are expected by the end of January. The Glory footprint measures about 3 km by 1 km.
According to the press release, quote,
“Extraction studies are under way to determine the solubility of the Li and other mineral constituents within the claystone. Bench-scale scoping tests revealed moderate extractions of Li in sulphuric acid solution, increasing to 74% recovery with increasing temperatures. The extractions were achieved with relatively low additions of sulphuric acid for lithium-bearing claystone deposits, measured at a rate of 140 to 170 kgs of acid/tonne.
Results are encouraging and clearly indicate that extractions and acid consumptions of Cypress’s claystone deposits are significantly better than seen in refractory claystone deposits. Further test work is under way to improve results by refining leach conditions, checking for mineralogical variability across properties, and determining methods of Li recovery from the leach solutions.”
Cypress has completed 5 new core holes on its 100% owned Dean property. Readers may recall that on December 5th, management announced results from the first 3 holes. Drill results included an intersection of ~337 ft. (102.7 meters “m”) of 1,029 ppm Li in hole # DCH-10.
In hole # DCH-10, dark greenish–blackish mudstones were found at a depth of ~ 175 ft. (53.4 m) that averaged 1,367 ppm Li over ~33 ft. (10 m), including ~3 ft. of 2,240 ppm Li. This is the first time Cypress has encountered these higher-grade dark mudstones.
DCH-11 included an interval of consistently higher grades starting at a depth of just 27 ft. (8.2 m). Samples averaged 1,308 ppm Li over 121 ft. (36.9 m), suggesting that a higher-grade zone may exist within the overall northeast trend. According to management, holes to date, “clearly show a large, tabular, lithium-bearing formation underlying the Dean property.“
All 9 previous holes at Dean encountered significant Li values within claystone, which ranged up to 1,790 ppm Li and averaged about 950 ppm Li. Mineralization outcrops at surface, and the average thickness was ~220 ft. (67.0 m). Li-bearing claystone is considered open in all directions.
With the addition of the 5 new assays, the combined 14 holes at Dean have an average mineralized thickness of 238 ft. (72.5 m), and an average grade of ~937 ppm Li. The Dean property hosts Li values in an area about 4,000 m (13,120 ft.) long by about 2,000 m (6,560 ft.) wide. That’s about 800 sq. hectares (1,975 sq. acres).
Cypress controls 100% of the contiguous Dean and Glory claim blocks, covering an area totaling 4,220 acres in Clayton Valley, Nevada, immediately east of Albemarle Corp.’s (NYSE: ALB) Silver Peak Li brine operations. Pure Energy Minerals’ (TSX-V: PE) project (PEA-stage, C$330 M after-tax NPV(8%) is on the Company’s southwest boundary.
Cypress’ 2 properties host Li mineralization that is neither brine nor hardrock. Li is hosted in a soft claystone, like the Li endowments at Global Geoscience (ASX: GSC) [project at Pre-Feasibility Stage in Nevada, market cap = ~C$485 M] and Bacanora Minerals (TSX-V: BCN) [main project in Sonora Mexico at Feasibility Stage, pro forma market cap = ~C$400 M]. Lithium Americas (TSX: LAC) also has a prominent claystone-hosted Li resource in Nevada, (at Pre-Feas Stage) but LAC’s flagship project is in Argentina.
The chart below shows a rough relative valuation of various clay, brine and hardrock lithium juniors at various stages of development. Cypress is thought to be just 2-3 months from a maiden resource. For my estimate of LCE tonnes I used the formula; length x width x thickness x rock density = 4,000 m x 2,000 m x 72 m (thick) x 2.5 (meters cubed – density). Then I haircut that figure by 25% to be conservative, and applied a further 50% discount to account for the tightness of drill spacing. More infill drilling will be necessary post maiden resource estimate to the reach the full tonnage potential of the Dean & Glory claims.
Cypress is trading at a 90% discount to the other companies in the chart. Even accounting for the much more advanced stage of peers, Cypress appears to have a low relative valuation. Consider that if Cypress’ share count and share price were both to double, the mcap / tonnes LCE ratio would increase to $32/tonne LCE, but that would still be a 62% discount to the peer average of $82/t LCE. Having said that, Cypress is not doubling its share count anytime soon! In fact, the Company is fully-funded through a maiden resource, and management believes that a PEA could be delivered (it depends on drilling & metallurgy) by year-end– with minimal new share issuance.
Interview of CEO Bill Willoughby, PhD, PE
I recently conducted an interview (by phone and email) with Bill Willoughby, PhD, PE, CEO & a Director at Cypress. Bill is ideally suited for the job at hand. Cypress is sitting on unconventional Li deposits that will require ingenuity and innovation to extract and process. Bill has 38 years’ experience as a mining engineer in all aspects of natural resources exploration & development.
Bill received a Doctorate in Mining Engineering & Metallurgy from the University of Idaho in 1989. Therefore, he’s as well placed as anyone to assess new methods of processing unconventional lithium deposits. Having said that, reinventing the wheel may not be necessary if extraction and processing can be done at relatively low temperatures, and with relatively low use of acid, but there’s a lot of testing ahead. Bill and his team are also evaluating a number of promising third-party technologies.
Here is my interview with Dr. Bill Willoughby, PhD, PE.
How are Cypress’ deposits similar to, or different from, the 3 major North American claystone resources; Global Geoscience’sRhyolite Ridge in Nevada, Lithium Americas’ Lithium Nevada project & Bacanora’s Sonora project in Mexico?
You used the word ‘claystone‘, and that’s the obvious link between us and the three others. All four are lithium-bearing deposits of volcanic origin, located in Nevada and northern Mexico. Rhyolite Ridge and Cypress are geographically close, and the only ones near a producing lithium brine operation, which is Albamarle Corp.‘s Silver Peak.
When you look at the grades in the other three deposits, the lithium values are higher, but the mineralogy appears different, such that we hope Clayton Valley is easier to get the lithium into solution.
In what ways will the work being done by these much larger unconventional lithium developers help Cypress over the next few years?
By unconventional, you mean claystone as opposed to brines or hardrock pegmatites. Any research or processing developments into lithium extraction from clays could be applicable, but possibly proprietary.
Our immediate focus right now is to see how well we can get the lithium into solution, and what reagents and conditions that takes. Once there, we will be able to evaluate how to get to a product, for which there are a number of companies right now working on solutions.
Based on the dimensions of known lithium mineralization, about 4,000 x 2,000 meters on the Dean project alone, with an average mineralized thickness of ~ 72 meters and average drill hole grade of ~ 940 ppm Li — is it possible to make a rough estimate of the potential scale of the Dean deposit?
Yes, that’s possible, and it’s certainly something we think about. However, until we have an independent QP tell us we have adequate drilling and enough information for a NI 43-101 compliant technical report, such an approximation is speculative and I have to advise against it. We are working towards that stage through drilling and laboratory tests and we hope to have a maiden resource by the end of the first quarter.
Some believe it will be nearly impossible to obtain water rights in Clayton Valley. Where does Cypress stand with regard to water?
The concerns over water rights have centered around the existing lithium producer in Nevada protecting its brine resources from new operations. Mining and processing claystone will not present the same impacts as would a new field of brine wells, and we are optimistic that the differences will become apparent assuming we are successful moving forward.
A major hurdle for your deposits is finding a way to process them in an environmentally friendly & cost effective manner. How is Cypress attacking this challenge?
We are working methodically, collecting samples and running those samples through scoping bench scale tests to determine under what conditions we get the lithium to leach, and what other elements leach along with it.
Once we have enough representative material from drilling to say we’ve addressed possible variability in mineralogy throughout the deposit, we can move on to a metallurgical program that addresses specific leaching and recovery methods.
Lithium prices in China are above US$ 20,000/tonne. Are there proven processing technologies available that are expensive, but might make sense if Li prices remain strong?
Possibly, yes — calcining or leaching with a strong acid, could be considered “proven,” but we don’t have enough information yet to say whether such steps are needed. We have to see where the drilling and test work takes us.
The Dean & Glory deposits are pre-maiden resource. At what exploration or development stage might a strategic or financial player invest in Cypress?
We have enough cash right now to do the work in front of us, and then some, so we don’t have any pressure to bring in a partner. This is a good place to be in for a junior. Obviously, if a good partner or offer comes along, we will consider it, but right now, that’s not at all our focus.
Thank you Bill for your time, I look forward to drill results at the Glory property and updates on ongoing metallurgy work.
Disclosures: The content of this article / interview is for illustrative and informational purposes only. Readers fully understand and agree that nothing contained herein, written by Peter Epstein of Epstein Research, [ER]including but not limited to, commentary, opinions, views, assumptions, reported facts, estimates, calculations, etc. is to be considered implicit or explicit, investment advice. Further, nothing contained herein is a recommendation or solicitation to buy or sell any security. Mr. Epstein and [ER] are not responsible for investment actions taken by the reader. Mr. Epstein and [ER] have never been, and are not currently, a registered or licensed financial advisor or broker/dealer, investment advisor, stockbroker, trader, money manager, compliance or legal officer, and they do not perform market making activities. Mr. Epstein and [ER] are not directly employed by any company, group, organization, party or person. Shares of Cypress Development Corp. are highly speculative, not suitable for all investors. Readers understand and agree that investments in small cap stocks can result in a 100% loss of invested funds. It is assumed and agreed upon by readers that they consult with their own licensed or registered financial advisors before making investment decisions.
At the time this article was posted, Peter Epstein owned shares in Cypress Development Corp.and the Company was an advertiser on [ER]. By virtue of ownership of the Company’s shares and it being an advertiser on [ER], Peter Epstein is biased in his views on the Company.Readers understand and agree that they must conduct their own research, above and beyond reading this article. While the author believes he’s diligent in screening out companies that are unattractive investment opportunities, he cannot guarantee that his efforts will (or have been) successful. Mr. Epstein & [ER] are not responsible for any perceived, or actual, errors including, but not limited to, commentary, opinions, views, assumptions, reported facts & financial calculations, or for the completeness of this article. Mr. Epstein & [ER] are not expected or required to subsequently follow or cover events & news, or write about any particular company or topic. Mr. Epstein and [ER] are not experts in any company, industry sector or investment topic.
The EUR/USD pair is forming the first descending wave. We think, today the price may form the fifth structure of this wave with the target at 1.1900. Later, in our opinion, the market may grow to reach 1.2000.
GBP USD, “Great Britain Pound vs US Dollar”
The GBP/USD pair is forming another descending wave. Possibly, today the price may reach 1.3421 and then grow towards 1.3494. After that, the instrument may fall with the target at 1.3380.
USD CHF, “US Dollar vs Swiss Franc”
The USD/CHF pair has completed the ascending wave along with the correction. We think, today the price may form another ascending structure towards the local target at 0.9888.
USD JPY, “US Dollar vs Japanese Yen”
The USD/JPY pair has broken the consolidation range downwards. Possibly, today the price may trade upwards to reach 112.05 and then resume moving to the downside with the local target at 110.93.
AUD USD, “Australian Dollar vs US Dollar”
The AUD/USD pair is still consolidating at the top of the ascending structure. We think, today the price may fall to break 0.7815. The target of the correction is at 0.7666.
USD RUB, “US Dollar vs Russian Ruble”
The USD/RUB pair is consolidating near the lows of the descending wave. If later the instrument breaks this range to the downside, the market may reach 56.55; if to the upside – start another correction towards 57.35.
XAU USD, “Gold vs US Dollar”
Gold has expanded the range upwards, but is still consolidating. Possibly, today the price may expand the range downwards and reach 1305. Later, in our opinion, the market may grow towards 1316 and then reverse to break the downside border in order to continue falling with the target at 1294.
BRENT
Brent continues trading above 68.85. Possibly, the price may continue growing to reach 69.95 and then start another correction towards 68.80. After that, the instrument may continue growing inside the uptrend with the target at 71.00.
Attention! Forecasts presented in this section only reflect the author’s private opinion and should not be considered as guidance for trading. RoboForex LP bears no responsibility for trading results based on trading recommendations described in these analytical reviews.
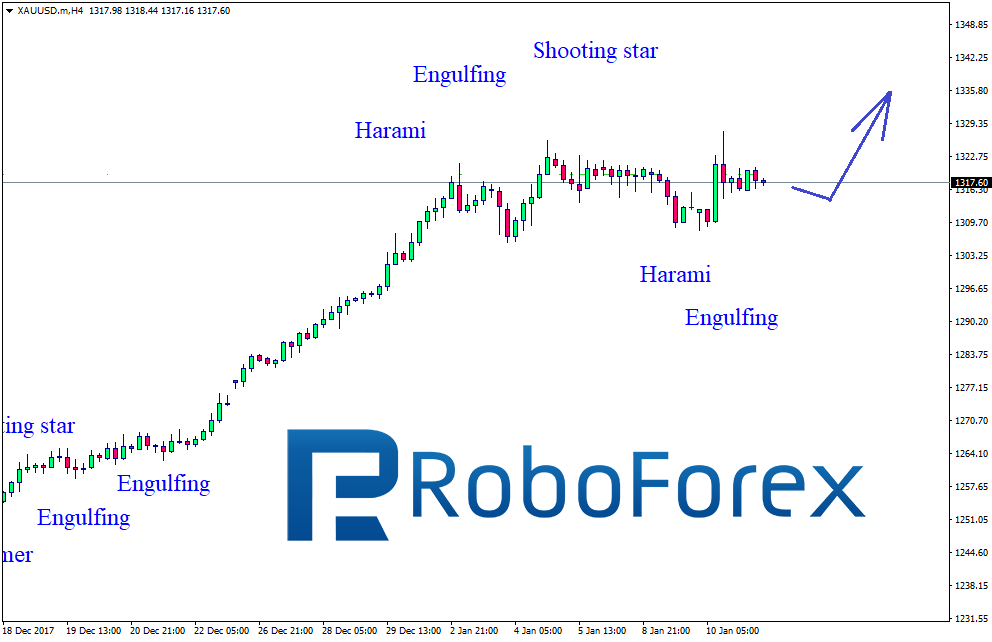
At the H4 chart, the XAU/USD pair continues the correction by forming Harami, Shooting Star, and Engulfing reversal patterns. Taking into account the current uptrend, we may assume that the price may resume growing and update the closest highs.
NZD USD, “New Zealand vs. US Dollar”
After forming several Doji, Harami, and Shooting Star reversal patterns at the H4 chart, the NZD/USD pair stopped growing. Judging by the current uptrend, we may assume that after finishing the correction the instrument may continue growing despite the above-mentioned reversal patterns.
Attention! Forecasts presented in this section only reflect the author’s private opinion and should not be considered as guidance for trading. RoboForex LP bears no responsibility for trading results based on trading recommendations described in these analytical reviews.
On Wednesday the 10th of January, trading on the euro closed slightly up after Bloomberg landed a blow on the dollar during the European session. The news agency reported that China is planning to reduce or stop its purchases of US government bonds.
The dollar dropped as bond yields rose due to the fact that China is the biggest holder of US debt. According to the US Treasury, China currently holds 1.189 trillion dollars’ worth of US government bonds.
The news about China sent the euro up to 1.2018 against the greenback. Since there were no official announcements from any Chinese officials, however, there was no further impetus for the dollar’s decline. In the US session, the euro dropped to 1.1941.
16:30 USA: PPI (Dec), initial jobless claims (5 Jan).
22:00 USA: Monthly budget statement (Dec).
Fig 1. EURUSD hourly chart. Source: TradingView
Due to the unexpected news on China, yesterday’s predictions didn’t come off. Sellers erased yesterday’s gains, bringing the exchange rate down to 1.1941. At the time of writing, the euro is trading at 1.1952.
Considering that on Wednesday, the euro/dollar rate corrected by nearly 90 degrees, and that the rate returned to the LB balance line (sma 55), for today, I’m predicting that the euro will slide against the dollar to the 112th degree at 1.1881. To trigger this decline, the bears need to break through the 1.1930 support. At the moment, the following crosses are getting in the way of this: EURJPY, EURGBP, EURCHF, and EURCAD.
If the euro continues to trade above 1.1915 up to the 15th of January, then from Monday, I’ll be expecting the euro/dollar pair to rise again.
At the H4 chart, the GBP/USD pair finished the ascending impulse and started a new correction, which has already reached the retracement of 38.2%. The next targets of this correction may be the retracements of 50.0% and 61.8% at 1.3472 and 1.3438 respectively. The main trend remains bullish; the current movement is just a pullback towards the broken high. The main upside targets are still inside the post-correctional extension area between the retracements of 138.2% and 161.8% at 1.3645 and 1.3702 respectively.
At the H1 chart, the situation is similar and confirms the scenario described above.
EUR JPY, “Euro vs. Japanese Yen”
At the H4 chart, after reaching the targets inside the post-correctional extension area between the retracements of 138.2% and 161.8%, the EUR/JPY pair started a new correction, which has already reached the retracement of 61.8%. The next targets of the current decline may be the retracement of 76.0% at 133.16. After breaking the low at 132.05, the long-term tendency may reverse.
At the H1 chart, the pair may reach significant support levels and then start a new ascending correction towards the retracement of 50.0% at 134.35.
Attention! Forecasts presented in this section only reflect the author’s private opinion and should not be considered as guidance for trading. RoboForex LP bears no responsibility for trading results based on trading recommendations described in these analytical reviews.
The EUR/USD pair has reached the local downside target. We think, today the price may start another correction to reach 1.1967 at least and then resume falling towards 1.1900. Later, in our opinion, the market may be corrected once again with the target at 1.2000. Possibly, the price may extend this wave towards 1.1840.
GBP USD, “Great Britain Pound vs US Dollar”
The GBP/USD pair has broken 1.3520 downwards. The local downside target at 1.3455.
USD CHF, “US Dollar vs Swiss Franc”
The USD/CHF pair has reached the local target. Taking into account that the price has broken the channel of the fifth descending wave, we may consider the current consolidation range as an upside continuation pattern. After breaking 0.9843 upwards, the instrument may extend the structure towards 0.9923.
USD JPY, “US Dollar vs Japanese Yen”
The USD/JPY pair has completed the descending structure. Possibly, today the price may trade upwards to reach 112.83. Later, in our opinion, the market may fall to break 112.14 and then continue moving to the downside with the local target at 111.00.
AUD USD, “Australian Dollar vs US Dollar”
The AUD/USD pair has broken the low of the first descending impulse and right now is forming a downside continuation pattern. The local target is at 0.7777. After that, the instrument may grow towards 0.7820 and then resume falling to reach 0.7766.
USD RUB, “US Dollar vs Russian Ruble”
The USD/RUB pair has reached the local target of the descending structure. Possibly, today the price may be corrected towards 57.35 and then continue falling inside the downtrend to reach 56.55.
XAU USD, “Gold vs US Dollar”
Gold has broken its consolidation range downwards and right now is forming a downside continuation pattern. Possibly, the price may reach the local target at 1297.52.
BRENT
The market was opened with a gap up; Brent continues moving upwards. Possibly, the price may reach the next target at 69.93. Right now, the pair may fall towards 68.80 to eliminate the gap. After that, the instrument may continue growing inside the uptrend to reach the local target at 70.97.
Attention! Forecasts presented in this section only reflect the author’s private opinion and should not be considered as guidance for trading. RoboForex LP bears no responsibility for trading results based on trading recommendations described in these analytical reviews.
Trading on the euro/dollar pair has closed down for the 3rd day in a row. This downwards correction comes to 173 pips. The euro has come under pressure after news from Japan (via the EURJPY cross), growth in US bond yields, as well as some technical factors.
The Bank of Japan has reduced its purchases of long-dated bonds, which traders have taken to mean that the bank is winding down its stimulus program this year. US bond yields have risen from 2.48 to 2.56 (+3.2%).
Aside from the above, traders had some other negative factors in mind during the downwards correction, namely the upcoming parliamentary elections in Italy as well as the difficulties in forming a government in Germany. In the US session, the euro dropped to 1.1916 and the pair is currently going through a correctional phase.
Day’s news (GMT+3):
10:45 France: industrial output (Nov).
12:30 UK: industrial production (Nov), manufacturing production (Nov), total trade balance (Nov).
16:00 UK: NIESR GDP estimate (Dec).
16:30 Canada: building permits (Nov).
16:30 USA: import price index (Dec).
18:30 USA: EIA crude oil stocks change.
Fig 1. EURUSD hourly chart. Source: TradingView
My predictions for yesterday rang true. The bears reached both their targets (1.1945 and 1.1925). Since the euro crosses were also trading down, our main pair didn’t experience any intraday rebounds.
A correction has started from 1.1916. Sellers have been trying to break this level down for 4 hours, to no avail. Judging by the hourly indicators, the correction seems to be over, so today I’m predicting a drop to 1.1900. I don’t think our pair will drop any further than this given that the TR3 trend line has been broken through.