As we can see at the H4 chart, the EUR/USD pair is still moving upwards to reach the post-correctional extension area between the retracements of 138.2% and 161.8% at 1.2291 and 1.2418 respectively. The main support level is at 1.2087.
At the H1 chart, the pair stopped forming the ascending impulse. In the short-term, the price is expected to be corrected downwards to reach the retracements of 23.6%, 38.2%, and 50.0% at 1.2210, 1.2157, and 1.2112 respectively.
USD JPY, “US Dollar vs. Japanese Yen”
As we can see at the H4 chart, the USD/JPY pair has broken the Triangle pattern downwards and continues forming the descending correction. The main targets of the correction are inside the post-correctional extension area between the retracements of 138.2% and 161.8% at 109.73 and 109.05 respectively.
At the H1 chart, the price is falling steadily, but we also can see the convergence being formed, which may indicate a possible reverse in the nearest future. In this case, the targets will be the area between the retracements of 23.6% and 76.0% at 111.06 and 112.64 respectively.
Attention! Forecasts presented in this section only reflect the author’s private opinion and should not be considered as guidance for trading. RoboForex LP bears no responsibility for trading results based on trading recommendations described in these analytical reviews.
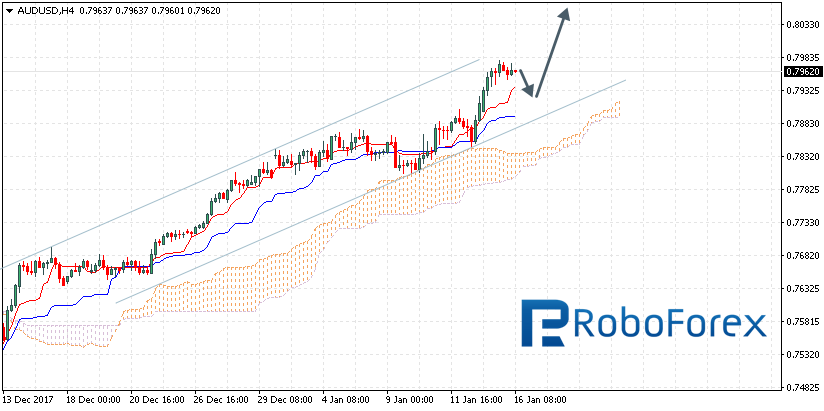
The AUD/USD pair is trading at 0.7962; the instrument is still moving above Ichimoku Cloud, which means that it may continue growing. We should expect the price to test Tenkan-Sen and Kijun-Sen at 0.7925 and then continue moving upwards to reach 0.8060. Another signal to confirm further ascending movement is the price’s rebounding from the downside border of the rising channel. However, the scenario that Implies further growth may be cancelled if the price breaks the downside border of the cloud and fixes below 0.7825. In this case, the pair may continue falling towards 0.7740.
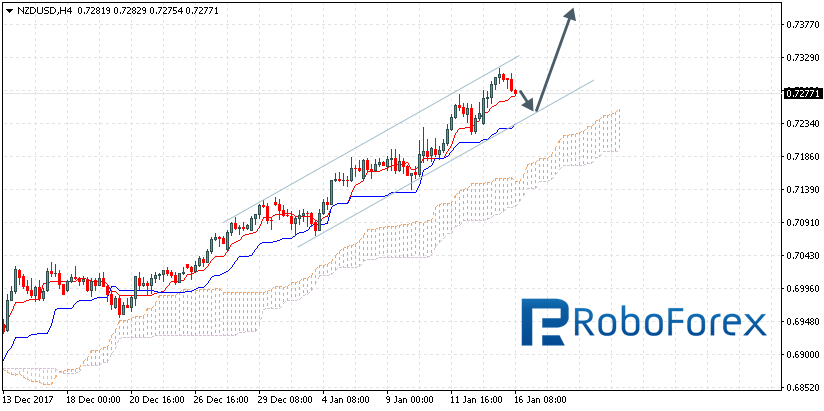
NZD USD, “New Zealand Dollar vs US Dollar”
The NZD/USD pair is trading at 0.7277; the instrument is still moving above Ichimoku Cloud, which means that it may continue growing. We should expect the price to test Tenkan-Sen and Kijun-Sen at 0.7265 and then continue moving upwards to reach 0.7380. Another signal to confirm further ascending movement is the price’s rebounding from the downside border of the rising channel. However, the scenario that implies further growth may be cancelled if the price breaks the downside border of the cloud and fixes below 0.7150. In this case, the pair may continue falling towards 0.7050.
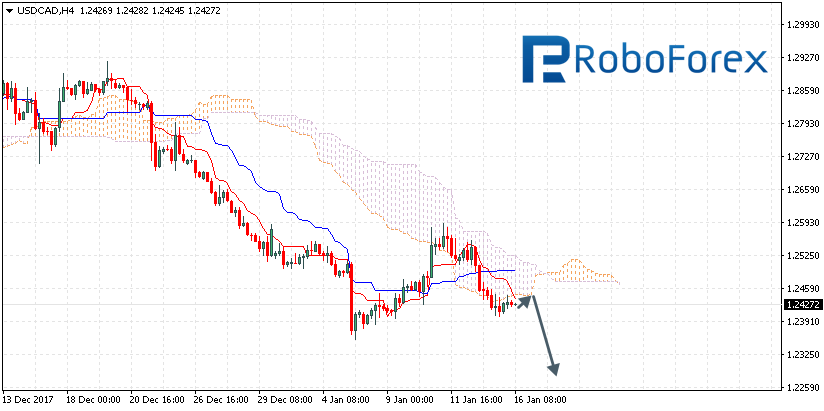
USD CAD, “US Dollar vs Canadian Dollar”
The USD/CAD pair is trading at 1.2427; the instrument is still moving below Ichimoku Cloud, which means that it may continue falling. We should expect the price to test the downside border of the cloud at 1.2485 and then continue moving downwards to reach 1.2270. However, the scenario that implies further decline may be cancelled if the price breaks the upside border of the cloud and fixes above 1.2535. In this case, the pair may continue growing towards 1.2650.
Attention! Forecasts presented in this section only reflect the author’s private opinion and should not be considered as guidance for trading. RoboForex LP bears no responsibility for trading results based on trading recommendations described in these analytical reviews.
On Monday the 15th of January, trading on the euro closed up. The euro jumped to 1.2297 on the back of a declining US dollar as well as remarks from ECB governing council member Ardo Hansson.
Hansson said that the ECB should be able to end its asset purchasing program in one swoop without any problems and that a strengthening euro is not a threat to inflation. But that’s not all. He also believes that the regulator should raise interest rates a few times before shrinking its balance sheet.
Day’s news (GMT+3):
10:00 Germany: CPI (Dec).
12:30 UK: CPI (Dec), PPI input (Dec), PPI output (Dec).
16:30 USA: NY Empire State manufacturing index (Dec).
Monday against Friday didn’t work out. The euro bulls were relying on fundamental factors yesterday. During trading in Europe, the euro kissed the U4 MA line. From 1.2297, a downwards correction began. Continuing into the Asian session, the euro dropped to 1.2248.
At the time of writing, the euro is trading at 1.2266. The price has moved out of overbought territory and is currently perched on the trend line. The correction has been going for 19 hours now. Since hourly cycles point towards a declining euro, I’m expecting it to meet with the LB balance line. I won’t consider buying any euros until the price returns to the balance line.
I’ve made a future projection of the LB line. Interestingly, it meets with the 67th degree at 1.2214. This is a great opportunity for sellers to bring the price down at least as far as the 67th degree. If the bigger timeframes begin to unload, we could see this go even further.
For the moment, concentrate on the 45th and 67th degrees and then we’ll see how the crosses and majors are doing.
Author: Dmitriy Gurkovskiy, Chief Analyst at RoboForex
Gold has been growing up steadily this year. By mid January, the yellow metal is at $1344.30, adding 0.7% to its price. Gold started growing in mid December and is moving ahead quite firmly in the lights of the weakening US dollar.
The market does not believe in the greenback and does not pay any attention to the fundamentals. On Friday, the US inflation report came up mixed, with the CPI growth by just 0.1% MoM, as expected. Base inflation did much better, with 0.03% growth MoM, the expectations being at 0.2%, and the previously released number at 0.1%.
Investors believe the Fed will be slower at taking interest rate decisions that it was expected to. One of the reasons is Janet Yellen’s successor, Jerome Powell, who is famous for being dovish towards monetary policy decisions. Another one is that there seems to be no point in raising the rate quickly and actively.
Thus, the greenback is under heavy pressure, and while it is so, the gold is rallying. The future looks mixed for the yellow metal: while the weak dollar helps it rise, one can clearly see it’s already overbought, and thus will retreat once a decent reason appears.
We can clearly identify a tight ascending channel on H4 gold chart, but still, technically, there are some contradictions. First, the major target of the current move is on the long-term channel resistance at 1384.50. Once this target has been achieved, gold can retreat back to 1330.
However, the price may well bounce from the mid-term range resistance at 1353.36, which could send the yellow metal even lower, to around 1300.
Attention!
Forecasts presented in this section only reflect the author’s private opinion and should not be considered as guidance for trading. RoboForex bears no responsibility for trading results based on trading recommendations described in these analytical reviews.
Trading opportunities on the currency pair: For several weeks in a row, the Kiwi dollar has been rising against both the US dollar and the Japanese yen. The price is approaching the DTR1 trend line (downwards trend line). In my forecast, I’m expecting a breakout of this line, followed by growth to the upper boundary of the range 75.63 – 83.81.
Background
The last idea on this currency pair was published on the 6th of March, 2017. At press time, the price was trading around the 80.28 mark. In the review, I considered the possibility of a double top with a target of 78.41 (61.8% from the range 80.45 – 83.81) with a possible decline to the trend line (TR) at 78.0. In the end, the Kiwi dollar dropped to 75.63.
Current situation
Below is our pair’s weekly chart. It’s been in a sideways trend since the beginning of 2017, with a range of 75.63 – 83.81 (818 pips). In the last 7 weeks, the New Zealand dollar has risen against its US counterpart from 76.09 to 81.31. Buyers are propping the price up at the upper boundary of this range.
The Bank of Japan favours a loose monetary policy, so this upwards trend should continue during the 1stquarter. This growth can be broken down into two phases. First, growth up to the DTR1 at 81.73. Secondly, after the breakout of DTR1, growth to 83.31. Once the pair exits the sideways trend, we can consider the possibility of a surge on the Kiwi dollar to 87.60.
Our research has been “spot on” with regards to the markets for the first few weeks of 2018. We issued our first trade on Jan 2nd, plus two very detailed research reports near the end of 2017 and early 2018. We urge you to review these research posts as they tell you exactly what to expect for the first Quarter in 2018.
Continuing this research, we have focused our current effort on the Transportation Index, the US Majors, and the Metals Markets. The Transportation Index has seen an extensive rally (+19.85%) originating near November 2017. This incredible upside move correlates with renewed US Tax policies and Economic increases that are sure to drive the US Equity market higher throughout 2018.
In theory, the Transportation Index is a measure of economic activity as related to the transportation of goods from port to distribution centers and from distribution centers to retail centers. The recent jump in the Transportation Index foretells of strong economic activity within the US for at least the next 3 months.
One could, and likely should watch the Transportation Index for any signs of weakness or contraction which would indicate an economic slowdown about to unfold. In order to better understand how the Transportation Index precedes the US Equity markets by 2~5 months, let’s compare the current price activity to that of 2007~08.
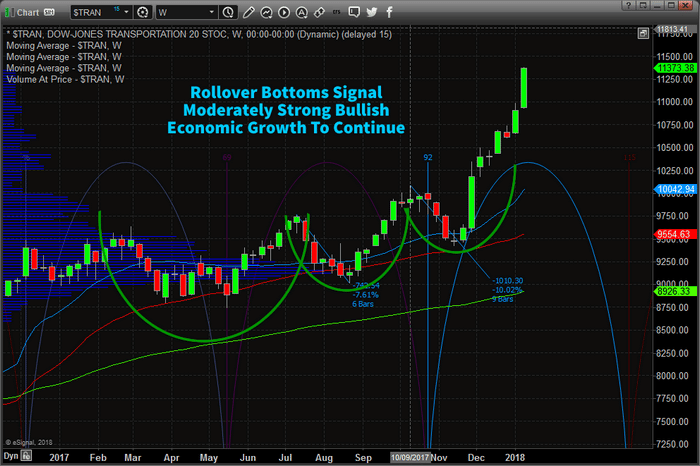
This first chart is the current Transportation Index and shows how strong the US economic recovery is in relation to the previous year (2017). As the US economy has continued to strengthen and open up new opportunities, the Transportation Index has related this strength by increasing by near +20% in only a few short months. This shows us that we should continue to expect a moderate to strong bullish bias for at least the first quarter of 2018 – unless something dramatic changes in relation to economic opportunities.
CURRENT TRANSPORTATION INDEX CHART
In comparison, this chart (below) is the Transportation Index in 2007~08 which reacted quite differently. The economic environment was vastly different at this time. The US Fed had raised rates consecutively over a two year period leading up to a massive debt/credit crisis. At the same time, the US had a Presidential Election cycle that saw massive uncertainty with regards to regulation, policies and economic opportunities. Delinquencies as related to debt had already started to climb and the markets reacted to the economic alarms ringing from all corners of the globe. The Transportation Index formed a classic “rollover top” formation in late 2007 and early 2008 well before the global markets really began to tank.
2007~08 TRANSPORTATION INDEX CHART
Our analysis points to a very strong first quarter of 2018 within the US and for US Equities. We believe the economic indicators will continue to perform well and, at least for the next 3 months, will continue to drive strong equity growth. We do expect some volatility near the end of the first Quarter as well as continued 2~5% price volatility/rotation at times. There will be levels of contraction in the markets that are natural and healthy for this rally. So, be prepared for some rotation that could be deeper than what we have seen over the last 6 months.
In conclusion, equities are this point are overpriced, and overbought based on the short-term analysis. We should be entering slightly weaker time for large-cap stocks over the next couple weeks before it goes much higher. Because we are still in a full out bull market, Dips Should Be Bought and we will notify members of a new trade once we get another one of these setups.
In our next post, we are going to talk about two opportunities in precious metals forming for next week!
Read the analysis we presented before the end of 2017 regarding our predictive modeling systems and how we target our research to helping our members. If you believe our analysis is accurate and timely, then we urge you to subscribe to www.TheTechnicalTraders.com to support our work and to benefit from our signals. We believe 2018 – 2020 will be the years that strategic trades will outperform all other markets. Join us in our efforts to find and execute the best trading opportunities and profit from these fantastic setups.
In technical analysis the transitions between rising and falling prices are signaled by price patterns. A price pattern identifies the changes in value of an asset by the recognizable configuration of trend lines. Identifying price patterns is a major part of Technical analysts in order to examine current movements and forecast future market movements.
All price pattern formations are identified on a trading chart from the patterns formed by an instrument’s change in price activity, whether they be the price of stocks, currencies, commodities, etc.
Charts rarely show price action going in a straight line, although this does occasionally happen during periods of strong price movement. Most often, prices zig zag, creating price peaks and troughs. Often these make easily-identified patterns that traders use to provide hints to future market direction.
This diagram shows prices falling to Point 1, before rising again to Point 2. Prices then retrace to Point 3 before rising once again to Point 4, and so on. By drawing a line joining Points 1, 3, and 5, the trader has formed a support line indicating that the market is on the rise. While, points 2, 4 and 6 form the resistance line, which indicates the outer parameter of which prices are likely to go up. The trader can then use this line to build future trading strategy.
Price patterns fall into two categories of continuation patterns and reversal patterns. The former shows that a market is just taking a break before continuing from a previous price direction, the latter suggest that a previous trend has completed its course and that a change in market movements is about to unfold.
We address some common price patterns that are used for indicating whether a previous trend will continue, reverse or stay within its range.
Let’s first introduce the Reversal Patterns:
Head and Shoulders
Literally looking like two shoulders on either side of a head. They are indicative of complex market activity where a new, significant change of trend is about to take place. These patterns are extremely common.
The chart in the (above) image shows an example of a Head and Shoulders pattern. You can see here the left and right shoulders (LS and RS), the head (H), the neckline (N), and the return move or bounce (RM. The target of a Head and Shoulder is calculated to be the distance from the top of the head, to the neckline, extended from the neckline against the direction of the previous trend.
Double and Triple Tops and Bottoms
This pattern appears when price action has attempted a price breakthrough from a particular high or low price, but failed. The market then normally retraces the distance from the high or low taken from previous support or resistance.
This chart shows two Triple Top formations as well as a very clear Head and Shoulders pattern.
Let’s now look at the Continuation Patterns:
One of the more common are triangle formations, these can be ascending (flat top), descending (flat bottom), or symmetrical.
Other price patterns include flags (two parallel trend lines), pennants (two converging trend lines) or wedges (where the two converging trend lines are angled up or down). Like the triangles, they can be bullish, indicating a downward trend, or bearish indicating and upward trend.
These price patterns are typically found when the price “takes a break” in a sense and goes through a period of consolidation, the result will either culminate in a continuation or reversal of the prevailing trend. Analyzing trend lines should be an underlying aspect of your technical trading strategy as it is used to forecast future price behavior.
About the Author:
Adinah Brown is a professional writer who has worked in a wide range of industry settings, including corporate industry, government and non-government organizations. Within many of these positions, Adinah has provided skilled marketing and advertising services and is currently the Content Manager at Leverate.
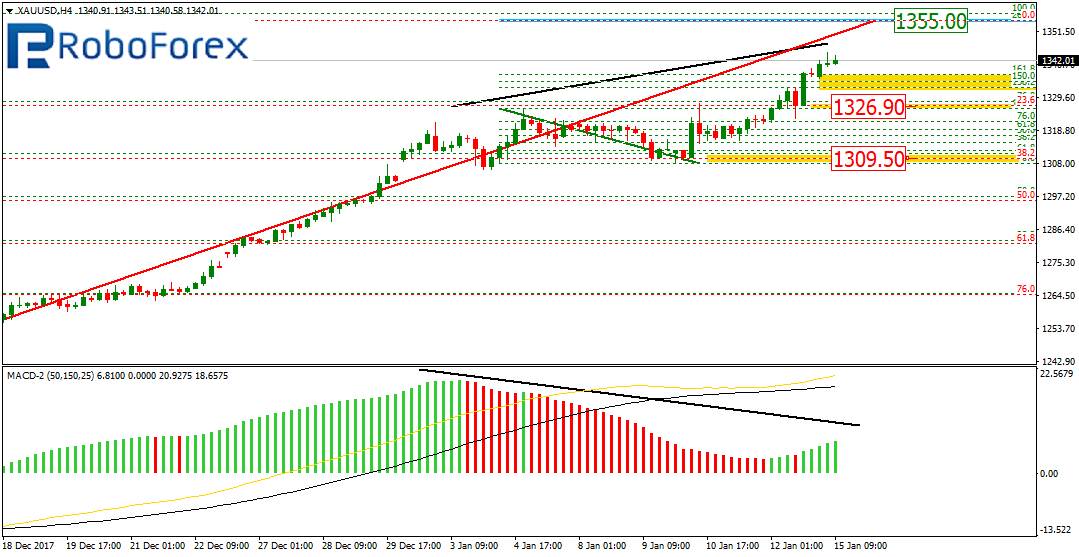
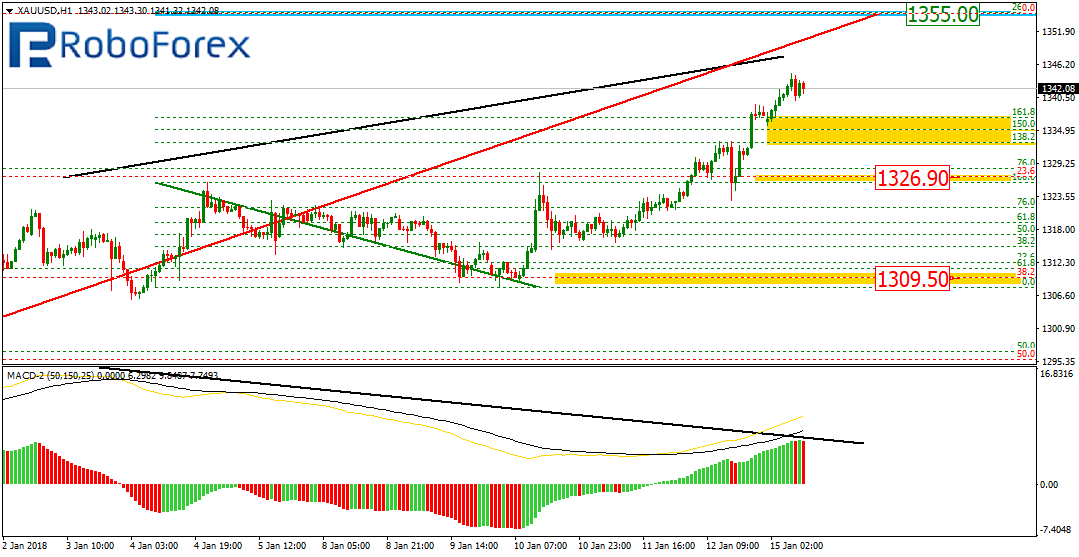
As we can see at the H4 chart, after a slight correction, the XAU/USD pair started forming a new impulse, which has already broken the post-correctional extension area between the retracements of 138.2% and 161.8%. The next upside target may be the retracement of 261.80% at 1355.00. At the same time, we can see the divergence being formed, that’s why after reaching the target the instrument may start a new correction.
At the H1 chart, possible targets of the possible correction in the future may be the retracements of 38.2% and 50.0% at 1326.90 and 1309.50 respectively
USD CHF, “US Dollar vs Swiss Franc”
As we can see at the H4 chart, the USD/CHF pair is forming a new descending impulse towards the post-correctional extension area between the retracements of 138.2% and 161.8% at 0.9644 and 0.9609 respectively. The next downside target may be at 0.9569. However, we can see the convergence being formed, that’s why the instrument may start a new pullback after reaching its downside targets.
At the H1 chart, the pair is trading downwards steadily. After finishing the downtrend, the price may start a new ascending correction. The targets of this correction may be the retracements of 38.2%, 50.0%, and 61.8% at 0.9723, 0.9772, and 0.9821 respectively.
Attention! Forecasts presented in this section only reflect the author’s private opinion and should not be considered as guidance for trading. RoboForex LP bears no responsibility for trading results based on trading recommendations described in these analytical reviews.
On Friday the 15th of January, trading on the euro closed up. After a breakout of the 1.2090 resistance, the single currency surged against the dollar to reach 1.2219. This rally was initially brought about by reports of progress being made in coalition talks in Germany. It was later revealed that Chancellor Markel had struck a deal with a rival party, the Social democratic Party, on forming a new government. The euro was further propped up by expectations that the ECB is soon to start reducing the scale of its QE program.
Day’s news (GMT+3):
09:00 Japan: machinery orders (Dec).
13:00 Eurozone: trade balance (Nov).
Fig 1. EURUSD hourly chart. Source: TradingView
The fundamentals have pushed the euro into overbought territory. This zone is located between the U3 and U4 lines. The U3 MA line diverges from the LB (sma 55) by 1%, while the U4 line diverges by 1.62%. The price is in this zone very rarely, and never for long.
Given the national holiday in the US today and the lack of economic events in Europe, my forecast for today is looking downwards. If Friday’s movements are in one direction, I predict Monday’s movements to go against Friday’s, without giving any consideration to the news.
In Asia, buyers have shifted the maximum to 1.2240. Having exited the wave structure, it’s time for a correction on the euro. The 45th and 67th degrees have been shifted to 1.2185 and 1.2157 respectively.
I’m well aware that as long as there are a lot of willing buyers for the dollar, the major players will be trying to push the euro up in order to change sellers’ minds and induce a reversal. When they start to believe that the euro is on the rise and start reversing their positions, the major players will abandon the euro to induce another reversal on our pair. 84% of open positions on the EURUSD pair at the moment are short.
On the current hour, the trend line runs through 1.2157. If we project this line into the future, then in the case of a decline, the price should meet this line at 1.2187 at 15:00 (GMT+3). I’m planning to take profit on the correction to the LB line.
As we can see at the H4 chart, the BTC/USD pair is still being corrected. The current descending impulse is heading towards the retracement of 61.8% at 10889.00. The next downside target is the retracement of 76.0% at 8925.00.
At the H1 chart, we can see the convergence being formed; the pair is steadily moving downwards. The target is at 10889.00. After reaching this level, the instrument may start another correction towards the retracements of 50.0%, 61.8%, and 76.0% at 14079.50, 14819.70, and 15708.10 respectively.
ETH USD, “Ethereum vs. US Dollar”
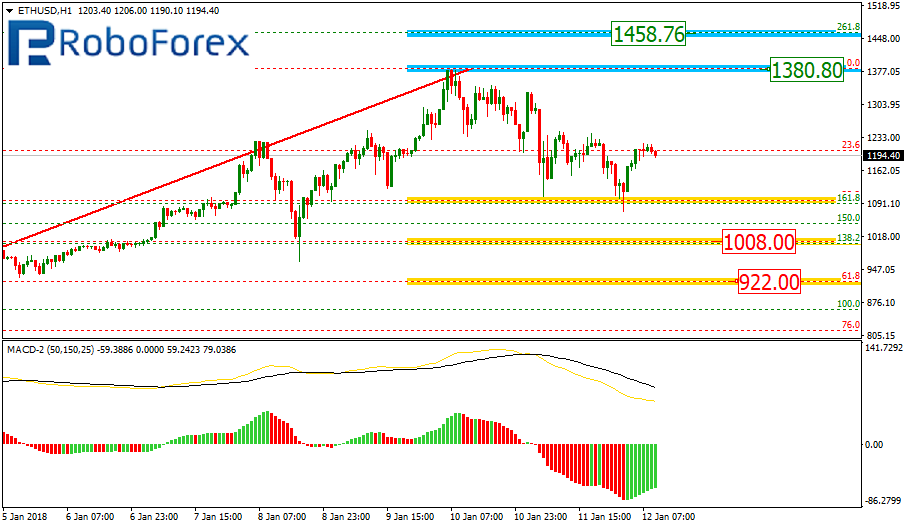
At the H4 chart, the ETH/USD pair is being corrected to the downside and has already reached the retracement of 38.2%. The next correctional targets are the retracements of 50.0% and 61.8% at 1008.00 and 922.00 respectively. If the price breaks the high at 1380.80, it may reach the retracement of 261.8% at 1458.76.
At the H1 chart, the situation is similar and confirms the scenario described above.
Attention! Forecasts presented in this section only reflect the author’s private opinion and should not be considered as guidance for trading. RoboForex LP bears no responsibility for trading results based on trading recommendations described in these analytical reviews.