On Wednesday the 17th of January, trading on the euro/dollar pair closed down. The euro dropped against the dollar from 1.2323 to 1.2177. This decline was catalysed by a jump in US 10Y bond yields as well as an upwards correction on the dollar. US bonds jumped from 2.53% to 2.58%.
Statements from two ECB officials put some downwards pressure on the euro. Both Villeory and Constâncio voiced concerns over the euro’s rally, saying that it’s a source of uncertainty given that this movement goes against the fundamentals. Constâncio added that the ECB’s monetary policy could remain loose for the long term.
The upswing to 1.2288 was brought about by the Bank of Canada. The central bank increased its key rate by 25 base points to 1.25%. Governor Steven Poloz said that the banks decisions depend on current economic decisions. After this news, the euro slipped to 1.2165 (-123 pips).
Day’s news (GMT+3):
10:00 China: GDP (Q4).
16:30 USA: initial jobless claims (12 Jan), building permits (Dec), housing starts (Dec), Philadelphia Fed manufacturing survey (Jan).
17:30 Eurozone: ECB Cœuré Speech.
19:00 USA: EIA crude oil stocks change (12 Jan).
Fig 1. EURUSD hourly chart. Source: TradingView
The main target was reached very quickly. The pair dropped without hindrance to 1.2196, followed by an upwards rebound to 1.2288 and the beginning of a head & shoulders model. I don’t think this model will complete its formation today though, as I’m not expecting the price to reverse once the neckline is broken through. In Asia, the euro is trading above 1.22. The range of 1.2188 – 1.2195 that I’ve highlighted has already lost its relevance.
So, what can we expect today?
Hourly cycles are signalling a continued decline for the euro. The daily candlestick for 17/01/18 is also suggestive of a declining euro. Moreover, it has both a long body and wick. The euro’s decline stopped at the 90th degree despite the reversal zone being between the 112th and 135th degrees.
The trend line extended from 1.2323 runs through 1.2248, where the 67th degree currently sits. My forecast is expecting a drop to the 45th degree, but we could see the trend line being tested. How can one enter the market given the current situation? To keep risk to a minimum, I’d look at selling from the 45th and 67thdegrees with a stop level above 1.2300, so that the overall risk doesn’t exceed your calculated risk. You could place a stop level above 1.2323, but by increasing the stop, the lot will decrease. The likelihood of the stop will decrease, but so will the level of profit should there be a positive outcome.
Zinc, Copper, Silver, Gold Junior Makes Bold Move into Cobalt Sector
Boreal Metals (TSX-V: BMX / Frankfurt: 03E) is a base & precious metals explorer in Scandinavia that is making a major push into the key green energy tech metal Cobalt (“Co“). The management team & Board have a remarkable amount of experience for a company with a market cap of $17 M plus ~$3 M in cash. [~52 M shares outstanding]
In addition to 4 projects with exploration potential in Zinc (“Zn“), Copper (“Cu“), Silver (“Ag“) & Gold (“Au“); 2 in Sweden & 2 in Norway (Boreal controls 38,266 hectares), on January 16th management announced the execution of a definitive agreement with EMX Royalty Corp. for the acquisition of the 13,115 hectare Modum Cobalt project.
The Modum project surrounds southern Norway’s historic Skuterud Mine (also known as the Modum Mine). Historic mine workings, prospects and trends of mineralization extend onto the property Boreal intends to acquire. Skuterud was Europe’s largest and highest grade producer of cobalt though the nineteenth century. CEO Karl Antoniuscommented,
“The Modum Project includes an impressive 12,000 hectares, that’s 12 kilometers of cobalt prospective geology, with stand-alone mining potential. We are excited about this timely acquisition of a high-grade cobalt project within an emerging battery production sector in the Nordic Region.”
Cobalt in Norway??
I was surprised to learn that Scandinavia is home to major cobalt operations. Umicore produces, refines and markets cobalt in Belgium. The world’s largest cobalt refinery (Kokkola) is in Finland. Glencore has a giant nickle refinery in Norway (Nikkelverk) that produced about 5,000 tonnes of refined cobalt in 2016.
I have to admit that at first blush, I wondered if this move into Co was the Company simply jumping on the bandwagon of a red hot sector. However, upon speaking with Mr. Antonius and Director Eric Jensen about the project and Norway’s history as a global Co supplier, I came away excited by the prospects. Norway, led by projects in the same district Modum is in, was a global leader in Co production for much of the 1800’s.
Over 80% of the world’s cobalt reportedly came from Norway’s Skuterud Mine district in the 1820s-30s. Boreal Metals’ strong in-country experience in Norway & Sweden makes it a natural fit to take this project and run with it. I should also mention that management is actively seeking additional Co properties in the region.
The historic grade of Co mined in the district was ~0.20%, equal to roughly US$156/tonne at the spot Co price of US$78k/tonne. A key risk factor is that this project depends on strong Co pricing for years to come. Importantly, Au is known to accompany the Co mineralization in the area, but the grades of a potential Au by-product was never determined. Miners in the 1800s would not have been interested in exploiting what they would have considered to be an insignificant Au value at the time. With Au now at US$1,340/oz, up US$100/oz in just the past month — a gold production credit could add significant value.
In the price chart above, readers can see that the Co price is up nearly 250% from January 2016. It’s at a high not seen since the 2008 price spike when the metal rose above US$110k/tonne. The outlook for both cobalt & lithium prices is quite robust.
Analysts correctly point out that the cost of both metals as a percentage of the total cost of a lithium-ion battery is low. Therefore, even though the cobalt price is up ~260%, and lithium prices are up by a similar amount over the past few years, overall battery costs continue to decline due to technology improvements and economies of scale.
Much has been written about conflict cobalt, the greater than 50% of global Co that comes from the Democratic Republic of Congo (DRC). Ongoing child labor law abuses have cast doubt on the country’s continued role as (by far) the largest producer of the metal.
There are a number of promising developments for Co production in Canada, but for the foreseeable future the DRC will dominate. Needless to say, every major user of Co on the planet is looking to source its needs outside of this troubled country.
By contrast to the DRC, Sweden & Norway rank # 4 & 6, respectively, out of 176 countries/territories on Transparency International’s annual Corruption Perceptions Index. Both countries are also highly ranked in the Fraser Institute Mining Survey; in the top quartile, with Sweden # 8 of 104 countries/territories.
In my view, this is a primary reason to own Boreal Metals in the first place, a truly world-class mining jurisdiction.
Zinc Price Has Made a Major Move Also….
As strong as the market is for cobalt, readers should also note the strength in zinc prices, up ~140% in the past 13 months, and at a high not seen since August 2007. Zinc inventory levels (a key pricing indicator) at the LME are at nearly a 10-yr. low, down over 80% since January 2013. Global Zn supply is dominated by China, which supplies more than the next 5 largest zinc producing countries combined. Additional zinc supply from Nordic countries would be well received.
One of Boreal’s flagship projects is Gumsberg (18,300 hectares)in southern Sweden. Gumsberg is surrounded by past producers and developers of zinc, copper, lead, silver & gold. Gumsberg was mined from the 13th century through the early 1900’s. It hosts over 30 historic mines, most notably the Östrasilverberg mine, which was the largest silver mine in Europe between 1300 and 1590. Despite its long-lived production history, relatively little modern exploration has taken place on the project.
Compare these 2016 drill results at Gumsberg to the reported Zn grades at nearby past producers, this is a highly promising, near-surface, early-stage project. The Company is conducting a follow up drill program with results expected in March.
In northern Norway Boreal has the 100%-owned Burfjord Copper-Gold project. CEO Antonius recently commented,
“The IP Geophysical Survey increases our confidence in the strike and depth continuity of copper mineralization at Burfjord.Copper mineralization at Burfjord consists of high-grade copper veins within a broader mineralized envelope and the results of this survey affirm Boreal’s target size criteria.”
Mineralization occurs as both high-grade Cu-Au bodies that were historically mined at high cutoff grades (>3% Cu), but management has recognized significant volumes of bulk tonnage potential Cu-Au mineralization developed in stockwork vein arrays throughout the property. Limited historical drilling includes a 7 meter intercept of 3.6% Cu.
Conclusion
Boreal Metals (TSX-V: BMX / Frankfurt: 03E) now has 5 high-quality projects, 3 in Norway and 2 in Sweden. I touched briefly on 2 projects, but I will have more to say about all of the Company’s projects next month. Chairman & Director Patricio Varas, P. GEO has over 30 years’ experience at a wide range of operating mines and exploration projects. He’s worked on world-class deposits and founded Western Potash Corp. {See bio above}
Varas & CEO Antonius are joined by a number well seasoned mining and funding professionals, {see bios on website}including Director Eric Jensen – Chief Geo & GM of Exploration for EMX Royalty Corp. and Daniel Maceneilm MSC, P. GEO.
Combined, management, the Board & Technical Advisory team have extensive experience in geoscience, mine engineering, geology, exploration (including important discoveries), project development, feasibility studies, corporate management, venture capital, private equity and capital raising (project funding). All of this talent wrapped up in a $17 Mmarket cap company with ~ $3 M in cash. Five projects spanning zinc, copper, silver, gold and now cobalt – in a world-class mining jurisdiction, with more cobalt property acquisitions being considered.
Disclosures: The content of this article is for illustrative and informational purposes only. Readers fully understand and agree that nothing contained herein, written by Peter Epstein of Epstein Research, [ER]including but not limited to, commentary, opinions, views, assumptions, reported facts, estimates, calculations, etc. is to be considered implicit or explicit, investment advice. Further, nothing contained herein is a recommendation or solicitation to buy or sell any security. Mr. Epstein and [ER] are not responsible for investment actions taken by the reader. Mr. Epstein and [ER] have never been, and are not currently, a registered or licensed financial advisor or broker/dealer, investment advisor, stockbroker, trader, money manager, compliance or legal officer, and they do not perform market making activities. Mr. Epstein and [ER] are not directly employed by any company, group, organization, party or person. Shares of Boreal Metals are highly speculative, not suitable for all investors. Readers understand and agree that investments in small cap stocks can result in a 100% loss of invested funds. It is assumed and agreed upon by readers that they consult with their own licensed or registered financial advisors before making investment decisions.
At the time this article was posted, Peter Epstein owned shares in Boreal Metals and the Company was an advertiser on [ER]. By virtue of ownership of the Company’s shares and it being an advertiser on [ER], Peter Epstein is biased in his views on the Company.Readers understand and agree that they must conduct their own research, above and beyond reading this article. While the author believes he’s diligent in screening out companies that are unattractive investment opportunities, he cannot guarantee that his efforts will (or have been) successful. Mr. Epstein & [ER] are not responsible for any perceived, or actual, errors including, but not limited to, commentary, opinions, views, assumptions, reported facts & financial calculations, or for the completeness of this article. Mr. Epstein & [ER] are not expected or required to subsequently follow or cover events & news, or write about any particular company or topic. Mr. Epstein and [ER] are not experts in any company, industry sector or investment topic.
Let our free special report give you some much needed answers
By Elliott Wave International
“Wild” only begins to describe Bitcoin’s price action. Less than 12 months ago, it traded as low as $1200. By early December, it hit a high of $19,891 — on the CBOE, Bitcoin futures topped $20,000.
Side note: Who could have thought that something called a “digital currency” that first appeared in 2009 and was widely available for 1 cent (and no one cared!) eight years later would be going for $20,000 a pop? It’s the wildest financial craze of our time. Wait, scratch that — it’s the wildest financial craze ever, because Bitcoin is up not 100%, not 1000%, not even 10,000%. Since inception, Bitcoin is up 32,000,000%. Yes, thirty-two MILLION percent.
Yet, by December 22, Bitcoin crashed to $10,400. It wasn’t entirely unexpected. The day before, Elliott Prechter, Head of Computer Analysis at Elliott Wave International, told Newsmax this:
Elliott Prechter: I Wouldn’t Touch Bitcoin, Risk of Collapse Too Big
Thursday, 21 Dec 2017 10:38 AM
“We provided the first financial publication in the world that discussed bitcoin when it traded at 6 cents in 2010. Amidst obscurity, skepticism and disinterest, we explained the currency and said it had great potential,” says Prechter, who left Seattle and Microsoft in early 2011 to help start an algorithmic hedge fund in Las Vegas.
Today, however, he says if you aren’t already in the game when it comes to bitcoin, you might be better off sitting this one out.
“Bitcoin had great potential in 2010, but not in 2018. With today’s elevated prices, manic psychology and weak fundamentals, I wouldn’t touch it. The risk that it could collapse is too great.”
Prechter says bitcoin could prove to be as fragile as a flower, or more specifically a tulip, comparing the bitcoin phenomena to the 1600s tulip mania in the Netherlands.
After the December crash, Bitcoin rebounded as high as $17000 — only to swing down again, trading in the $10,000 range. What’s behind these wild gyrations?
Analysts seeking “rational” explanations are looking in the wrong places. The right answer is investor psychology. The same CNBC article we quoted above gets at the heart of the matter, saying that the latest bout of Bitcoin market panic.
“…lead the herd to sell with no other justification than fear…”
Fear and greed among the herd are what’s driving cryptocurrencies’ volatility. In other words, what’s driving these trends is investor collective psychology.
And nothing helps you track and forecast market psychology like Elliott waves.
In our nearly 40 years in the business, we applied Elliott waves to hundreds of different markets — some mainstream, some exotic. When we first studied cryptocurrency charts, we again discovered familiar price patterns. To understand why, you must first know what Elliott waves are.
Each price move on a chart – or “wave,” as well call them — shows you shifts in the collective psychology of market participants. These bullish/bearish shifts aren’t random, but patterned: 5 waves in the direction of the larger trend and 3 waves against it. Once you establish where in this pattern a market is, you can forecast with confidence where prices should go next.
That’s it, whether you’re looking at the Dow, crude oil – or Bitcoin and Ethereum.
You might think that in extremely emotional markets like cryptos Elliott waves may lose effectiveness. Yet as a rule, the more emotional the market is, the clearer the wave patterns become.
Whenever a brand-new technology emerges, it often attracts a lot of investor interest. We saw it with the internet in the late 1990s. We’re seeing it today with Bitcoin. Both have been described as bubbles. The internet survived, and thrived. Blockchain technology behind cryptocurrencies holds much promise, as well. So, despite the tremendous volatility, it may be too soon to write off cryptos as a class.
To help you prepare for what’s next, we put together a free report, “Bitcoin: The Greatest Bubble of All Time” that gives you our latest thoughts.
US New Sanctions amid Iran’s Transition and Pivot to the East
By Dan Steinbock
Iran’s recent volatility reflects US effort to undermine the nuclear accord as Iran is amid economic transition and increasingly looking toward the East.
At the end of December, a series of protests against economic policies erupted in Iran. As they spread, their scope expanded to include political opposition against the government. As President Trump tweeted his support for the protesters and criticism of the government, pro-government marchers filled the streets.
According to Western media, the protests were the result of unfavorable economic policies by Iranian President Rouhani’s administration and popular dissatisfaction with the “theocratic regime.”
Supreme Leader Ayatollah Ali Khamenei accused unspecified “enemies” – reportedly, US, Israel, and Saudi Arabia – for the turmoil. On January 3, the head of Iran’s Revolutionary Guards, Major General Mohammad Ali Jafari, announced the defeat of the “sedition” in the country.
Next, the Trump administration placed sanctions on five subsidiaries of the Shahid Bakeri Industrial Group – a defense group that is a key producer of Iran’s ballistic missiles and that is already under US sanctions.
What is going on in Iran?
US struggle for new sanctions and regime change
After years of diplomacy, the comprehensive nuclear accord (JCPOA, July 2015) offered Iran relief from US, UN and multilateral sanctions on energy, financial, shipping, automotive and other sectors. These primary sanctions were lifted after the International Atomic Energy Agency’s (IAEA) certification in January 2016 that Iran had complied with the agreement. Yet, secondary sanctions on firms remained in place, along with sanctions applying to US companies, including banks.
Then Washington opted for a U-turn. Following the House of Representatives, the Senate unanimously extended the Iran Sanctions Act (ISA) for a decade in late 2016. Despite the Obama sanctions relief, most Democrats reversed their positions surprisingly quickly.
As Trump arrived in the White House, he began developing a far more muscular policy against Iran. It is dictated by his effort to benefit from Saudi economic and geopolitical support. Last May, he signed a $350 billion arms deal with Saudi Arabia; the largest in US history. Afterwards, he began the push to counter Iran’s regional and strategic weapons programs.
In October – two months before the Iranian protests – the Trump administration designated for sanctions additional missile and IRGC-related entities, while threatening to cease implementing the JCPOA unless Congress and U.S. allies successfully address the agreement’s weaknesses.
By mid-January, Trump must decide whether to recertify Iran’s compliance with the 2015 nuclear deal with world powers (which he decided not to do in October), and whether to waive U.S. nuclear-related sanctions that were suspended under the landmark agreement. If Trump withdraws the US from the JPOA, his administration would have to revoke waivers, decline to renew waivers, or trigger a provision of the Iran Nuclear Agreement Review Act under which Congress might act on legislation to re-impose sanctions -all of which would penalize Iran’s economy, while alienating other JCPOA signatories.
Along with economic pressures, Trump seized covert operations, even though Western reports have suppressed the role of the highly controversial Michael D’Andrea. The CIA officer was named by the New York Times half a year ago. After Trump made the conservative Iran hawk Mike Pompeo the head of the CIA, the abrasive uber-hawk D’Andrea became the head of CIA’s Iran operations.
After the 9/11 attacks, the D’Andrea, known as the “Dark Prince” or “Ayatollah Mike” in CIA, was influential in the capture of Osama bin Laden and deeply involved in the detention and interrogation program that was condemned as inhumane and ineffective in the 2014 Senate report. D’Andrea’s operatives, together with the Israeli Mossad, played key role in the 2008 assassination of Hezbollah’s operations chief Imad Mugniyah. He ramped up the drone program in Pakistan and later in Yemen, with the support of President Obama.
It is not difficult to see D’Andrea’s covert-operation signature in Iran’s recent events.
Iran’s quest for economic stabilization
Between 2010 and 2013, the sanctions hurt Iran’s economy contributing to the fall of crude oil exports from 2.5 million barrels per day to 1.1 million by mid-2013. That, in turn, was compounded by the plunge in oil prices since early 2014. Before stabilization in 2015, Iran’s economy shrank by 9% in two sanctions years.
Since 2015, Iran’s economy has been stabilizing. Sanctions relief enabled Iran’s oil exports to return to nearly pre-sanctions levels, allowed Iran to regain access to funds held abroad, boosting 7% overall economic growth in 2016. Foreign energy firms have begun making new investments in Iran’s energy sector and major aircraft manufacturers have sold Iran’s commercial airlines new passenger aircraft. The relief also contributed to the political victory of Iran’s President Hassan Rouhani in the May 2017 presidential election.
Growth has also begun to broaden to the non-oil sector. Real GDP growth is projected to reach 4.2% in 2017/18 and is expected to be sustained or even rise toward 4.5% over the medium-term if financial sector reform takes hold.
In the West, dire employment prospects are often seen as the key reason for Iranian protests, yet the geo-economic context is ignored. According to the IMF, Iran’s unemployment is almost 13%, with female and youth unemployment at 21% and almost 30%, respectively. However, in Saudi Arabia, unemployment is about 13%, youth unemployment exceeds 33% and a third of working-age women are unemployed. Indeed, most Arab countries suffer from excessive unemployment and high female and youth unemployment – not just Iran.
Unlike the 2009 protests in Iran, which were led by urban middle class, recent demonstrations have been fueled by discontent in rural areas and small cities; the core constituencies of former president Mahmoud Ahmadinejad, who seeks a political comeback and was arrested for inciting unrest against the government.
It is this economic unease that is being further stirred by new US sanctions and alleged destabilization efforts – which aim to undermine Iran’s ongoing policy recalibration in the Middle East.
Shifting toward East
Only two weeks before the protests, Iran’s media reported that the country would join the Russia-led Eurasian Economic Union (EEU) in early 2018. Turkey and Central Asia are shifting away from the Brzezinski Doctrine of a US-led Central Asia.
In addition to Russia, the EEU includes Kazakhstan, Belarus, Kyrgyzstan and Armenia. It is meant to guarantee free transit of goods, services, capital and workers among member states. The participation of Iran in the EEU would increase the Union’s population to 260 million and its GDP to close to $1.9 billion -which would make it the world’s eighth largest regional entity, right after India.
Even more important is Iran’s proposed role in the evolving One Road One Belt initiative (OBOR). Through the worst days of the 2010-16 sanctions, major Asian countries remained engaged in Iran’s economy. In the coming years, these countries are likely to support Iran to emerge from the sanctions isolation, to diversify its economy away from oil and gas and to become a major regional trading hub.
Recently, China and South Korea’s oil imports have reached or surpassed pre-sanction levels, while purchases by Japan and other Asian countries have been slower to rebound. Iran has regained access to some $115 billion in hard currency held abroad (whose repatriation was restricted by foreign banks to comply with US sanctions). At the same time, China’s share of Iran’s global trade has climbed from 20% in 2010 to 31% in 2016. Moreover, foreign direct investment in Iran has soared, growing five-fold to 12.2 billion in 2016.
America’s assertive sanctions policy is not just misguided but self-defeating. Since it penalizes rightful compliance, its credibility is crumbling across the Middle East. It is alienating US allies and strengthening US adversaries. It can slow Iran’s participation in OBOR initiatives and its reintegration in the world economy but it cannot stop Iran from taking its rightful place in the family of nations.
About the Author:
Dr. Dan Steinbock is an internationally recognized strategist of the multipolar world and the founder of Difference Group. He has served as research director at the India, China and America Institute (USA) and visiting fellow at the Shanghai Institutes for International Studies (China) and the EU Center (Singapore). For more, see https://www.differencegroup.net/
The original commentary was released by China-US Focus on January 15, 2018
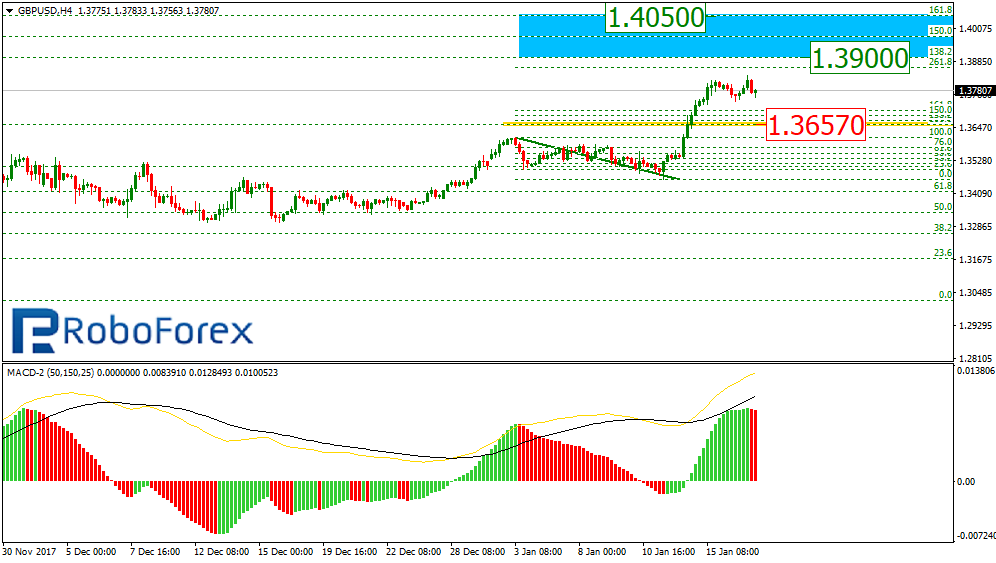
As we can see at the H4 chart, after breaking the high at 1.3657, the GBP/USD pair is still trading upwards and may grow towards the post-correctional extension area between the retracements of 138.2% and 161.8% at 1.3900 and 1.4050 respectively.
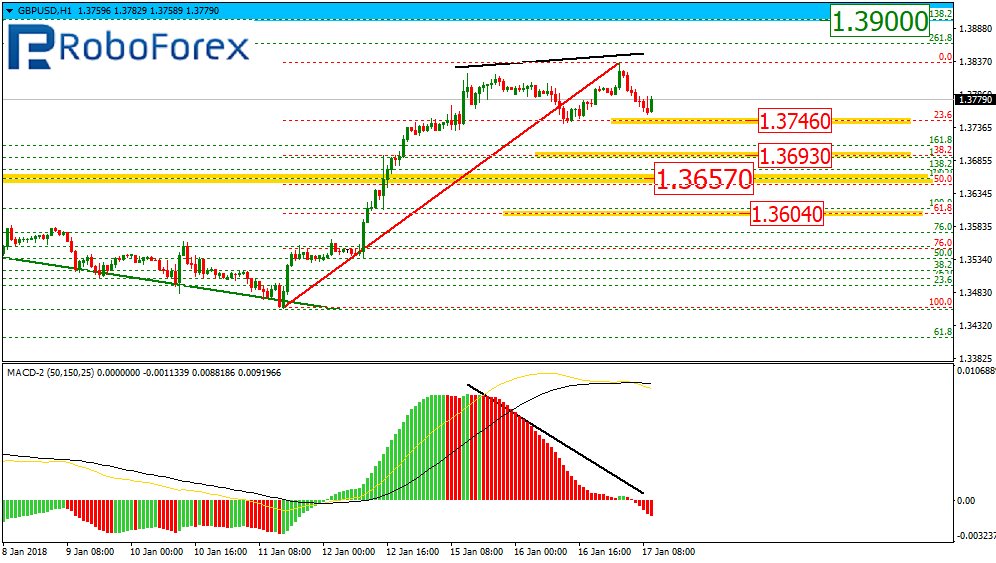
At the H1 chart, the divergence forced the pair to reverse downwards and start a new descending correction. The targets of this correction may be the retracements of 23.6%, 38.2%, 50.0%, and 61.8% at 1.3746, 1.3693, 1.3657, and 1.3604 respectively. After that, the uptrend is expected to continue.
EUR JPY, “Euro vs. Japanese Yen”
As we can see at the daily chart, the divergence is almost over, which means that the EUR/JPY pair may reverse downwards. The closest targets of this decline may be the retracement of 23.6%, 38.2%, and 50.0% at 131.50, 128.40, and 125.80 respectively. The resistance level is close to the current high at 136.63.
At the H4 chart, the pair may break the high at 136.63 and then continue growing towards the post-correctional extension area between the retracements of 138.2% and 161.8% at 138.00 and 138.85 respectively. However, if the price breaks 133.02, it may start a new long-term downtrend with the first target at 131.50.
Attention! Forecasts presented in this section only reflect the author’s private opinion and should not be considered as guidance for trading. RoboForex LP bears no responsibility for trading results based on trading recommendations described in these analytical reviews.
The EUR/USD pair is still consolidating at the top of the ascending wave; it has updated the high of the range and right now is forming another descending impulse with the target at 1.2180. Later, in our opinion, the market may grow towards 1.2247 and then start another descending impulse to reach 1.2045.
GBP USD, “Great Britain Pound vs US Dollar”
The GBP/USD pair is still consolidating at the top of the ascending wave; right now, it is forming a new descending structure with the target at 1.3650. After that, the instrument may grow towards 1.3739 and then start another decline to reach 1.3500.
USD CHF, “US Dollar vs Swiss Franc”
The USD/CHF pair is consolidating. Possibly, the price may break this range upwards and start another ascending wave with the first target at 0.9709. Later, in our opinion, the market may continue falling to reach 0.9640.
USD JPY, “US Dollar vs Japanese Yen”
The USD/JPY pair has reached the target of another descending structure and right now is growing. Possibly, the price may be corrected towards 112.55. The first target is at 111.44.
AUD USD, “Australian Dollar vs US Dollar”
The AUD/USD pair is consolidating at the top of the ascending wave. We think, today the price may fall towards 0.7869 and then form one more ascending structure with the target at 0.7940.
USD RUB, “US Dollar vs Russian Ruble”
The USD/RUB pair is trading below 56.45. According to the main scenario, the price is expected to fall the target at 55.88. An alternative one suggests that the instrument may form another correctional structure to reach 56.90 and then resume falling towards the above-mentioned target.
XAU USD, “Gold vs US Dollar”
Gold is consolidating. If later the price breaks 1332.00 to the downside, the market may fall towards 1320.00; if 1344.00 to the upside – grow with the target at 1357.00.
BRENT
Brent has rebounded from the upside border of its consolidation range and right now is falling. Possibly, today the price may be corrected towards 68.48 and then grow to reach 70.00. If later the price breaks this level to the upside, the market may continue moving upwards with the target at 71.70.
Attention! Forecasts presented in this section only reflect the author’s private opinion and should not be considered as guidance for trading. RoboForex LP bears no responsibility for trading results based on trading recommendations described in these analytical reviews.
On Tuesday the 17th of January, trading on the euro/dollar pair closed 3 pips down. The intraday low was 1.2195.
In the European session, the euro dropped after reports from Germany, where the Social Democrats are split on whether or not to join in a coalition government with Angela Merkel’s Christian Democrats. Later, a Reuters report intensified the downwards pressure on the pair. The agency reported that the ECB is unlikely to taper its bond purchasing program at their meeting next week.
During trading in the US, the euro bulls completely recovered their losses. Buyers gradually pushed the price back up to the 1.2240 resistance over the course of 4 hours. As soon as this barrier was overcome, the pair’s growth gathered pace. Traders are once again losing interest in the US dollar.
Day’s news (GMT+3):
13:00 Eurozone: CPI (Dec).
17:15 USA: industrial production (Dec), capacity utilisation (Dec).
In Asia, the euro has risen by 56 pips to reach 1.2323 in the space of 2 hours. I couldn’t find a reason for shorting the dollar so I’ve laid out 2 possible scenarios on today’s chart.
Due to the 85-pip drop on the euro to 1.2238, we have a contradictory situation. Now I’ll explain why.
First of all, the situation in Germany with regards to forming a coalition government has yet to be resolved. Secondly, the euro’s rise is being hindered by the upcoming ECB meeting. Thirdly, a pin bar model is forming on the daily timeframe. If the day closes at 1.2245 or lower, this will create a sell signal.
On the other hand, the trend is bullish. As we can see, despite all the negative news surrounding the euro, a lot of long positions were opened on it as it dropped to the LB balance line, leaving a long shadow on the candlestick behind them. The pin bar isn’t fully formed yet, so this could all go out the window by the end of the day.
So, what’s going to happen?
Scenario 1: continued decline on the euro to the lower boundary of the channel (at 1.2212), strengthening the bearish daily candlestick. If we see drop below 1.2195 on the hourly timeframe, there’s a possibility of a double top forming. The double bearish divergence between the price and the AO indicator works in favour of this scenario.
Scenario 2: price rebound from the 67th degree with subsequent growth to 1.2240.
The European calendar is virtually empty today. The only important report to come out is Eurozone CPI data. Today’s main event is the Bank of Canada’s meeting followed by a press conference with Governor Steven Poloz. Markets are expecting a 25-base-point hike to interest rates. It’s still unclear how markets will react to this.
RoboForex is announcing Bitcoin as a new base currency for trading accounts. Now the Company’s clients have an opportunity open trading accounts, deposit and withdraw funds in BTC currency (Bitcoin). Trading accounts with this new base currency can be opened in MetaTrader 4 and MetaTrader 5 platforms.
The BTC base currency is available for Pro-Standard accounts and RoboForex Wallets. In the first place, an opportunity to open trading accounts in bitcoins will be interesting to those traders, who store their funds in this cryptocurrency. The digital currency will help them to diversify their risks more effectively by reinvesting funds into other financial instruments.
Especially for the clients who opened their accounts in BTC, we’ve enabled deposits/withdrawals of funds via Bitcoin system.
Commission for withdrawing funds: 0.001 BTC (1.0 mBTC).
The amount allowed to be deposited/withdrawn for a transaction: from 0.00001 BTC (0.01 mBTC).
Andrey Goilov, RoboForex analyst says: “Cryptocurrencies are, without any doubts, the major trend of 2017. We’re actively working on improving trading conditions the Company offers to traders and extending access to different financial markets. The current demand for cryptocurrencies trading is pretty high and we’re quickly responding to it by introduction of new products and significant improvement of our services.”
About RoboForex
RoboForex Ltd is a company, which delivers brokerage services on a world-wide basis. The company provides traders, who work on financial market, with access to its own trading platforms. RoboForex Ltd has the brokerage license IFSC/60/271/TS/17. More detailed information about the Company’s activities and operation can be found on the official website at www.roboforex.com.
A new debate has been unleashed about Japan’s wartime sex slaves and the weight of history, amid the year 2018 which many see internationally as the “Year of the Woman.”
In early December, a memorial was erected along the Roxas Boulevard facing Manila Bay. It commemorates the Filipino “comfort women”, who were forced to work as sexual slave labor in Japanese military brothels during World War II. Soon thereafter, a spokeswoman from Japan’s Ministry of Foreign Affairs said it was “extremely regrettable” that comfort women statues had been erected.
In reality, the extent of Japan’s wartime sexual slavery has been downplayed until recently.
According to conservative historian Ikuhiko Hata, there were barely 20,000 “comfort women” in the 1930s and 40s and they were largely willing prostitutes, with no or minimal direct involvement by Japanese military. However, the very notion of the “comfort women” is a euphemism for sex slaves and historical revisionism. In fact, even Hata’s initial estimate was 90,000 but he revised the number downward following his political alignment with Japanese conservatives in the late 1990s.
In reality, the number of Japan’s wartime sex slaves is today estimated at some 200,000 women. According to Chinese scholars in Shanghai, in which a “comfort station” was established in the Japanese concession already in 1932, the real number of “comfort women” may have been as high as 360,000-400,000.
Unlike Hata and other Japanese historians would like to believe, these women were not prostitutes and Japanese military was involved. Most were from areas occupied by Imperial Japan, particularly China and Korea, but also the Philippines. There were also “comfort stations” in Myanmar, Thailand, Vietnam, Malaysia, Taiwan, Indonesia, Singapore, East Timor and other Japanese-occupied territories. Additionally, hundreds of women in the region were involved from the Netherlands and Australia.
International debate
Japan’s protest in the Philippines is a part of a regional debate. In December, 2015, Prime Minister Shinzo Abe and South Korean President Park Geun-hye reached an agreement to settle the “comfort women” dispute. Tokyo agreed to pay $8.3 million to a fund supporting surviving victims. South Korea would refrain from criticizing Japan regarding the issue and to work to remove a memorial statue for the victims. The strange pact was criticized by South Korea’s current president but signed by its conservative then-president Park who was later impeached for corruption.
Recently, Seoul has demanded more recognition for its victims. As the UN Committee on the Elimination of all Forms of Discrimination against Women said in 2016: “An unequivocal official apology recognizing the full responsibility of the then-Japanese government and military, as well as adequate reparations would protect and uphold the victims’ right to truth, justice and reparation.”
Yet, last fall, a UNESCO committee deferred its decision on the listing of the ”comfort women” archives on its Memory of the World Register, which preserves documentary heritages – after Japan resisted paying its UNESCO dues.
Thereafter, the UN human rights agency (OHCHR) called on Japan to acknowledge its violation of the human rights of “comfort women,” to take legal responsibility and to punish responsible individuals for the issue. The OHCHR also expressed concerns regarding the Japanese government’s revisions of history textbooks.
As these debates continue, the remaining “comfort women” are passing away, amid a painful struggle for recognition.
So why would Japan and some of its allies like to have the issue go away? The simple answer is that the matter is intimate to Tokyo – and Washington.
Imperial Japan’s sexual slavery in the 1930s and ‘40s
Unlike his predecessors as Prime Minister and the head of the Liberal Democratic Party, Abe has far-right views about history. He would like to restore the “honor” of his beloved grandfather, Nobusuke Kishi, and the romanticized wartime generation.
That’s why in the late 1990s, Abe led the Japanese history textbook reform, which downplays Japanese war crimes. That’s also why he has publicly questioned the “comfort women” history and stated that Class A war criminals are not criminals under Japan’s domestic law. To him, the two issues are intertwined.
In Japan, Abe comes from a political family dynasty. His grandfather Kan Abe and father Shintaro Abe were prominent politicians. His mother is the daughter of Nobusuke Kishi, Japan’s Prime Minister and America’s key ally in the late 1950s.
However, starting in 1933, Kishi attacked democracies and praised Nazi Germany as Japan’s model. As he spent time in the Japanese puppet state Manchukuo, he built ties with Japanese “total war” militarists, statist “reform bureaucrats,” business leaders and was involved in the opium trade with Yakuza which was used to keep Chinese labor “in line.”
In 1937, Kishi signed a degree calling for the use of slave labor in Manchukuo and northern China. The enslavement of men paved the way to the exploitation of Chinese and Korean women as sex slaves and the expansion of sexual slavery into Japan’s occupied colonies in Asia. As a believer in the Yamato race theory, Kishi thought that the racially superior Japan as destined to rule Asia “eternally.”
Due to Kishi’s brutal rule in the Manchukuo and his participation in the Tojo War Cabinet during World War II, he was imprisoned for over three years as a Class A war crime suspect – until Washington’s Cold War architects intervened.
In the postwar era, prominent Nazis were prosecuted in the Nuremberg trials in the mid-1940s. In the 1950s, America was amid the Cold War. So in Japan, many war leaders were enlisted by the U.S. to suppress Japanese communists and socialists. That’s how Kishi was released from the Sugamo Prison and became known as “America’s Favorite War Criminal.” He played a key role in the creation of the “1955 System,” which made the Liberal Democratic Party the dominant political force in Japan and America’s key ally – until today.
That’s the history Abe would prefer to revise.
Need to remember
Wartime sex slaves are not “just history.” In Japan, the lingering imperial fantasies contribute to economic decline. Abe’s economic reforms, though controversial, are undermined by his politics, which promotes divisive remilitarization and US-style state secrecy laws that many Japanese oppose.
Regionally, revisionist views continue to alienate Japan from its regional neighbors.
Economically, Japan is one of the world’s ten most competitive countries, according to World Economic Forum (WEF). Yet, its ranking in the WEF Global Gender Gap Report is deplorable. In gender equality, Japan is not among the top-10, not even among the top-100 but 114th (!); well behind Myanmar, India and Nepal, and barely ahead of Ethiopia and Nigeria.
Forced silence about wartime sexual slavery is part of a broader legacy of sexual discrimination that casts a long shadow over the position of women, their human development and economic potential in Japan.
So if one simple statue in Manila can remind us about Japan’s wartime sexual slavery and that “those who cannot remember the past are condemned to repeat it,” that will ultimately unite us all against what’s wrong – everywhere.
About the Author:
Dr. Dan Steinbock is an internationally recognized strategist of the multipolar world.and the founder of Difference Group. He has served as at the India, China and America Institute (USA) , the Shanghai Institutes for International Studies (China) and the EU Center (Singapore). For more, see https://www.differencegroup.net/
The original column was published by The Manila Times on January 15, 2018
Trading opportunities on the currency pair: The price is moving according to plan. Buyers have overcome the resistance at 134.50 and reached their intermediate target of 136.00. Now, the road to 139 is open (162% of the 114.85 – 124.08 range). We could see a pullback before the rally recommences. It won’t resume at all, however, if the price exits the 1-1 channel.
Background:
The last idea on this currency pair was published on the 6th of November, 2017, with the pair trading at 132.37. At the time, I was expecting the yen to rise against the euro after Shinzo Abe’s election victory.
So long as the Bank of Japan maintains their current monetary policy until mid-April this year, I expect to see the yen drop against the euro to 141.06 (high from June 2015). Since my forecast is for the mid-term, I’ve got 136 and 139 as intermediate targets.
At the end of December last year, the pair moved out of the sideways trend to reach the first target of 136, having jumped to 136.64. So, the first target has been reached, the next one is 139.
Current situation:
From the 9th to the 10th of January, the yen appreciated 1.7% against the US dollar to reach 133.02. This growth prompted rumours that the Bank of Japan had reduced its purchases of Japanese 10-to-25-year government bond and 25-to-40-year bonds each by 10bn JPY (88.39m USD). Traders interpreted this as a slight tightening of monetary policy. These rumours were later quashed.
By the end of the week, the pair had recovered to 135.39. Other factors strengthening the euro include the recently published minutes of the ECB’s latest meeting on monetary policy as well as the breakthrough in coalition talks in Germany. This news pushed German bond yields up, bringing the euro along with them. The minutes revealed that the ECB may start curtailing is QE program sooner than planned.
After buyers broke through the 134.50 resistance and reached their intermediate target of 136.00, the road towards 139 opened up (162% of the 114.85 – 124.08 range). We could see a pullback before the rally recommences. If the price exits the 1-1 channel, the rally will not resume.