Author Archive for InvestMacro – Page 449

Fibonacci Retracements Analysis 22.01.2018 (GOLD, USD/CHF)

Article By RoboForex.com

XAU USD, “Gold vs US Dollar”

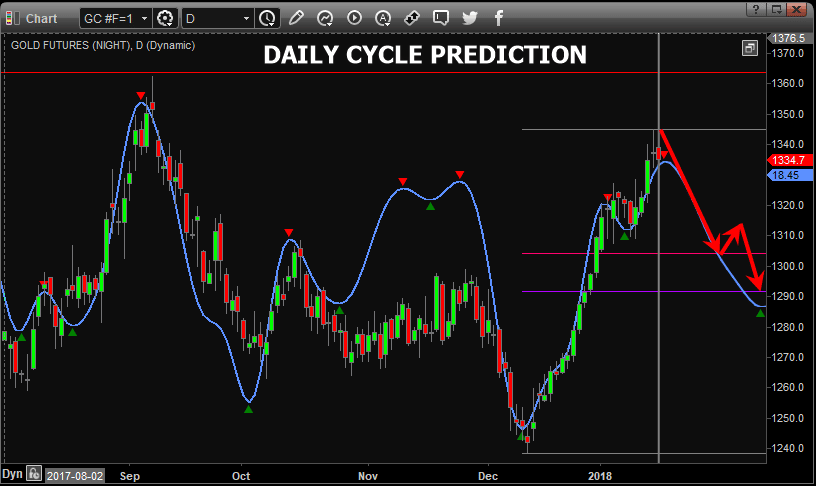
At the H4 chart, the divergence made the XAU/USD pair start a new descending correction. The targets are the retracements of 23.6%, 38.2%, and 50.0% at 1319.17, 1303.11, and 1290.61 respectively.

GOLD1

At the H1 chart, the pair may move towards the local high at 1344.64. After breaking it, the price may grow towards the post-correctional extension area between the retracements of 138.2% and 161.8% at 1352.20 and 1357.10 respectively.

GOLD2


USD CHF, “US Dollar vs Swiss Franc”

At the H4 chart, the downtrend continues. Apart from this, we can see the convergence being formed, which may indicate a possible reverse. The next downside targets are the local low at 0.9536 and inside the post-correctional extension area between the retracements of 138.2% and 161.8% at 0.9495 and 0.9471 respectively.

USDCHF1

As we can see at the H1 chart, after reaching the targets, the pair may start trading towards the area between the retracements of 23.6% and 50.0%. The main target is at 0.9724.

USDCHF2


RoboForex Analytical Department

Article By RoboForex.com

Attention!
Forecasts presented in this section only reflect the author’s private opinion and should not be considered as guidance for trading. RoboForex LP bears no responsibility for trading results based on trading recommendations described in these analytical reviews.

Forex Technical Analysis & Forecast 22.01.2018 (EUR/USD, GBP/USD, USD/CHF, USD/JPY, AUD/USD, USD/RUB, GOLD, BRENT)

Article By RoboForex.com

EUR USD, “Euro vs US Dollar”

The EUR/USD pair is forming another descending structure with the target at 1.2060. Later, in our opinion, the market may start another correction to reach 1.2185.

EURUSD


GBP USD, “Great Britain Pound vs US Dollar”

The GBP/USD pair has completed the first descending impulse along with the correction. We think, today the price may form the second impulse to reach 1.3712. After that, the instrument may be corrected towards 1.3825.

GBPUSD


USD CHF, “US Dollar vs Swiss Franc”

The USD/CHF pair has finished another ascending impulse. Possibly, today the price may fall towards 0.9590. Later, in our opinion, the market may continue growing with the first target at 0.9755.

USDCHF


USD JPY, “US Dollar vs Japanese Yen”

The USD/JPY pair is forming another ascending structure with the target at 111.71. After that, the instrument may be corrected towards 110.96 and then continue growing to reach 112.60.

USDJPY


AUD USD, “Australian Dollar vs US Dollar”

The AUD/USD pair is forming the first descending impulse. The first target is at 0.7897.

AUDUSD


USD RUB, “US Dollar vs Russian Ruble”

The USD/RUB pair is trading below 56.92. Possibly, the price may form another ascending structure towards 56.95. Later, in our opinion, the market may continue forming the third descending wave to reach 55.88.

USDRUB


XAU USD, “Gold vs US Dollar”

Gold is consolidating at the top of the ascending wave. Possibly, the price may grow to reach 1340.00. However, according to the main scenario the market is expected to fall towards the first target at 1308.00.

GOLD


BRENT

Brent is trading above 68.60. According to the main scenario, the pair is expected to continue growing inside the uptrend towards 70.20. After that, the instrument may break this level and then continue moving upwards with the target at 72.00.

BRENT


RoboForex Analytical Department

Article By RoboForex.com

Attention!
Forecasts presented in this section only reflect the author’s private opinion and should not be considered as guidance for trading. RoboForex LP bears no responsibility for trading results based on trading recommendations described in these analytical reviews.

The EUR/USD may have run out of puff

By Adinah Brown

From a technical standpoint, it may be of relief to traders with EUR/USD short positions, that the pair may be out of momentum to push higher. If the currency trades around the current rate until the end of the week, we may see the chart throw up a convincing bearish doji candle stick pattern (bearish engulfing on the daily). Checking to see if the pair is now overbought, the RSI indicator signals that it is, in both the daily and weekly chart. The current bullish run seems to be a continuation of push that started back in December 2016 – quite a long duration run for a highly traded currency.

Earlier this week, the currency pushed above a previously credible resistance level around 1.22. This may be now used as a support line to push even higher, however, yesterday, the price reached another obstacle which is a support line going back to 2005. This level may act as a point of resistance by which assertive sellers can enter the market. I think this level, or somewhere near it, will provide the grounds for the price to stabilise or retrace.

Should the price ignore this immediate resistance above, the price hits another serious resistance level, which is a downward sloping resistance line going back to 2008. This surely must be the last stop for the EUR/USD and any move above it will not be due to trade, but due to a shock in the market. I believe that as there is a monumental convergence of support and resistance lines, 2018 will be a big year for the EUR/USD. At a price below 1.25, the EUR/USD will likely stabilise however, at some point during the year, the pair will make a cyclical move in either direction – likely around July.

Just like when the Fed started raising rates, should the ECB announce the end to QE, this does not mean the price will continue higher, rather, this information will have already been built into the price and it may then begin its long-awaited retracement following an initial spike.

About the Author:

Adinah Brown is a professional writer who has worked in a wide range of industry settings, including corporate industry, government and non-government organizations. Within many of these positions, Adinah has provided skilled marketing and advertising services and is currently the Content Manager at Leverate.

EURUSD: euro bears have closed the morning gap

By Gabriel Ojimadu, Alpari

Previous:

On Friday the 19th of January, despite a price surge to 1.2296, trading on the euro/dollar pair closed down. The euro dropped against the dollar to 1.2214 before trading closed in Chicago. The euro’s decline was brought about by a rise in US bond yields as well as market participants awaiting the results of an SPD vote in Bonn on whether or not to enter formal coalition talks with Angela Merkel’s party.

US 10Y bond yields have risen from 2.61% to 2.66% (high from 2014).

The greenback received also some support from the President of the San Francisco Federal Reserve, John Williams, who said that the Fed would continue on its path of gradual rate hikes in 2018 and is looking at about 3 rate hikes for the year.

US data:

Michigan consumer sentiment index – 94.4.

Day’s news (GMT+3):

  • 14:00 Germany: German Buba monthly report.
  • 16:30 Canada: wholesale sales (Nov).
  • 16:30 USA: Chicago Fed national activity index (Dec).

Fig 1. EURUSD hourly chart. Source: TradingView

Despite the fact that the price deviated from projections at the beginning of the European session, the price hit its target during the US session.

On Monday, trading on the euro opened with an upwards gap after the US government shutdown on Saturday and the agreement to hold coalition talks over the weekend in Germany. Trading on the euro opened at 1.2270. Now, sellers have closed this gap completely and the euro is trading at 1.2226.

The US government has temporarily shut down. The White House has blamed the Democrats for this due to them having blocked federal funding.

The US economy, however, doesn’t directly depend on the government. Traders have adapted to this turn of events and so there isn’t expected to be long-term fallout from this.

What will affect markets is not the fact of a government shutdown, but its duration. The last government shutdown lasted for 16 days, running from the 1st to the 17th of October, 2013.

Top representatives from both the Republican and Democratic parties held talks on Sunday. The US Senate is to vote on the extension of government funding at 06:00 GMT.

At their party conference in Bonn, the Social Democratic Party (SPD) voted for official coalition talks with Angela Merkel’s Christian Democratic Union (CDU). This is expected to result in the formation of a new coalition government with Angela Merkel at the helm.

So, what can we expect from the euro today?

After a decline in the Asian session from 1.2272 to 1.2216, a correction is on the cards, with quotes expected to rise to 1.2255. My forecast has the euro dropping from 1.2236/40. My forecast is for the next 2 days. If the DTR1 line holds its ground, we can expect the euro to open at around 1.2162 on Tuesday. For now, sellers need to break through the 1.2210 – 1.2215 range.

Fibonacci Retracements Analysis 19.01.2018 (BITCOIN, ETHEREUM)

Article By RoboForex.com

BTC USD, “Bitcoin vs US Dollar”

At the daily chart, the BTC/USD pair is still being corrected. The current descending impulse has already reached the retracement of 61.8%. The next downside target is the retracement of 76.0% at 6915.00. The resistance level is at 13140.00.

BTCUSD1

As we can see at the H4 chart, the price is forming a short-term correction towards the resistance level. After breaking the low at 9211.10, the instrument may continue falling towards the post-correctional extension area between the retracements of 138.2% and 161.8% at 8204.00 and 6642.00 respectively.

BTCUSD2


ETH USD, “Ethereum vs. US Dollar”

As we can see at the H4 chart, the ETH/USD pair is being corrected to the downside and has already reached the retracement of 50.0%. The next correctional targets are the retracements of 61.8% and 76.0% at 666.20 and 493.80 respectively. The resistance level is at 1130.70.

ETHUSD1

At the H1 chart, the situation is opposite as the pair is being corrected upwards. The targets are the retracements of 50.0% and 61.8% at 1094.80 and 1170.50 respectively.

ETHUSD2


RoboForex Analytical Department

Article By RoboForex.com

Attention!
Forecasts presented in this section only reflect the author’s private opinion and should not be considered as guidance for trading. RoboForex LP bears no responsibility for trading results based on trading recommendations described in these analytical reviews.

Forex Technical Analysis & Forecast 19.01.2018 (EUR/USD, GBP/USD, USD/CHF, USD/JPY, AUD/USD, USD/RUB, GOLD, BRENT)

Article By RoboForex.com

EUR USD, “Euro vs US Dollar”

The EUR/USD pair has finished the fourth structure. We think, today the price may fall towards 1.2121 and then grow to reach 1.2222. Later, in our opinion, the market may start another decline with the target at 1.2060.

EURUSD


GBP USD, “Great Britain Pound vs US Dollar”

The GBP/USD pair is still moving upwards. Possibly, the price may reach 1.39040 and then fall towards 1.3700. According to the main scenario, the pair is expected to start another descending wave with the target at 1.3300.

GBPUSD


USD CHF, “US Dollar vs Swiss Franc”

The USD/CHF pair is consolidating at the bottom of the range. According to the main scenario, the pair is expected to form another ascending structure with the target at 0.9664. Later, in our opinion, the market may break this level and continue growing towards 0.9774.

USDCHF


USD JPY, “US Dollar vs Japanese Yen”

The USD/JPY pair is forming the fourth structure. Possibly, today the price may fall to reach 110.57 and then start another growth with the target at 111.70. After that, the instrument may be corrected towards 111.00.

USDJPY


AUD USD, “Australian Dollar vs US Dollar”

The AUD/USD pair is consolidating. Possibly, the price may reach 0.8025 and then fall towards the downside border. Later, in our opinion, the market may break 0.7925 and then continue moving downwards with the first target at 0.7885.

AUDUSD


USD RUB, “US Dollar vs Russian Ruble”

The USD/RUB pair is trading to rebound from 56.94 downwards. We think, today the price may continue falling with the target at 55.88 and then start another correction to reach 57.62.

USDRUB


XAU USD, “Gold vs US Dollar”

Gold is trading below 1332.00. Possibly, the price may continue falling to reach 1309.00. After that, the instrument may grow towards 1332.00 and then start another decline with the first target at 1305.00.

GOLD


BRENT

Brent has reached the downside border of the Triangle pattern. Possibly, today the price may move upwards to reach 70.20, break it, and then continue growing with the target at 72.00.

BRENT


RoboForex Analytical Department

Article By RoboForex.com

Attention!
Forecasts presented in this section only reflect the author’s private opinion and should not be considered as guidance for trading. RoboForex LP bears no responsibility for trading results based on trading recommendations described in these analytical reviews.

EURUSD: euro bulls have recovered 85% of their losses

By Gabriel Ojimadu, Alpari

Previous:

On Thursday the 18th of January, trading on the EURUSD pair closed up. The pair started rising during the Asian session and gathered pace during trading in Europe. This rise was initially interpreted by traders as correcting the drop from 1.2288 to 1.2165. After taking 1.2220 (45 degrees), growth on the pair sped up to reach 1.2265.

Traders sold off the dollar in anticipation of a potential government shutdown as well as due to the publication of mixed US data. Growth in the number of housing starts in the US slowed down in December, while the Philly Fed manufacturing index came out lower than expected.

It was later revealed that Republican lawmakers voted to extend government funding to the 16th of February, so fears of a government shutdown have been put to rest for the time being.

US data:

  • Initial jobless claims (13 Jan) – 220,000 (forecast: 252,000, previous: 261,000).
  • Housing starts (Dec) – 1.192m (forecast: 1.275m, previous: 1.299m).
  • Building permits (Dec) – 1.302m (forecast: 1.290m, previous: 1.303m).
  • Philadelphia Fed manufacturing survey (Jan) – 22.2 (forecast: 24.5, previous: 27.9).

Day’s news (GMT+3):

  • 10:00 Germany: PPI (Dec).
  • 11:15 Switzerland: producer and import prices (Dec).
  • 12:00 Eurozone: current account (Nov).
  • 12:30 UK: retail sales (Dec).
  • 16:30 Canada: Canadian portfolio investment in foreign securities (Sep), foreign portfolio investment in Canadian securities (Nov), manufacturing shipments (Nov).
  • 18:00 USA: Michigan consumer sentiment index (Jan).
  • 21:00 USA: Baker Hughes US oil rig count.

Fig 1 EURUSD hourly chart. Source: TradingView

My expectations for Thursday of a rebound from the 45th and 67th degrees didn’t come to pass. The mixed US statistics as well as fears of a government shutdown helped buyers recover 85% of the drop from 1.2288 to 1.2165 if we include today’s Asian session. The fundamentals turned out stronger than the technicals.

Upon reaching 1.2265, the price technically rebounded from the DTR1 trend line, but met with some resistance during its decline at the LB balance line at 1.2220. Buyers successfully defended this level and today, in Asia, the euro has renewed yesterday’s high of 1.2270.

The euro appreciated on the back of a declining dollar, supported by the crosses. I’ve adjusted the DTR1 line a few times after some false breakouts, but now that it’s actually been broken through, I’m turning my attention towards DTR2.

I lost sight of the A-A channel yesterday. It’s formed from three values: L 1.2195, L 1.2165, and H 1.2323. We need this channel to help us see up to which level we could see quotes rise in the event of a breakout of the DTR1 line. On the current bar, it runs through 1.2275.

The prospect of a US government shutdown has been sidelined for the time being. US 10Y bond yields are rising every day. Considering that I have two open short positions on the euro from the 45th and 67thdegrees, I’m going to keep waiting for the pair to break down the lower boundary of the B-B channel. I may be wrong, but my pricing model on the hourly chart doesn’t look promising for the euro’s growth prospects. The euro is being propped up by the crosses, which is why we haven’t seen a decline on our main pair.

How to Trade Gold during Second Half of January

By TheTechnicalTraders.com

Metals are setting up for that “Rip Your Face Off Rally”.  The following charts for Gold and Silver show a very interesting setup that is unfolding as the US markets continue to strengthen – that being that the Metals are showing strength in price and we can only assume this is related to some level of FEAR in the markets or expectations that the “Equities and Bitcoin Bubbles” are nearing an end.

Gold and Silver have been one of our primary focuses for years.  We warned of the “Rip Your Face Off” rally near the Third Quarter 2017 as our cycle analysis was bottoming in December.

The recent rally in Gold has been substantial and has managed to breach recent resistance levels near $1300~1310.  At this point, we are expecting a moderate pullback in Gold over the next few weeks to levels likely near or below the $1300 level before the next leg advances well above $1380.  The presumed formation of Wave 3, if our analysis is correct, should prompt a massive move in the metals over the next 3~7 months with a number of pullbacks along the way.  Right now, it all depends on how Gold reacts to the recent highs and how deep the next retracement in price is. We could see a $1270~1300 level price pullback before the next leg higher executes.  This would be the best entry zone for both traders and long-term investors.

Silver is the “forgotten shiny metal” by many.  As we have been warning our readers, this next move in the Metals market should be a massive Wave 3 (or completed Wave 5 that will prompt a Wave B correction).  Either way, this next move could end substantially higher than where current prices have been consolidating.  Because of the expected continued rally in the US equities markets and because of the strong growth in the economic fundamentals, we believe the next contraction phase in the Metals will be a very opportunistic BUY ENTRY ZONE for traders.

Silver, which has not shown the volatility or price activity that Gold has recently shown, is one of those markets that many people forget about.  Yet, Silver has so much more opportunity for massive price gains as related to the setups that are currently playing out in the US and global markets.  As fear builds and global markets react to the Everything Bubble, Crypto volatility, Global Market Concerns and Global Political Concerns, the Metals are certainly going to be an interesting and opportunistic play for traders.

As you can see from this Silver Weekly chart, the setup in Silver is similar to the Gold chart, yet the price activity in Silver is very much more muted in volatility than Gold.  We believe that Silver, when the move happens, will show substantial price acceleration to the upside while Gold continues to rally.


2018 is setting up to be a very good year for BOTH traders and long-term investors as the opportunities for skilled and strategic trades is astounding.  Visit our website to learn more about the markets and to receive our daily updated market predictions and trade alerts.

Watch our recent video report analysis just posted live showing our predictive modeling systems and how we target our research to helping our members make money. Once you see for yourself how our analysis is accurate and timely.

We urge you to subscribe to www.TheTechnicalTraders.com to support our work and to benefit from our trade setups.  We believe 2018 – 2020 will be the years that strategic trades will outperform all other markets.  Join us in our efforts to find and execute the best trading opportunities and profit from these fantastic setups.


Chris Vermeulen

Bio: Chris Vermeulen has been involved in the markets since 1997 and is the founder of Technical Traders Ltd. He is an internationally recognized technical analyst, trader, and author of the book: Technical Trading Mastery – 7 Steps to Win With Logic, and helps educate traders with a three-hour video course that can change your trading results for the better. His mission is to help his clients boost their performance while reducing market exposure and portfolio volatility.

Ichimoku Cloud Analysis 18.01.2018 (AUD/USD, NZD/USD, USD/CAD)

Article By RoboForex.com

AUD USD, “Australian Dollar vs US Dollar”

The AUD/USD pair is trading at 0.7970; the instrument is still moving above Ichimoku Cloud, which means that it may continue growing. We should expect the price to test Tenkan-Sen and Kijun-Sen at 0.7925 and then continue moving upwards to reach 0.8080. Another signal to confirm further ascending movement is the price’s rebounding from the downside border of the rising channel. However, the scenario that Implies further growth may be cancelled if the price breaks the downside border of the cloud and fixes below 0.7865. In this case, the pair may continue falling towards 0.7760.

AUDUSD


NZD USD, “New Zealand Dollar vs US Dollar”

The NZD/USD pair is trading at 0.7291; the instrument is still moving above Ichimoku Cloud, which means that it may continue growing. We should expect the price to test the upside border of the cloud at 0.7255 and then continue moving upwards to reach 0.7410. Another signal to confirm further ascending movement is the price’s rebounding from the downside border of the rising channel. However, the scenario that implies further growth may be cancelled if the price breaks the downside border of the cloud and fixes below 0.7165. In this case, the pair may continue falling towards 0.7070.

NZDUSD


USD CAD, “US Dollar vs Canadian Dollar”

The USD/CAD pair is trading at 1.2447; the instrument is still moving below Ichimoku Cloud, which means that it may continue falling. We should expect the price to test the downside border of the cloud at 1.2455 and then continue moving downwards to reach 1.2235. However, the scenario that implies further decline may be cancelled if the price breaks the upside border of the cloud and fixes above 1.2535. In this case, the pair may continue growing towards 1.2650. After breaking the downside border of the Triangle pattern and fixing below 1.2380, the price may continue falling.

USDCAD


RoboForex Analytical Department

Article By RoboForex.com

Attention!
Forecasts presented in this section only reflect the author’s private opinion and should not be considered as guidance for trading. RoboForex LP bears no responsibility for trading results based on trading recommendations described in these analytical reviews.

Murrey Math Lines 18.01.2018 (USD/CHF, GOLD)

Article By RoboForex.com

USD CHF, “US Dollar vs Swiss Franc”

At the H4 chart, the USD/CHF pair is expected to test the resistance at the 3/8 level, rebound from it, and then resume falling towards the support at the 0/8 one.

USDCHF1

As we can see at the H1 chart, the pair has rebounded from the 5/8 level and right now is trading near the 5/8 one. Later, the price may test the 7/8 level, rebound from it, and then resume falling to reach the 4/8 one. However, another scenario suggests that the instrument may break the 7/8 level and then grow to test the resistance at the 8/8 one.

USDCHF2

At the M15 chart, the pair may break the upside line of the VoltyChannel indicator and, as a result, test the resistance at 0.9704.

USDCHF3


XAU USD, “Gold vs US Dollar”

As we can see at the H4 chart, the XAU/USD pair is trading near the 5/8 level. Later, the price is expected to rebound from this level and grow towards the 6/8 one.

GOLD1

At the H1 chart, the price is consolidating between the 3/8 and 5/8 levels. The price may break the 5/8 level and then continue growing to reach the resistance at the 8/8 one.

GOLD2

At the M15 chart, the pair may break the upside line of the VoltyChannel indicator and, as a result, continue moving upwards to reach 1343.75.

GOLD3


RoboForex Analytical Department

Article By RoboForex.com

Attention!
Forecasts presented in this section only reflect the author’s private opinion and should not be considered as guidance for trading. RoboForex LP bears no responsibility for trading results based on trading recommendations described in these analytical reviews.