Author Archive for InvestMacro – Page 444

EURUSD: continued bearish sentiment on the hourly timeframe

By Gabriel Ojimadu, Alpari

Previous:

On Friday the 2nd of February, trading on the euro/dollar pair closed down. The publication of employment data in the US brought about a sharp decline on the euro. The number of new jobs added exceeded expectations, while the previous figure was revised upwards.

200,000 new jobs were created outside the agricultural sector in January (forecast: 178,000). The reading for November was revised from 252,000 to 216,000, while the reading for December was revised from 148,000 to 160,000. Unemployment in the US in January fell in line with the consensus of 4.1%. The average hourly earnings index posted a 0.3% rise (forecast: 0.3%, previous reading revised from 0.3% to 0.4%). The workforce participation rate came out at 62.7%.

Later on, the factory orders index and Michigan consumer sentiment index exceeded expectations. Factory orders grew by 1.7%, while the Michigan University consumer sentiment index came out at 95.7.

On this news, US 10Y bond yields jumped to 2.8584%, its highest value in 4 years. The euro slumped to 1.2049 before mounting a recovery to reach 1.2491.

Day’s news (GMT+3):

  • 11:50 France: Markit services PMI (Jan).
  • 11:55 Germany: Markit services PMI (Jan).
  • 12:00 Eurozone: Markit services PMI (Jan).
  • 12:30 UK: Markit services PMI (Jan).
  • 13:00 Eurozone: retail sales (Dec).
  • 17:45 USA: Markit services PMI (Jan).
  • 18:00 USA: ISM non-manufacturing PMI (Jan).

Fig 1. EURUSD hourly chart. Source: TradingView

On Monday the 5th of February, trading on the euro opened down owing to a rise in US 10Y bond yields to 2.8717%. At the time of writing this review, the euro is trading at 1.2460. My intraday forecast for the week shows the euro dropping against the dollar to 1.2322 by the time trading opens in London on Wednesday the 7th of February.

The pair is still trading within the B-B channel. My forecast expects to see a rise to the 45th degree at 1.2480, followed by a drop to 1.2407. Because of the fact that the AO indicator is in negative territory, I’ve been debating whether my prediction should go as far as 1.2438 or 1.2707. I’m going to go out on a limb and say that the euro will exit the B-B channel during the US session.

Urgent Message Two Must See NASDAQ Charts

By Elliott Wave International

[FREE RESOURCE] Investors Go for Broke: 3 Charts, Same Message…

This short video shows you everything you need to know about the position of the stock market today. It’s a must-see message for anyone investing in stocks today.

Get free, instant access to this resource now..

This article was syndicated by Elliott Wave International and was originally published under the headline Urgent Message Two Must See NASDAQ Charts. EWI is the world’s largest market forecasting firm. Its staff of full-time analysts led by Chartered Market Technician Robert Prechter provides 24-hour-a-day market analysis to institutional and private investors around the world.

Gold and Gold Miners preparing for Big Move

By Chris Vermeulen

Just a few days ago we alerted our members and followers to a massive setup in the Palladium market that had not been seen in years.  This chart formation provides an incredible opportunity for a trader to take advantage of and profit from the expected price decline.  We alerted our members and followers on January 24th of this move.

As of today, Palladium has rotated downward by over 9% from the recent highs and should continue to move lower as this multi-month rotation extends. Even though this initial move lower (-9%) reaches our initial predicted target levels, we still believe support won’t be found till prices reach near the $1000 price level.  If that support fails to hold, the price of Palladium could fall to the $900. This total move could be over -20% by the time this downward swing ends.

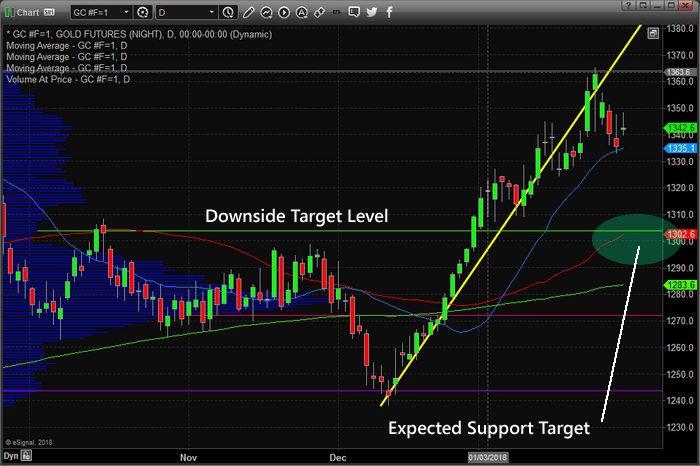
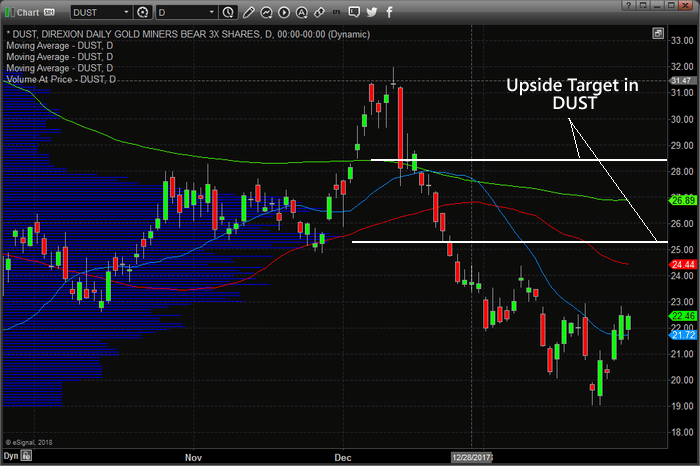
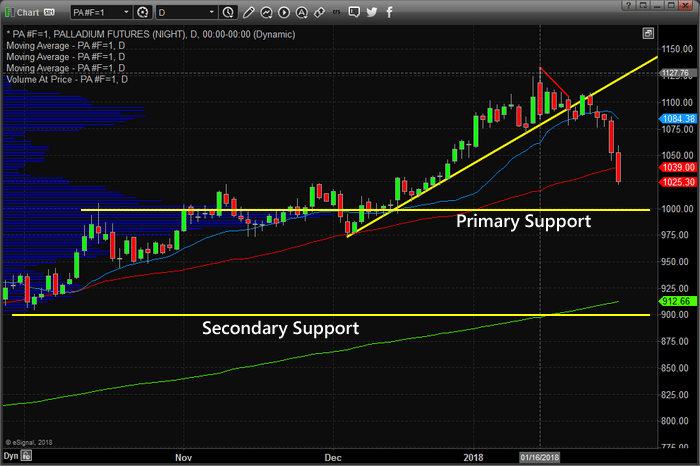
As an additional bonus, the other metals and Miner ETFs are starting a move in correlation with this massive rotation in Palladium.  The aggressive move in Palladium may become a catalyst for the other metals and miners to sell off further.

We warned weeks ago about this cycle top in gold and how it should rotate lower and move to near $1300 before finding support.  This move has just started really and would equate to a -3.8~4.2% downward price correction.

The ability to see these moves and act on them provides our members with the ability to take a single trading signal and deploy multiple successful trades from it.  We got our member’s long DUST near the very bottom of the market in anticipation of this move in the metals markets.  Knowing that this move was set up and that it could be somewhat aggressive, we simply waited for the proper setup and trigger to alert our members.

The overall potential from our DUST trade remains substantial.  Currently, we have already locked in +11% for our members and we believe the final move could be much larger.

The reason we are alerting you, today, of the progress of our calls, is that the market conditions are changing, and these types of trade setups are going to happen every month and a lot of money can be made by taking advantage of them each month. Join our Wealth Building Newsletter at www.TheTechnicalTraders.com and let us boost your trading returns with our daily analysis video, market updates, and trade alerts.

We just closed out another winning trade and members locked in a quick 9.1% profit with falling price of natural gas.

Our articles, Technical Trading Mastery book, and 3 Hour Trading Video Course are designed for both traders and investors to explore the tools and techniques that discretionary and algorithmic traders need to profit in today’s competitive markets. Created with the serious trader and investor in mind – whether beginner or professional – our approach will put you on the path to win. Understanding market structure, trend identification, cycle analysis, volatility, volume, when and when to trade, position management, and how to put it all together so that you have a winning edge.

JOIN US TODAY AND BECOME A WINNING TECHNICAL TRADER – CLICK HERE

Chris Vermeulen
Founder Technical Traders Ltd.

Can The Shale Boom Avoid These Bottlenecks?

By OilPrice.com

Shale companies continue to drill at a frenzied pace, adding rigs and breaking U.S. oil production levels with each passing week. Yet, the oil production is becoming increasingly geographically concentrated. Not only is the Permian basin accounting for much of the new oil production in the U.S., but a relatively small number of counties within the Permian are home to most of that action.

The drilling craze in the Permian has been going on for some time, but activity continues to pick up pace. The rig count in the Permian has surged over the past year, and jumped by 18 in the most recent week for which data is available, to 427, the highest total for the basin since early 2015.

But the Permian encompasses a wide swath of territory, and the rig increases are really concentrated in surprisingly small geographical area.

The rig count in the sub-basins of the Delaware and Midland has jumped by 54 since last summer, rising to 388. There are 25 counties located within these two sub-basins, but really, 95 percent of drilling activity is located in just 12 of them, according to a research note by Standard Chartered. Digging deeper, roughly half of that activity is located in just four counties — Midland, Reeves, Lea and Eddy.

Against that backdrop, the shale bonanza “has an increasingly narrow base,” Standard Chartered analysts wrote, growing rapidly in this core area at a time of “sluggish activity elsewhere.” For U.S. oil production, that may not necessarily be a problem, as long as the region can handle the blistering pace of drilling.

Fourth-quarter earnings will be released in the next few days and weeks, and if the shale industry continues to report strong production gains from this small geographical footprint, “then the Midland and Delaware basins seem set to lead strong U.S. growth in 2018,” the investment bank said.

However, because so much drilling is concentrated in such a relatively small area, the risk is that bottlenecks will start to crop up. The strain on gathering lines, pipelines, processing facilities, plus a shortage of fracking crews, labor and/or equipment will become a point of focus as production continues to mushroom. If a number of shale companies raise concerns about infrastructure or other equipment and services bottlenecks in these areas, Standard Chartered says the heady growth forecasts for U.S. shale “may disappoint.”

Anecdotally, at least, there have been stories of bottlenecks for more than a year. So far, there has been no obvious impact on overall output. Production from the Permian is exploding, and plenty of market forecasts predict the U.S. will add upwards of 1 million barrels per day over the next year; some say more.

Still, there is some evidence that the cost of oilfield services is on the rise. A wider metric that captures total costs for the shale industry also points to cost inflation. This would be consistent with a tighter market for services and equipment. But again, thus far, the production figures continue to climb unimpeded.

One factor to keep in mind going forward is that the U.S. EIA is planning on tweaking the way it reports its production figures. Because the weekly production data — a closely watched figure that has a great deal of influence on short-term fluctuations in oil prices — is only an estimate based on the best available data to the agency, it can’t paint a precise picture of what is going on at the ground level with 100 percent accuracy. The EIA has tried to make this clear, but it comes under fire when the data is revised in subsequent weeks and months as better data becomes available.

In response, moving forward the EIA will report production figures rounded up to the nearest 100,000 bpd. As such, the most recent data, for instance, shows that the U.S. produced 9.919 mb/d for the week ending on January 26. Under the revised system, that figure would appear as simply 9.9 mb/d. That, the agency argues, will make it clear that the figure is an estimate and not intended to be a precise measurement. This may prevent media types (*ahem*) from reading too much into a figure that inherently involves a bit of guesswork.

The flip side is that the data will get more clunky. Standard Chartered argues that because the data will likely stay the same for the next several weeks (at 9.9 mb/d) and then suddenly jump to 10.0 mb/d, it may have a jarring impact on market psychology. “The proposal seems a retrograde step to us, designed more to create a defensive shield of opaqueness around what has unfortunately become a political number, rather than to improve transparency in the market place,” Standard Chartered analysts wrote.

Regardless of one’s view, the best bet is to keep an eye on the monthly figures, which are more accurate, although published on a lag. For that, the EIA reported on Wednesday that the U.S. produced a staggering 10.038 mb/d in November, a massive jump of 384,000 bpd from a month earlier.

Based on that figure, at least as of November, the shale industry was not being held back by any bottlenecks.

Link to original article: https://oilprice.com/Energy/Energy-General/Can-The-Shale-Boom-Avoid-These-Bottlenecks.html

By Nick Cunningham of Oilprice.com

Fibonacci Retracements Analysis 02.02.2018 (BITCOIN, ETHEREUM)

Article By RoboForex.com

BTC USD, “Bitcoin vs US Dollar”

In the H4 chart, the downtrend continues. BTC/USD is trading towards the retracement of 76.0% at 6975.00. In the long-term, the downtrend may continue and reach 2980.00.

BTCUSD1
Risk Warning: the results of previous trading operations do not guarantee the same results in the future.

In the H1 chart, the situation is pretty similar as the pair continue trading downwards steadily. Taking into account the convergence that is being formed, BTC/USD may reach its downside targets and then start a new ascending correction towards the area between the retracements of 23.6% and 50.0% at 8184.45 and 9544.00 respectively.

BTCUSD2Risk Warning: the results of previous trading operations do not guarantee the same results in the future.

ETH USD, “Ethereum vs. US Dollar”

As we can see in the H4 chart, ETH/USD is forming a new descending impulse with the target at 769.00. After breaking it, the price may continue the correction towards the retracement of 76.0% at 714.00 and then towards the post-correctional extension area between the retracements of 138.2% and 161.8% at 580.00 and 465.60 respectively.

ETCUSD1
Risk Warning: the results of previous trading operations do not guarantee the same results in the future.

In the H1 chart, the pair is quite quickly trading towards the target level at 769.00.

ETCUSD2Risk Warning: the results of previous trading operations do not guarantee the same results in the future.


RoboForex Analytical Department

Article By RoboForex.com

Attention!
Forecasts presented in this section only reflect the author’s private opinion and should not be considered as guidance for trading. RoboForex LP bears no responsibility for trading results based on trading recommendations described in these analytical reviews.

Urgent Message Two Must See NASDAQ Charts

By Elliott Wave International

[FREE RESOURCE] Investors Go for Broke: 3 Charts, Same Message…

This short video shows you everything you need to know about the position of the stock market today. It’s a must-see message for anyone investing in stocks today.

Get free, instant access to this resource now..

This article was syndicated by Elliott Wave International and was originally published under the headline Urgent Message Two Must See NASDAQ Charts. EWI is the world’s largest market forecasting firm. Its staff of full-time analysts led by Chartered Market Technician Robert Prechter provides 24-hour-a-day market analysis to institutional and private investors around the world.

Forex Technical Analysis & Forecast 02.02.2018 (EUR/USD, GBP/USD, USD/CHF, USD/JPY, AUD/USD, USD/RUB, GOLD, BRENT)

Article By RoboForex.com

EUR USD, “Euro vs US Dollar”

EUR/USD has broken 1.2442 and formed an upside continuation pattern; it has reached the target of another ascending structure at 1.2500 and right now is consolidating. Today, the price may fall to reach 1.2481 and then grow towards 1.2500, thus forming another consolidation range. If later the instrument breaks this range to the downside, the market may fall to reach 1.2442; if to the upside – continue moving upwards with the target at 1.2550.

EURUSDRisk Warning: the results of previous trading operations do not guarantee the same results in the future.

GBP/USD GBP USD, “Great Britain Pound vs US Dollar”

GBP/USD has broken 1.4217 and formed a continuation pattern. Possibly, the price may form another ascending structure with the target at 1.4300 and then fall towards 1.4217, thus forming another consolidation range.  If later the instrument breaks this range to the downside, the market may fall to reach 1.3925; if to the upside – start another growth towards 1.4400.

GBPUSDRisk Warning: the results of previous trading operations do not guarantee the same results in the future.

USD CHF, “US Dollar vs Swiss Franc”

USD/CHF has expanded its consolidation range upwards and reached the target at 0.9257; right now, it is consolidating. Taking into account that the ascending impulse is weak, the price may yet update the lows and reach 0.9247 and then grow towards 0.9300, thus forming a new consolidation range. If later the instrument breaks this range to the upside, the market may continue moving upwards to reach 0.9460.

USDCHFRisk Warning: the results of previous trading operations do not guarantee the same results in the future.

USD JPY, “US Dollar vs Japanese Yen”

USD/JPY has broken its consolidation range, formed an upside continuation pattern, and may start the structure towards 110.13. Later, the market may be corrected to reach 109.35 and then resume trading to the upside towards 110.45. This entire five-wave structure is considered as a correction. After that, the instrument may start a new decline to reach 108.14.

USDJPYRisk Warning: the results of previous trading operations do not guarantee the same results in the future.

AUD USD, “Australian Dollar vs US Dollar”

AUD/USD has formed a downside continuation pattern. The short-term target is at 0.7966.  After that, the instrument may grow towards 0.8040 and then continue trading to the downside to reach 0.7899.

AUDUSDRisk Warning: the results of previous trading operations do not guarantee the same results in the future.

USD RUB, “US Dollar vs Russian Ruble”

USD/RUB is still consolidating near the lows. If later the price breaks this range to the downside, the market may fall to reach 55.26; if to the upside – start another growth towards 57.20.

USDRUBRisk Warning: the results of previous trading operations do not guarantee the same results in the future.

XAU USD, “Gold vs US Dollar”

Gold has broken its consolidation range upwards and may grow to reach 1353.00. Later, the market may start another decline towards 1330.00.

GOLDRisk Warning: the results of previous trading operations do not guarantee the same results in the future.

BRENT

Brent has broken 69.10 and formed a continuation pattern. Possibly, today the price may grow towards 70.15, break it, and then continue moving upwards with the target at 71.15. After that, the instrument may start a new decline to reach 69.15.

BRENTRisk Warning: the results of previous trading operations do not guarantee the same results in the future.


RoboForex Analytical Department

Article By RoboForex.com

Attention!
Forecasts presented in this section only reflect the author’s private opinion and should not be considered as guidance for trading. RoboForex LP bears no responsibility for trading results based on trading recommendations described in these analytical reviews.

How to Profit from Natural Gas price spike

By Chris Vermeulen

A week ago we saw natural gas hit resistance and our cycle analysis also indicated the timing was about right for the price to start to fall.

Here is what we saw and sent to our subscribers: 

Fast forward a few days… the chart below shows you our updated technical analysis and prediction – Nat Gas Bottoming.

Today we issued a CLOSE POSITION alert to subscribers for a clean and simple trade.


Our articles, Technical Trading Mastery book, and 3 Hour Trading Video Course are designed for both traders and investors to explore the tools and techniques that discretionary and algorithmic traders need to profit in today’s competitive markets. Created with the serious trader and investor in mind – whether beginner or professional – our approach will put you on the path to win. Understanding market structure, trend identification, cycle analysis, volatility, volume, when and when to trade, position management, and how to put it all together so that you have a winning edge.

BECOME A TECHNICAL TRADER TODAY
AND PROFIT! – CLICK HERE

Chris Vermeulen

Forex Technical Analysis & Forecast 01.02.2018 (EUR/USD, GBP/USD, USD/CHF, USD/JPY, AUD/USD, USD/RUB, GOLD, BRENT)

Article By RoboForex.com

EUR USD, “Euro vs US Dollar”

The EUR/USD pair has rebounded from 1.2474 and started forming another descending impulse. We think, today the price may reach 1.2385, break it, and then continue trading to the downside with the short-term target at 1.2340. In fact, the market is expected to form a continuation pattern. The target of the wave is at 1.2297.

EURUSD
Risk Warning: the results of previous trading operations do not guarantee the same results in the future.

GBP/USD GBP USD, “Great Britain Pound vs US Dollar”

The GBP/USD pair is consolidating. Possibly, the price may break this range to the downside and then start forming the fifth structure to reach the first target at 1.3950.

GBPUSD
Risk Warning: the results of previous trading operations do not guarantee the same results in the future.

USD CHF, “US Dollar vs Swiss Franc”

The USD/CHF pair is still consolidating near the lows. Possibly, the price may form another descending structure to reach 0.9270. After that, the instrument may grow towards the first target at 0.9465.

USDCHF
Risk Warning: the results of previous trading operations do not guarantee the same results in the future.

USD JPY, “US Dollar vs Japanese Yen”

The USD/JPY pair continues consolidating close to the lows. Possibly, today the price may form a new ascending structure towards 109.61. Later, in our opinion, the market may resume moving downwards to reach 108.14 and then start a new growth with the first target at 110.50.

USDJPY
Risk Warning: the results of previous trading operations do not guarantee the same results in the future.

AUD USD, “Australian Dollar vs US Dollar”

The AUD/USD pair has formed another consolidation range and right now is breaking it downwards. The short-term target is at 0.7966.  After that, the instrument may grow towards 0.8004 and then continue trading to the downside to reach the first target at 0.7899.

AUDUSD
Risk Warning: the results of previous trading operations do not guarantee the same results in the future.

USD RUB, “US Dollar vs Russian Ruble”

The USD/RUB pair is still moving upwards; the predicted target is at 56.56. After that, the instrument may fall to reach 56.05 and then resume growing with the target at 56.90.

USDRUB
Risk Warning: the results of previous trading operations do not guarantee the same results in the future.

XAU USD, “Gold vs US Dollar”

Gold is consolidating near the lows of the first wave. If later the price breaks this range to the downside, the market may fall to reach 1315.00; if to the upside – start another correction towards 1353.00.

GOLD
Risk Warning: the results of previous trading operations do not guarantee the same results in the future.

BRENT

Brent has returned to 69.08. We think, today the price may continue forming the third structure. The target is at 67.44. Later, in our opinion, the market may grow to return to 69.08 and then start another decline to reach 66.94.

BRENT
Risk Warning: the results of previous trading operations do not guarantee the same results in the future.

RoboForex Analytical Department

Article By RoboForex.com

Attention!
Forecasts presented in this section only reflect the author’s private opinion and should not be considered as guidance for trading. RoboForex LP bears no responsibility for trading results based on trading recommendations described in these analytical reviews.

Japanese Candlesticks Analysis 01.02.2018 (GOLD, NZD/USD)

Article By RoboForex.com

XAU USD, “Gold vs US Dollar”

As we can see at the H4 chart, the XAU/USD pair has finished several Hammer and Inverted Hammer reversal patterns while forming the correction. These patterns may signal that the pullback is over and the instrument may resume growing.

GOLDRisk Warning: the results of previous trading operations do not guarantee the same results in the future.

NZD USD, “New Zealand vs. US Dollar”

As we can see at the H4 chart, the current correction has been lasting for several days. By now, the NZD/USD pair has formed several more Hammer, Doji, and Inverted Hammer patterns at the support level. Judging by the current uptrend, we may assume that the uptrend may continue after the instrument finishes the pullback.

NZDUSDRisk Warning: the results of previous trading operations do not guarantee the same results in the future.


RoboForex Analytical Department

Article By RoboForex.com

Attention!
Forecasts presented in this section only reflect the author’s private opinion and should not be considered as guidance for trading. RoboForex LP bears no responsibility for trading results based on trading recommendations described in these analytical reviews.