EURUSD is still consolidating below 1.2355. If later the instrument breaks this range to the downside, the market may continue trading to the downside towards 1.2200; if to the upside – start another correction to reach 1.2405.
Risk Warning: the results of previous trading operations do not guarantee the same results in the future.
GBPUSD, “Great Britain Pound vs US Dollar”
GBPUSD has almost completed the correction and returned to 1.4020. Possibly, today the price may fall to reach 1.3800. This decline may be considered as a half of the third wave inside the downtrend.
Risk Warning: the results of previous trading operations do not guarantee the same results in the future.
USDCHF, “US Dollar vs Swiss Franc”
USDCHF is being corrected. Today, the price may fall towards 0.9300 and then grow to reach 0.9470. After that, the instrument may continue the correction with the target at 0.9385.
Risk Warning: the results of previous trading operations do not guarantee the same results in the future.
USDJPY, “US Dollar vs Japanese Yen”
USDJPY is falling towards 106.35. Later, the market may grow to reach 108.00, break it, and trade with the short-term target at 109.50.
Risk Warning: the results of previous trading operations do not guarantee the same results in the future.
AUDUSD, “Australian Dollar vs US Dollar”
AUDUSD has reached the closest target of the correction. Today, the price may fall to reach 0.7777. An alternative scenario implies that the market may form one more correctional structure with the target at 0.7910 and then continue trading to the downside.
Risk Warning: the results of previous trading operations do not guarantee the same results in the future.
USDRUB, “US Dollar vs Russian Ruble”
USDRUB is still consolidating around 56.56. Possibly, today the price may break 56.20; the target is at 55.50. After that, the instrument may return to 56.20 to test it from below and then continue trading to the downside with the target at 54.80.
Risk Warning: the results of previous trading operations do not guarantee the same results in the future.
XAUUSD, “Gold vs US Dollar”
Gold is moving upwards. Possibly, the price may be corrected towards 1343.00. An alternative scenario implies that the market may continue growing and form a five-wave structure to reach 1347.00. Later, the market may start another decline with the target at 1307.00.
Risk Warning: the results of previous trading operations do not guarantee the same results in the future.
BRENT
Brent is moving upwards; it has almost completed the structure to return to 67.66. After reaching this level, the price may fall towards 64.80 and then start another growth towards the short-term target at 70.30.
Risk Warning: the results of previous trading operations do not guarantee the same results in the future.
Attention! Forecasts presented in this section only reflect the author’s private opinion and should not be considered as guidance for trading. RoboForex LP bears no responsibility for trading results based on trading recommendations described in these analytical reviews.
On Friday the 23rd of February, trading on the euro closed slightly down. After a turbulent few days that saw price fluctuations of nearly 100 pips, markets finally pulled themselves together after the publication of the FOMC minutes. They struck an optimistic tone with regards to the state of the US economy and further interest rate hikes.
Day’s news (GMT+3):
10:00 UK: Nationwide housing price index (Feb).
12:30 UK: BBA mortgage approvals (Jan).
16:30 USA: Chicago Fed national activity index (Jan).
18:00 USA: new home sales (Jan).
Fig 1 EURUSD hourly chart. Source: TradingView
Today, I’ll be focusing mostly on technical analysis. In Asia, the euro has recovered from 1.2280 to 1.2319. Judging by newsfeeds, the dollar is being dragged down by the BoJ’s governor Haruhiko Kuroda speech. He didn’t say anything new, but reiterated the need to try and keep inflation at 2% and that the central bank would maintain an ultra-accommodative policy to do so.
I wanted to predict a drop for the euro as my primary forecast, but instead I’ve gone for a rise. The negative sentiment on the dollar in Asia, the euro’s rise on the hourly cycles, the drop in US10 bond yields, and the fact that the euro is hovering around the trend line all had an effect on my decision.
At this stage, I can’t see the euro rising any further than 1.2360 for several reasons. First of all, traders and investors are anticipating new Fed Chair Jerome Powell’s first address to Congress this week. It’s unclear what the reaction will be and what he’ll say on monetary policy. The first speech is always very important for markets.
Secondly, the upcoming parliamentary elections in Italy (4th of March) will have a negative effect on the euro. On the same day, the Social democratic party in Germany is set to have an internal vote on creating a coalition government with Angela Merkel.
The euro could start declining again at any moment. For Monday, the euro’s target is 1.2348.
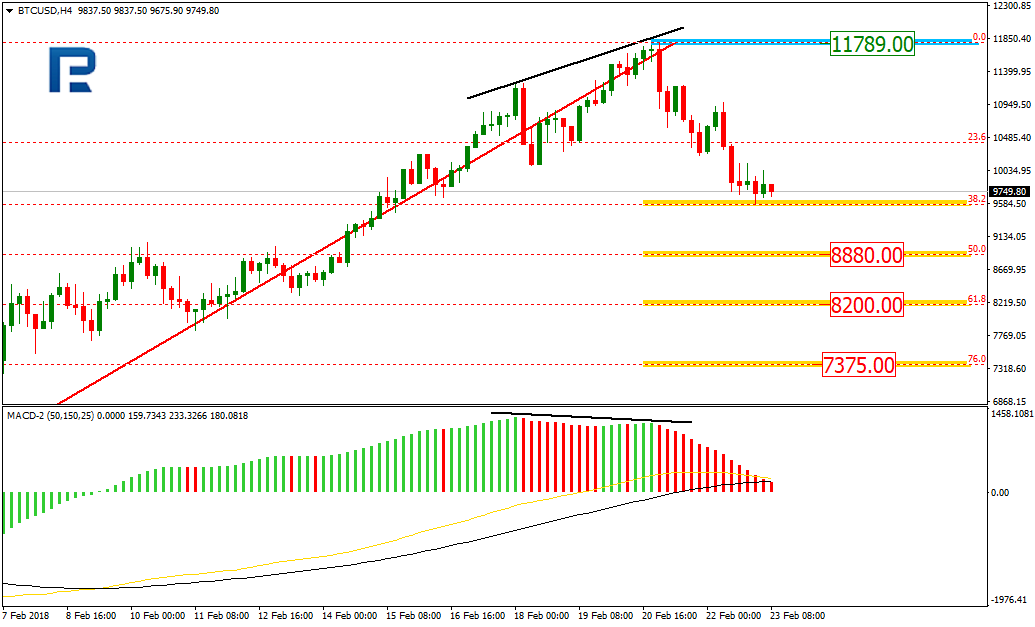
As we can see in the H4 chart, the divergence made BTCUSD reverse and start a new descending impulse, which has already reached the retracement of 38.2%. The next downside targets are the retracements of 50.0%, 61.8%, and 76.0% at 8880.00, 8820.00, and 7375.00 respectively.
Risk Warning: the results of previous trading operations do not guarantee the same results in the future.
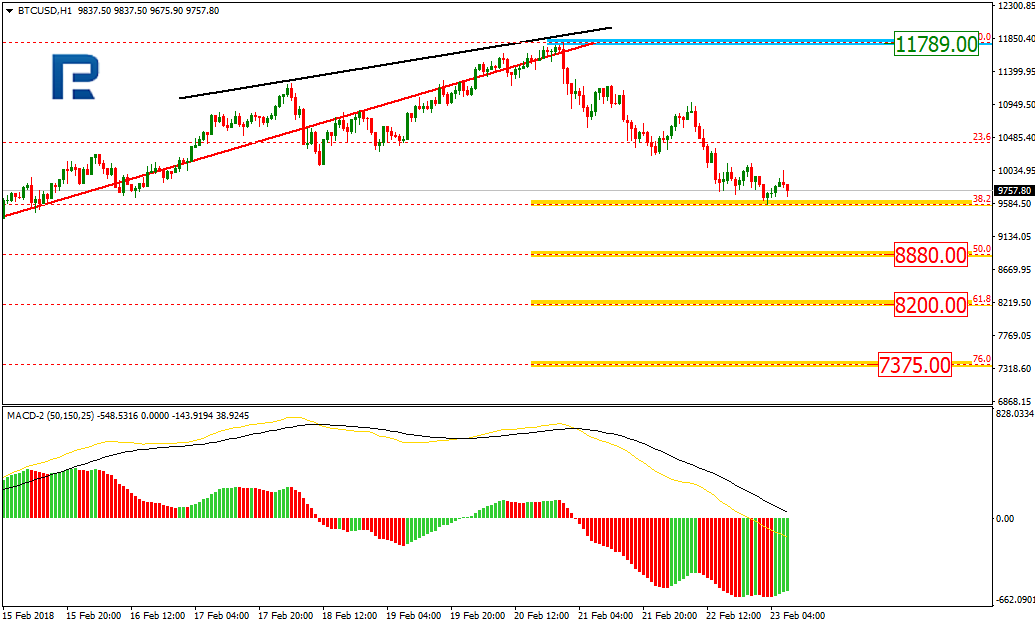
In the H1 chart, the pair is trading downwards. However, the price may start a short-term correction and return to the retracement of 23.6%.
Risk Warning: the results of previous trading operations do not guarantee the same results in the future.
ETHUSD, “Ethereum vs. US Dollar”
In the H4 chart, after finishing the ascending correction, ETHUSD started moving downwards and has almost reached the retracement of 50.0%. The next downside targets may be the retracements of 61.8% (725.80), 76.0% (669.10), and the low at 570.40.
Risk Warning: the results of previous trading operations do not guarantee the same results in the future.
In the H1 chart, the convergence made the pair reverse and start a new ascending impulse towards the retracements of 38.2% and 50.0% at 850.40 and 871.60 respectively. If the price breaks the local low at 785.18, the instrument may continue its mid-term downtrend.
Risk Warning: the results of previous trading operations do not guarantee the same results in the future.
Attention! Forecasts presented in this section only reflect the author’s private opinion and should not be considered as guidance for trading. RoboForex LP bears no responsibility for trading results based on trading recommendations described in these analytical reviews.
EURUSD is being corrected. Possibly, the price may form another ascending structure towards 1.2355 and then the descending one to reach 1.2200. After that, the instrument may start another correction to return to 1.2355.
Risk Warning: the results of previous trading operations do not guarantee the same results in the future.
GBPUSD, “Great Britain Pound vs US Dollar”
GBPUSD is back to consolidating. Possibly, today the price may grow to reach 1.4020 and then fall towards 1.3760. Later, the market may start another correction with the target at 1.4000.
Risk Warning: the results of previous trading operations do not guarantee the same results in the future.
USDCHF, “US Dollar vs Swiss Franc”
USDCHF is being corrected. Possibly, the price may fall towards 0.9298 and then grow to reach 0.9470. After that, the instrument may start another correction with the target at 0.9300.
Risk Warning: the results of previous trading operations do not guarantee the same results in the future.
USDJPY, “US Dollar vs Japanese Yen”
USDJPY is falling towards 106.73. Today, the price may grow to reach 108.00, break it, and trade with the first target at 108.70.
Risk Warning: the results of previous trading operations do not guarantee the same results in the future.
AUDUSD, “Australian Dollar vs US Dollar”
AUDUSD is being corrected towards 0.7868. Later, the market may fall to reach 0.7755 and then start another growth with the target at 0.7870.
Risk Warning: the results of previous trading operations do not guarantee the same results in the future.
USDRUB, “US Dollar vs Russian Ruble”
USDRUB is still consolidating around 56.56. Possibly, today the price may form another ascending structure towards 57.00. After that, the instrument may fall to break 56.20 and then continue trading to the downside to reach the next target at 55.50.
Risk Warning: the results of previous trading operations do not guarantee the same results in the future.
XAUUSD, “Gold vs US Dollar”
Gold is back to consolidating in the center of the range. Possibly, the price may trade to the upside to reach 1335.00 and then start another decline towards 1307.00.
Risk Warning: the results of previous trading operations do not guarantee the same results in the future.
BRENT
Brent has broken its consolidation range upwards and may grow to reach 66.70. Today, the price may fall to return to 65.55 and then start another growth to reach 66.70. Later, the market may be corrected towards 63.55.
Risk Warning: the results of previous trading operations do not guarantee the same results in the future.
Attention! Forecasts presented in this section only reflect the author’s private opinion and should not be considered as guidance for trading. RoboForex LP bears no responsibility for trading results based on trading recommendations described in these analytical reviews.
As we can see in the H4 chart, USDCAD is getting closer to the resistance level again; it has formed Harami, Engulfing, and Doji reversal patterns. Judging by previous movements, it may be assumed that the instrument may rebound from the level once again.
Risk Warning: the results of previous trading operations do not guarantee the same results in the future.
AUDUSD, “Australian Dollar vs US Dollar”
As we can see in the H4 chart, AUDUSD has stopped under the resistance level and formed several Engulfing and Doji reversal patterns. These patterns probably indicate that the instrument may rebound from the level.
Risk Warning: the results of previous trading operations do not guarantee the same results in the future.
Attention! Forecasts presented in this section only reflect the author’s private opinion and should not be considered as guidance for trading. RoboForex LP bears no responsibility for trading results based on trading recommendations described in these analytical reviews.
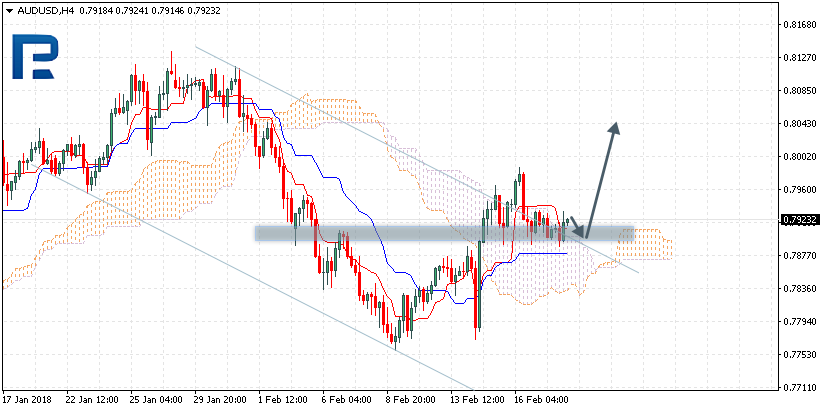
AUDUSD is trading at 0.7923; the instrument is moving above Ichimoku Cloud, which means that it may continue growing. The markets could indicate that the price may test the upside border of the cloud at 0.7920 and then continue moving upwards to reach 0.8040. Another signal to confirm further ascending movement is the price’s rebounding from the upside border of the descending channel. However, the scenario that Implies further growth may be cancelled if the price breaks the downside border of the cloud and fixes below 0.7840. In this case, the pair may continue falling towards 0.7760.
Risk Warning: the results of previous trading operations do not guarantee the same results in the future.
NZDUSD, “New Zealand Dollar vs US Dollar”
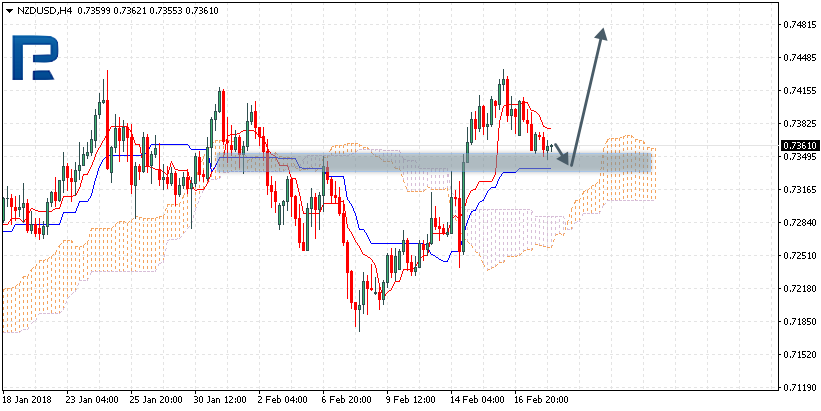
NZDUSD is trading at 0.7361; the instrument is moving above Ichimoku Cloud, which means that it may continue growing. The markets could indicate that the price may test Tenkan-Sen and Kijun-Sen at 0.7335 and then continue moving upwards to reach 0.7480. Another signal to confirm further ascending movement is the price’s rebounding from the support level. However, the scenario that implies further growth may be cancelled if the price breaks the downside border of the cloud and fixes below 0.7280. In this case, the pair may continue falling towards 0.7185.
Risk Warning: the results of previous trading operations do not guarantee the same results in the future.
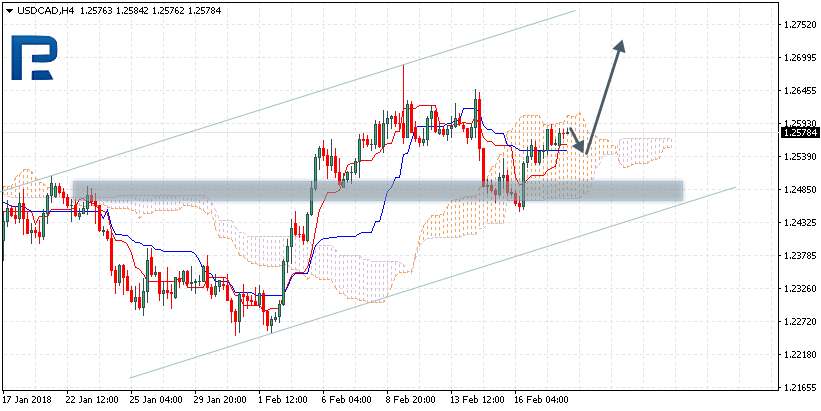
USDCAD, “US Dollar vs Canadian Dollar”
USDCAD is trading at 1.2578; the instrument is moving inside Ichimoku Cloud, which means that it is moving sideways. The markets could indicate that the price may test Tenkan-Sen and Kijun-Sen at 1.2540 and then continue moving upwards to reach 1.2705. However, the scenario that implies further growth may be cancelled if the price breaks the downside border of the cloud and fixes below 1.2460. In this case, the pair may continue falling towards 1.2270. After breaking the upside border of the cloud and fixing above 1.2630, the price may resume growing.
Risk Warning: the results of previous trading operations do not guarantee the same results in the future.
Attention! Forecasts presented in this section only reflect the author’s private opinion and should not be considered as guidance for trading. RoboForex LP bears no responsibility for trading results based on trading recommendations described in these analytical reviews.
As today’s European session approaches, the EURUSD pair is trading at 1.2388 (-0.14%), so the euro has been slowly declining against the dollar since the end of last week. The US dollar index (DXY) has been given a boost thanks to the dollar’s rise on multiple pairs and is now trading at 89.23 (+0.17%).
There’s not much expected on the news front today. At 13:00 (GMT+3), the ZEW will publish its economic sentiment surveys for Germany and the Eurozone in February. At 14:00 (GMT+3), the CBI will release its industrial trends survey on orders for the UK in February. I don’t think that the European statistics will have much of an effect on the euro at the time, but the CBI survey could significantly increase volatility on the pound.
EURUSD
On the hourly timeframe (H1), the EURUSD pair is trading around the low (1.2350 – 1.2390) in the double top (1.2480 – 1.2520):
As such, we now have a confirmed triple top on H1:
This all means that that there is a solid resistance around the triple top level, which is preventing the euro from rising.
So, today, I reckon that we could see the first attempt at a downwards breakout below the low level of the double top, followed by subsequent movements within a corridor of 1.2190 – 1.2290, where the pair went through a phase of consolidation in January.
For the last few years, as bitcoin has been ebbing and flowing, there have been two camps. On one side are the naysayers, the bitcoin bears let’s call them, who have been jumping up and down on the spot saying that they don’t believe in the profit potential of bitcoin. That it is just a bunch of data like the kind you store on your computer. That it has no fundamentals. That it can be duplicated by another cryptocurrency.
Ant then there is the bitcoin camp, the bitcoin bulls. They talk about the blockchain like it is a spiritual entity. The world will be saved by bitcoin. It’s going to take over finance and get rid of the banks. The corrupt fools running the federal reserves will be forced to bend its will. Each bitcoin will be worth thousands, maybe millions.
After the recent highs, you would expect the bears to be quiet, but this only fuelled talk of a drop. With all the excitement of the huge profit gripping Bitcoin and other cryptocurrencies, the rags to riches stories have abounded. And in some cases, the riches lost or squandered. For every story of instant wealth, there are just as many of those that remind you of James Monaghan, who traded his half of Dominos pizza for a used VW Beetle. The stories of the 10,000 BTC Pizza. The story of the guy whose girlfriend made him give away all his mined bitcoin in 2013… the list goes on.
With Bitcoin being anonymous, there could be someone out there who has millions of bitcoin that has not come forward. It could be your nerdy computer freak neighbour. Or your weird, tech-bsessed cousin.
However the richest bitcoin owners are not hard to find.
Fans of the Aaron Sorkin penned “The Social Network” will know them as “The Winkelvii”. Tyler and Cameron Winkelvoss, who famously sued Mark Zukerberg for stealing Facebook, invested $11 million dollars in Bitcoin in 2013. At the height of the value that puts their stake at over $1 billion. They are also reputed to own more than 1% of all bitcoins. Other estimates put the value lower, but no one doubts that the amount of Bitcoin they own puts them near the top of the list.
Another of the richest has come to be known as Bitcoin Jesus, Roger Ver, whose stake in Bitcoin was estimated at $52 million in 2016. He was one of the early investors in Bit Instant, BitPay and Ripple. His public support of bitcoin and his run for California State Assembly, made him one of the highest profile Bitcoin millionaires, and also one of the wealthiest.
Jered Kenna is a former marine that bought his first Bitcoin at just $0.28 per Bitcoin, later selling them for $258. In time he traded more and more batches of Bitcoin. The net worth from this Bitcoin trading is said to be about $30 Million.
With all the known Bitcoin millionaires there are two that are rumoured to stand above them all, but it has not actually been verified. The first of these is actually not a person, but rather the US government, or in actual fact the FBI. After the seizure of Silk Road, the FBI came into control of the largest known wallet of bitcoin known at the time, containing 144,000 bitcoin. Other seizures from Silk Road affiliated sites, added reputedly another 30,000 Bitcoin. This puts them above the value of the Winkelvoss stake in Bitcoin.
At the reputed number one spot is the illusive and legendary Satoshi Nakamoto. The inventor of Bitcoin. Although even the identity of Satoshi is still a mystery, it is understood that in the early days of Bitcoin he mined 1 million tokens, which he then distributed amongst various wallets. Whilst there is no way to verify his holdings, it adds a layer to the elusive mystique surrounding Bitcoin’s legendary inventor.
About the Author:
Adinah Brown is a professional writer who has worked in a wide range of industry settings, including corporate industry, government and non-government organizations. Within many of these positions, Adinah has provided skilled marketing and advertising services and is currently the Content Manager at Leverate.
Our focus is to provide you with updated and accurate market price predictions for all of 2018, we believe we are entering a period that will be fantastic for traders and active investors. We believe this recent volatility has shaken out the low volatility expectations and will allow the markets to start moving in a more normal rotational mode going forward. This means we’ll have lots of trading opportunities to profit from.
For those of you who have not been following our research over the past 2 to 3 months, we urge you to visit our Technical Traders Ltd. website to read our published research and to learn how we’ve been calling these moves in the markets for our members. We called the early 2018 market rally weeks before it started. We called the lower price rotation over a month before it happened. We called the bottom in this price correction almost to the day and told our members that we believed a very quick Pennant price formation was set up that will drive prices higher which we have seen this week.
Members know price should move higher leading to a March 15 price cycle peak. After that point, we’ll refresh our analysis for our members and attempt to provide further guidance. Today/Friday we closed our Short position in UVXY for a quick 50% in 9 days.
In this post, we are going to focus on one of our price modeling systems based on Adaptive Fibonacci Price Modeling and show you why we believe this recent price move will likely stabilize within a range while attempting future moves. Let’s start with the INDU.
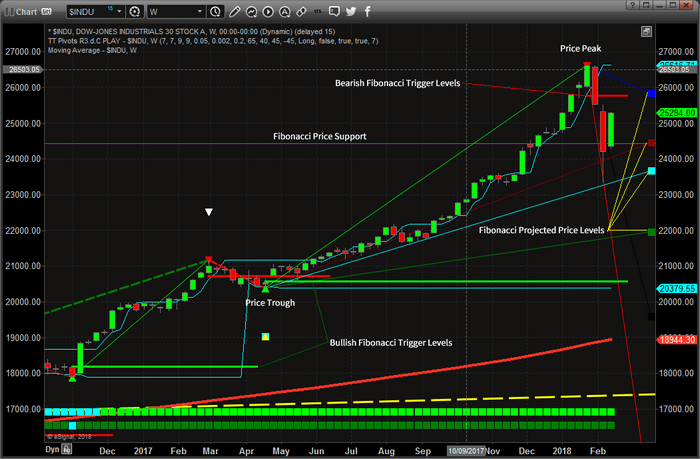
WEEKLY DOW JONES CHART
This first chart is the INDU Weekly chart with our Fibonacci Modeling system at work. We’ve highlighted certain areas with notes to help you understand it in more detail. This adaptive modeling system tracks price high and low points in various cycle lengths, then attempts to adapt a major and moderate cycle analysis model to key Fibonacci predictive points. The end result is that we can see where key Fibonacci price trigger levels are and also see what our predictive modeling system is telling us where prices is likely headed.
This weekly, chart shows us that the current support level (originating from near April 2017) is nearly exactly where the current price correction found support. This level is currently acting as a strong base for current price action and will likely continue to provide very strong support going forward. You can also see the Bearish Fibonacci Price Level near 25,776 that is acting like Resistance. Notice that this Bearish Fibonacci Price Level also coincides with the BLUE Fibonacci projected price level.
It is still our opinion that the US major markets will continue moderate price rotation within these levels for the next 5+ days before reaching an intermediate price low cycle near February 21. After this price low cycle is reached, we believe a new price advance will begin to drive the US majors higher reaching a peak near March 15.
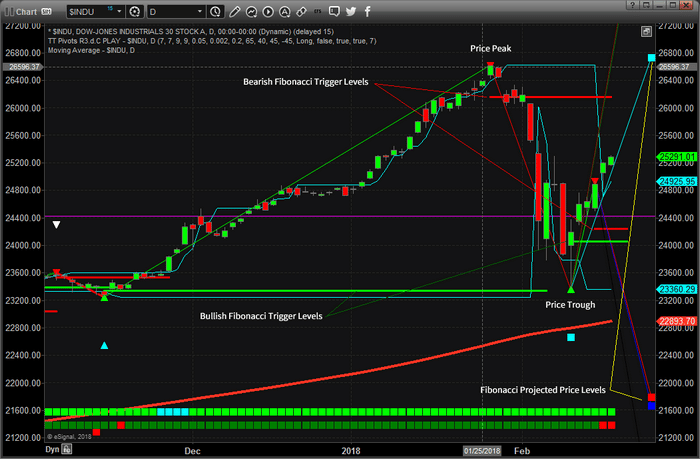
DAILY DOW JONES CHART
This next INDU Daily chart provides more detail of our projected analysis. Again, please read the notes we’ve made on this chart to assist you in understanding how we are reading it and interpreting it. The most recent price peak and trough clearly show the volatility spike that happened last week. It also shows us that the recent trough in price aligned almost perfectly with a Bullish Fibonacci Price Level from November 2017. We interpret this as a clear “double bottom” formation at Fibonacci Support.
The purple horizontal line is the Support Level originating from the earlier, Weekly, chart for reference.
This Daily chart shows more detail in terms of the Fibonacci Projected Price Levels and also shows the wide range of price that we are currently experiencing. Over time, this wide range will likely diminish a bit as the trend continues to consolidate price rotation into more narrow bands, but right now we have a very wide range of price volatility that we have to deal with. Additionally, the current upward price rotation is above the Bullish Fibonacci Price Level from the recent lows. This is a clear indication that prices want to continue to push higher till some new price peak is in place. We expect that will happen fairly soon.
Notice how the Fibonacci Projected Price Levels are quite a way away from the current price levels? This is because the recent increase in volatility is alerting the price modeling system that we expect larger range price rotation. As newer and more moderate price rotations form, these levels will begin to consolidate a bit with new price levels.
As of right now, our analysis has really not changed much since last week. We believe the Feb 21 price low will prompt a rally into the March 15 price peak. At that time, we’ll take a fresh look at these modeling systems to see what they can tell us about the future.
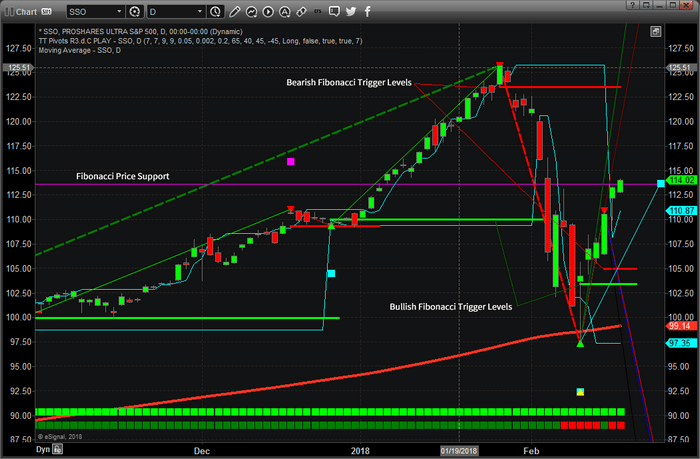
DAILY SP500 (SSO ETF) CHART
The last chart I wanted to share with you is the Daily SSO chart. This chart helps to firm up our analysis of what to expect in the immediate future as well as continues to support our analysis that the US Majors will likely stall near current levels and retrace slightly headed into the Feb 21 price low. Remember, we don’t believe this Feb 21 price low will be anywhere close to the recent lows. This move lower will be much more subdued and moderate in size and scope.
With this SSO chart, the Adaptive Fibonacci Price Modeling system is showing a potential “Major Bottom” near the recent lows. This happens when the system identifies a potentially massive or major price bottom. Over time, the modeling system will confirm this trigger or replace it with a new trigger when it forms.
We still see the massive price volatility in this chart. We still see the Fibonacci Price Trigger Levels that tell us we are below the Bearish Price Trigger (near the recent top) and above the Bullish Price Trigger (near the recent bottom), so what should expect price to do? At this point, the most recent Price Trigger Breach is the Bullish Price Trigger – thus we are expecting prices to continue higher overall. The new Bearish Fibonacci Price Trigger, below the current prices, is what we would watch for any signs of price weakness. When that level is breached, then we begin a new potential down leg.
Right now, we will issue this one simple warning – the upside move is likely to be ending soon and preparing for our February 21 price low point. The fact that prices are showing that they’ve already reached the Fibonacci Projected Price Level is telling us this upside leg may be over for now which is the reason we exited our short UVXY position here for a 50% profit.
Next, we expect the US majors to rotate lower for a few days headed into a February 21 price low. This will be following by an almost immediate and strong upside push to a March 15th price peak.
This means we will be setting up for some great trades over the next few days/weeks. Imagine being able to know that near February 20~22, we should be able to “pick” the best opportunities for quick trades where the US majors begin a new up leg? Also, imagine how critical this type of information can be to you going forward?
Our research team at www.TheTechnicalTraders.com has a combined 53 years of trading and analysis experience. We develop specialized and proprietary price modeling systems, like these, to assist us in being able to provide our members with an “edge” in the markets. Of course, we are not always 100% accurate with our predictions – no one can be 100% accurate. We simply do our best to make sure our members get the best we can offer them each and every day. We want them to understand the opportunities that are playing out and we help them find the best trade triggers for profits each week.
Stay tuned for our next post on Sunday with an instant trade setup, so be sure to join our free mailing list!
If you find this information valuable and would like to include it in your daily trading activities, visit www.TheTechnicalTraders.com – Wealth Building Newsletter today!
As we can see in the H4 chart, the convergence made BTCUSD reverse and start a new ascending correction, which has already reached the retracement of 38.2%. In the short-term, the price may continue the correction towards the retracements of 50.0% and 61.8% at 11613.00 and 12935.00 respectively. The main support level is the low at 5980.00.
Risk Warning: the results of previous trading operations do not guarantee the same results in the future.
In the H1 chart, the pair is trading upwards to reach 11613.00. However, we can see the divergence being formed, which may indicate a new short-term correction to the downside towards the retracements of 38.2% and 50.0% at 9505.00 and 9290.00 respectively.
Risk Warning: the results of previous trading operations do not guarantee the same results in the future.
ETHUSD, “Ethereum vs. US Dollar”
As we can see in the H4 chart, ETHUSD is forming a new ascending correction after the convergence. By now, the correction has already reached the retracement of 50.0%. The next target may be the retracement of 61.8% at 1000.00. After reaching the target, the price may resume falling. The targets of this possible decline may be the retracements of 23.6%, 38.2%, 50.0%, and 61.8% at 896.00, 833.00, 784.00, and 735.00 respectively.
Risk Warning: the results of previous trading operations do not guarantee the same results in the future.
In the H1 chart, the pair is trading towards 1000.00.
Risk Warning: the results of previous trading operations do not guarantee the same results in the future.
Attention! Forecasts presented in this section only reflect the author’s private opinion and should not be considered as guidance for trading. RoboForex LP bears no responsibility for trading results based on trading recommendations described in these analytical reviews.
 Risk Warning: the results of previous trading operations do not guarantee the same results in the future.