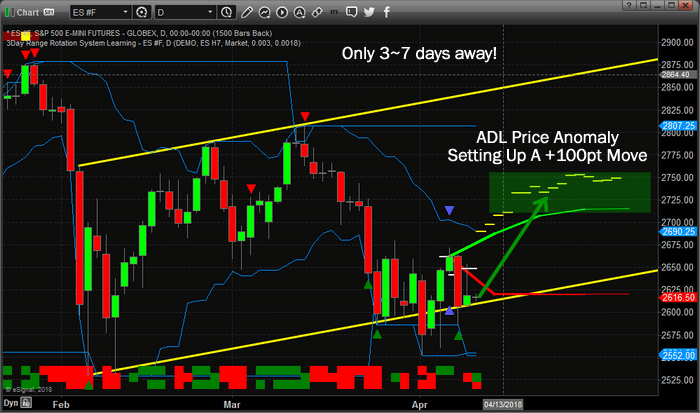
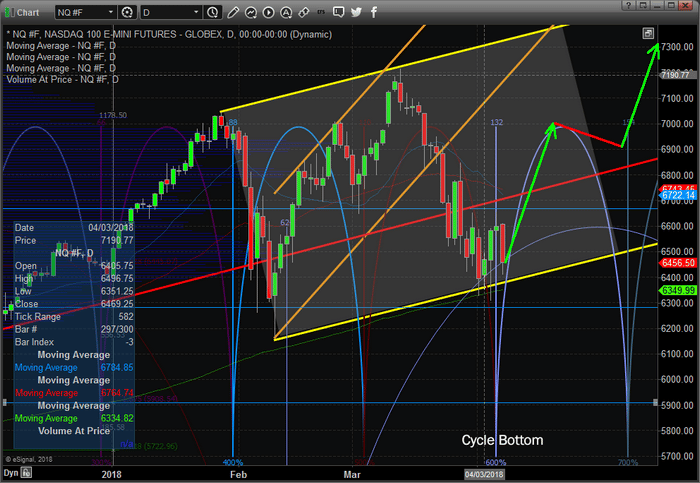
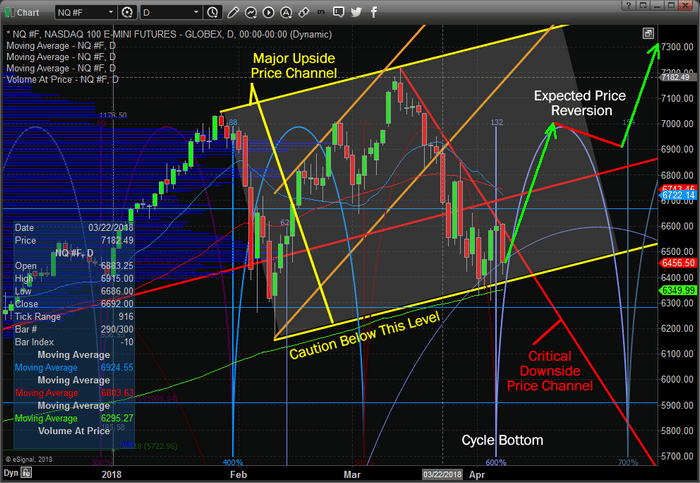
Article By RoboForex.com
EURUSD, “Euro vs US Dollar”
As we can see in the H4 chart, EURUSD is about to finish the downtrend and start a new rising impulse. The short-term targets may be the local high at 1.2476 and then the long-term one at 1.2556. If the instrument breaks the latter level, the pair may trade towards the post-correctional extension area between the retracements of 138.2% and 161.8% at 1.2577 and 1.2639 respectively. However, if the price fails to break the resistance level at 1.2555, it may start a new descending movement towards the retracement of 50.0% at 1.2055.


In the H1 chart, the convergence made the pair reverse and start a new uptrend, which has already reached the retracement of 38.1%. The next targets may be the retracements of 50.0%, 61.8%, and 76.0% at 1.2346, 1.2376, and 1.2414 respectively. The support level is the short-term low at 1.2154.

USDJPY, “US Dollar vs. Japanese Yen”
As we can see in the H4 chart, the convergence made USDJPY start a new ascending correction, which has already reached the retracement of 23.6%. The next upside targets are the retracements of 38.2%, 50.0%, and 61.8% at 108.12, 109.20, and 110.26 respectively. The support level is the low at 104.63.

In the H1 chart, the pair is being corrected downwards. Overall, the short-term uptrend is moving towards 108.12.

RoboForex Analytical Department
Article By RoboForex.com
Attention!
Forecasts presented in this section only reflect the author’s private opinion and should not be considered as guidance for trading. RoboForex LP bears no responsibility for trading results based on trading recommendations described in these analytical reviews.