AUDUSD is trading at 0.7515; the instrument is moving below Ichimoku Cloud, which means that it may continue falling. The markets could indicate that the price may test Tenkan-Sen and Kijun-Sen at 0.7535 and then continue moving downwards to reach 0.7430. Another signal to confirm further descending movement is the price’s rebounding from the upside border of the descending channel. However, the scenario that Implies further decline may be cancelled if the price breaks the upside border of the cloud and fixes above 0.7610. In this case, the pair may continue growing towards 0.7690.
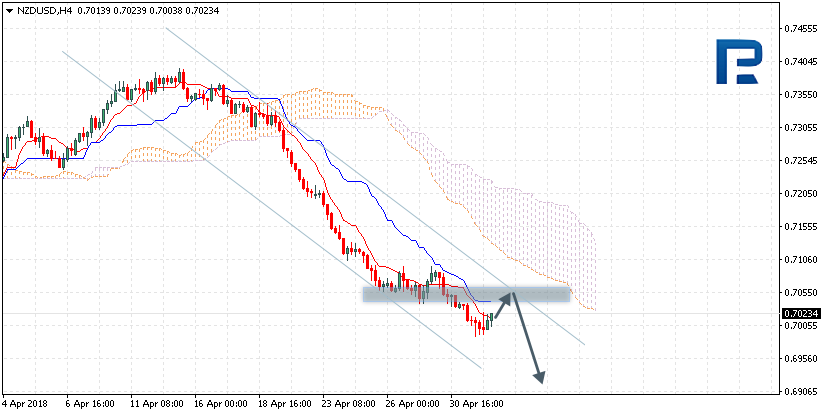
NZDUSD, “New Zealand Dollar vs US Dollar”
NZDUSD is trading at 0.7023; the instrument is moving below Ichimoku Cloud, which means that it may continue falling. The markets could indicate that the price may test Tenkan-Sen and Kijun-Sen at 0.7055 and then continue moving downwards to reach 0.6930. Another signal to confirm further descending movement is the price’s rebounding from the resistance level. However, the scenario that implies further decline may be cancelled if the price breaks the upside border of the cloud and fixes above 0.7140. In this case, the pair may continue growing towards 0.7220.
USDCAD, “US Dollar vs Canadian Dollar”
USDCAD is trading at 1.2817; the instrument is moving above Ichimoku Cloud, which means that it may continue growing. The markets could indicate that the price may test the upside border of the cloud at 1.2815 and then continue moving upwards to reach 1.2970. Another signal to confirm further ascending movement is the price’s rebounding from the support level. However, the scenario that implies further decline may be cancelled if the price breaks the downside border of the cloud and fixes below 1.2700. In this case, the pair may continue falling towards 1.2610.
Attention! Forecasts presented in this section only reflect the author’s private opinion and should not be considered as guidance for trading. RoboForex LP bears no responsibility for trading results based on trading recommendations described in these analytical reviews.
EURUSD has broken 1.2055 and is still falling towards the short-term target at 1.1974. Later, the market may form another consolidation range near the lows. If the instrument breaks this range to the upside, the market may start another correction to reach 1.2200; if to the downside – resume trading to the downside towards 1.1900.
GBPUSD, “Great Britain Pound vs US Dollar”
GBPUSD has broken 1.3700 and is still falling towards 1.3500. Possibly, today the price may reach 1.3575 and then grow towards 1.3640. After that, the instrument may resume trading with the target at 1.3500.
USDCHF, “US Dollar vs Swiss Franc”
USDCHF has broken 0.9922 and may continue trading to the upside to reach 0.9988. Later, the market may form another consolidation range. If the instrument breaks this range to the upside, the market may continue growing to reach 1.0100; if to the downside – start another correction towards 0.9800.
USDJPY, “US Dollar vs Japanese Yen”
USDJPY has broken 109.50 and may continue growing to reach 109.88. Later, the market may form another consolidation range. If the instrument breaks this range to the upside, the market may continue trading to the upside to reach 111.00; if to the downside – start another correction towards 108.00.
AUDUSD, “Australian Dollar vs US Dollar”
AUDUSD has broken 0.7535. Today, the price may continue falling to reach the short-term target at 0.7445.
USDRUB, “US Dollar vs Russian Ruble”
USDRUB is consolidating near the upside border of the range. If later the instrument breaks this range to the upside, the market may continue growing to reach 63.83; if to the downside – resume trading to the downside towards 61.55.
XAUUSD, “Gold vs US Dollar”
Gold is moving downwards. Possibly, the price may rebound from 1311.00 and then fall to reach 1297.00. After that, the instrument may form another consolidation range. If later the instrument breaks this range to the downside, the market may continue trading to the downside to reach 1275.00; if to the upside – start another correction towards 1325.00.
BRENT
Brent has rebounded from 76.00 and is back to consolidating. Possibly, today the price may fall to reach 72.78 and then grow towards 74.45. If later the instrument breaks this range to the downside, the market may start another correction to reach 70.00; if to the upside – resume growing towards 77.00.
Attention! Forecasts presented in this section only reflect the author’s private opinion and should not be considered as guidance for trading. RoboForex LP bears no responsibility for trading results based on trading recommendations described in these analytical reviews.
The U.S. dollar was seen maintaining the bullish momentum on the day. European markets were closed on account of the 1st May bank holiday. Economic data showed that the UK’s manufacturing PMI was weaker than expected at 53.9.
In the U.S. the ISM manufacturing PMI was seen falling to 57.3 missing forecasts of 58.4 and slower than the March PMI reading of 59.3.
On the political front, the U.S. administration was seen exempting South Korea, Mexico, Canada and the EU from the steel and aluminum tariffs that were due to come into effect from the 1st of May. However, the exemption is not long term as the U.S. only delayed the tariffs by 30 days for the above nations.
Looking ahead, the economic calendar today will mark the release of the UK’s construction PMI data which will conclude the monthly PMI’s for April. Economists forecast that the UK’s construction activity slightly improved to 50.5 after falling into contraction the month before.
The Eurozone will be releasing the manufacturing and services PMI data for the month of April. No major changes are expected but activity is expected to remain subdued. The flash GDP estimates for the first quarter will also be released this week. The Eurozone GDP is forecast to rise 0.4% on the quarter, marking a slower pace of increased from 0.6% in the previous quarter.
The FOMC statement will take center-stage today. No changes are expected to the short-term interest rates. There will be no press conference or any economic projections.
EURUSD intra-day analysis
EURUSD (1.2005): The EURUSD currency pair was seen testing fresh monthly lows on Tuesday. The common currency touched lows of 1.1981 before recovering only modestly. The breakdown below the 1.2090 – 1.2070 level indicates that any near-term gains would be limited to this level where resistance could be established. The 4-hour Stochastics remains in the oversold region which indicates a potential rebound in prices in the near term.
GBPUSD intra-day analysis
GBPUSD (1.3612): The British pound continued the declines yesterday following the doji pattern that was formed the previous day. The breakout from the long term rising trend line indicates that GBPUSD is likely to push lower. The next main support level is seen at 1.3530 which could be tested in the near term. A rebound in prices cannot be ruled out as we expect to see a modest correction in the near term. Further declines cannot be ruled out if GBPUSD breaks below 1.3530 which will see the next support level at 1.3500 coming into the picture.
XAUUSD intra-day analysis
XAUUSD (1310.43): Gold prices posted a strong decline on the day as price action slipped below the 1311 – 1307 level of support. Gold prices briefly dropped to the 1301.80 level before recovering. With price action back in the support zone, only a clean breakout above 1311 will signal further gains. To the downside, we expect price action to be limited at the current levels. The previously breached support level at 1325 remains the upside target which could be tested for resistance.
By CentralBankNews.info Georgia’s central bank kept its key refinancing rate at 7.25 percent but said it would consider a gradual easing of its “moderately tight” monetary policy stance “once the factors pushing inflation upwards are sufficiently weakened.”‘ The National Bank of Georgia (NBG), which has maintained its rate after raising it by 25 basis points in December 2017 after a fall in the lari’s exchange rate, said relatively higher volatility seen on international financial markets had increased the risk of a stronger transmission of inflationary pressures from its main trading partners. The central bank acknowledged it was keeping a tight policy despite the fact that demand remains below the country’s potential level of output, putting downward pressure on inflation. The NBG’s rate hike on Dec. 13 helped reverse a 9 percent fall in the lari from late October to mid-November, with the lari rising13.4 percent against the U.S. dollar between Dec. 1 and April 5. Since then the lari has weakened and was trading at 2.46 today, down 2.8 percent since April 5. However, the lari still remains 5.3 percent higher than at the start of 2018. Georgia’s inflation rate declined at the start of this year as the impact of last year’s hike in tobacco and fuel taxes dissipates and the central bank confirmed that it expects inflation to remain close to its target level of 3.0 percent this year. In March headline inflation rose slightly to 2.8 percent in March from 2.7 percent in February. Georgia’s economy recovered in 2017 and growth this year is expected to remain strong, with the government’s reform program supporting investment and productivity. The central bank said preliminary estimates show growth of 5.2 percent in the first quarter of this year and 5.6 percent in March, with the positive external sector helping boost exports and tourism. However, NBG cautioned that imports were growing stronger than last year, a fact that was also raised by the International Monetary Fund (IMF) earlier this month. On April 16 the IMF said Georgia’s current account deficit was expected to widen slightly due to higher oil prices and public investment but over the medium term sustained implementation of its economic reform program should support higher and more inclusive growth. In 2017 Georgia’s current account deficit narrowed to 8.7 percent of Gross Domestic Product due to “rapid growth in exports, tourism, remittances,” the IMF said. The IMF also said it expected fiscal prudence to continue and the deficit to decline in the medium term despite scaling-up public investment and the deficit should narrow to 2.8 percent this year from 2.9 percent in 2017. The IMF also said NBG’s monetary policy stance was “adequate and appropriately focuses on price stability,” adding that inflation this year is seen in line with target and the flexible exchange rate remains critical to protect the economy against external shocks.
The National Bank of Georgia issued the following statement:
“The Monetary Policy Committee (MPC) of the National Bank of Georgia (NBG) met on May 1, 2018 and decided to keep the refinancing rate unchanged at 7.25 percent.
As it was expected, once the temporary factors have mostly petered out, the inflation declined at the beginning of 2018 and it stood at 2.8 percent in March. According to the current forecast, other things equal, the inflation will remain close to its target level (3 percent) throughout the year. Despite the fact that aggregate demand remains below the potential level of output, thus having a downward pressure on inflation, the relatively higher volatility observed on international financial markets increases the risks of stronger transmission of inflationary pressures from the main trading partner countries. As a result, the committee deemed it appropriate to maintain the moderately tight monetary policy. The gradual easing of the policy will be considered once the factors pushing inflation upwards are sufficiently weakened.
The high growth of economic activity continued at the beginning of 2018. Based on preliminary estimates, economy grew by 5.6% annually in March, while in the first quarter the real growth stood at 5.2%. According to current forecasts, as in 2017, relatively high growth of economic activity is expected to carry on in 2018, thus narrowing the negative output gap.
The positive trends in the external sector persisted at the beginning of 2018. The first quarter of 2018 revealed high growth of exports and tourism revenues. The remittances continued to grow as well. However, the growth rate of imports is higher compared to the previous year.
The NBG will continue to monitor the developments in the economy and financial markets and will use all means and instruments at its disposal in order to ensure the price stability.
The next meeting of the Monetary Policy Committee will be held on June 13, 2018.”
By CentralBankNews.info Australia’s central bank left its benchmark cash rate at 1.50 percent, as expected, and said it expects economic growth to pick up to “a bit above 3 per cent in 2018 and 2019,” returning to its growth forecast that it seemed to have abandoned in recent months. The Reserve Bank of Australia (RBA), which has maintained its rate for a record 21 months since August 2016, added it also expects spare capacity in the economy to be reduced as business conditions are positive with non-mining business investment rising, public infrastructure investments are supporting the economy, and exports are expected to show stronger growth. In its March and April statements, the RBA dropped an earlier reference for growth this year to be a “bit above 3 per cent” and merely said it expects faster growth. This prompted investors to widen the odds of a rate hike this year, and the dampened prospects for growth were confirmed when data showed Australia’s Gross Domestic Product grew by only 0.4 percent in the fourth quarter of 2017, below forecasts of 0.6 percent and the slowest since the third quarter of 2016. Year-on-year the economy grew by 2.4 percent, down from 2.9 percent in the third quarter. But the RBA appears to have turned more optimistic and its governor, Philip Lowe, confirmed at a dinner in Adelaide the economy was stronger than a year ago, with business conditions around their highest level for many years as the long-awaited pick-up in non-mining investment is taking place. Lowe said the RBA’s latest staff forecast, to be released on Friday, will show only “small changes” from the previous forecast but the central scenario for this year and next year “remains for the Australian economy to grow a bit faster than 3 per cent,” supported by a “pretty positive” international backdrop. Stronger growth should also help reduce some of the spare capacity in the economy, lowering the unemployment rate, pushing up wages and thus inflation. In Adelaide Lowe said wage increase of around 2 percent now seems to be the norm, rather than the 3-4 percent increases a while back. “And in terms of the inflation target, it is difficult to see how a continuation of 2 percent growth in wages is compatible with us achieving the midpoint of the inflation target – 2-1/2 per cent – on a sustained basis,” Lowe said. Australia’s headline inflation rate was steady at 1.9 percent in the first quarter of this year from the fourth quarter of last year and the RBA expects inflation to be a bit over 2 percent this year. It targets inflation of 2-3 percent. In its statement, the RBA said the exchange rate of the Australian dollar had depreciated a little recently but it remains within the range seen over the last two years on a trade-weighted basis. “An appreciating exchange rate would be expected to result in a slower pick-up in economic activity and inflation that currently forecast,” the RBA said, reiterating its recent view. The Australian dollar has been weakening since late January and fell further today to trade at 1.33 to the U.S. dollar, down 3.8 percent this year.
The Reserve Bank of Australia issued the following statement:
“At its meeting today, the Board decided to leave the cash rate unchanged at 1.50 per cent.
The global economy has strengthened over the past year. A number of advanced economies are growing at an above-trend rate and unemployment rates are low. The Chinese economy continues to grow solidly, with the authorities paying increased attention to the risks in the financial sector and the sustainability of growth. Globally, inflation remains low, although it has increased in some economies and further increases are expected given the tight labour markets. As conditions have improved in the global economy, a number of central banks have withdrawn some monetary stimulus and further steps in this direction are expected.
Long-term bond yields have risen over the past six months, but are still low. Equity market volatility has increased from the very low levels of last year, partly because of concerns about the direction of international trade policy in the United States. Credit spreads have also widened a little, but remain low. Financial conditions generally remain expansionary. Conditions in US dollar short-term money markets have, however, tightened over the past few months, with US dollar short-term interest rates having increased for reasons other than the increase in the federal funds rate. This has flowed through to higher short-term interest rates in a few other countries, including Australia.
The price of oil has increased recently, as have the prices of some base metals. Australia’s terms of trade are expected to decline over the next few years, but remain at a relatively high level.
The Bank’s central forecast for the Australian economy remains for growth to pick up, to average a bit above 3 per cent in 2018 and 2019. This should see some reduction in spare capacity in the economy. Business conditions are positive and non-mining business investment is increasing. Higher levels of public infrastructure investment are also supporting the economy. Stronger growth in exports is expected. One continuing source of uncertainty is the outlook for household consumption, although consumption growth picked up in late 2017. Household income has been growing slowly and debt levels are high.
Employment has grown strongly over the past year, although growth has slowed over recent months. The strong growth in employment has been accompanied by a significant rise in labour force participation, particularly by women and older Australians. The unemployment rate has declined over the past year, but has been steady at around 5½ per cent for some months. The various forward-looking indicators continue to point to solid growth in employment in the period ahead, with a further gradual reduction in the unemployment rate expected. Notwithstanding the improving labour market, wages growth remains low. This is likely to continue for a while yet, although the stronger economy should see some lift in wages growth over time. Consistent with this, the rate of wages growth appears to have troughed and there are reports that some employers are finding it more difficult to hire workers with the necessary skills.
Inflation remains low. The recent inflation data were in line with the Bank’s expectations, with both CPI and underlying inflation running marginally below 2 per cent. Inflation is likely to remain low for some time, reflecting low growth in labour costs and strong competition in retailing. A gradual pick-up in inflation is, however, expected as the economy strengthens. The central forecast is for CPI inflation to be a bit above 2 per cent in 2018.
The Australian dollar has depreciated a little recently, but on a trade-weighted basis remains within the range that it has been in over the past two years. An appreciating exchange rate would be expected to result in a slower pick-up in economic activity and inflation than currently forecast.
The housing markets in Sydney and Melbourne have slowed. Nationwide measures of housing prices are little changed over the past six months, with prices having recorded falls in some areas. In the eastern capital cities, a considerable additional supply of apartments is scheduled to come on stream over the next couple of years. APRA’s supervisory measures and tighter credit standards have been helpful in containing the build-up of risk in household balance sheets, although the level of household debt remains high.
The low level of interest rates is continuing to support the Australian economy. Further progress in reducing unemployment and having inflation return to target is expected, although this progress is likely to be gradual. Taking account of the available information, the Board judged that holding the stance of monetary policy unchanged at this meeting would be consistent with sustainable growth in the economy and achieving the inflation target over time.”
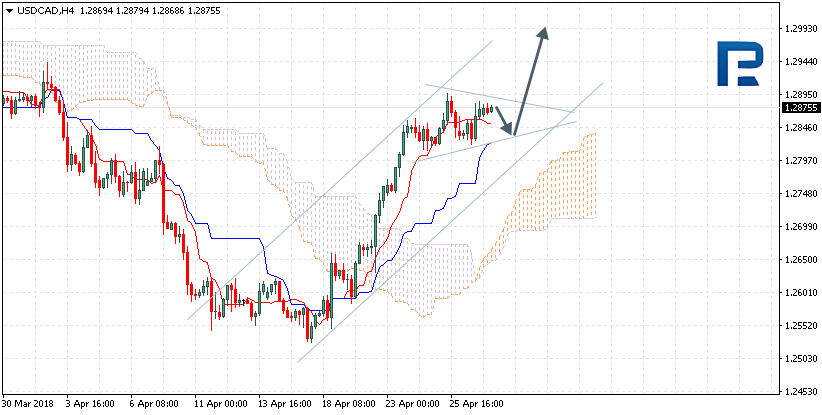
As we can see in the H4 chart, after reaching the resistance level once again, USDCAD has formed several Doji, Hanging Man, and Shooting Star reversal patterns there. Judging by the previous movements, at the moment it may be assumed that the current movement is another pullback before the instrument continues growing to update its closest highs.
AUDUSD, “Australian Dollar vs US Dollar”
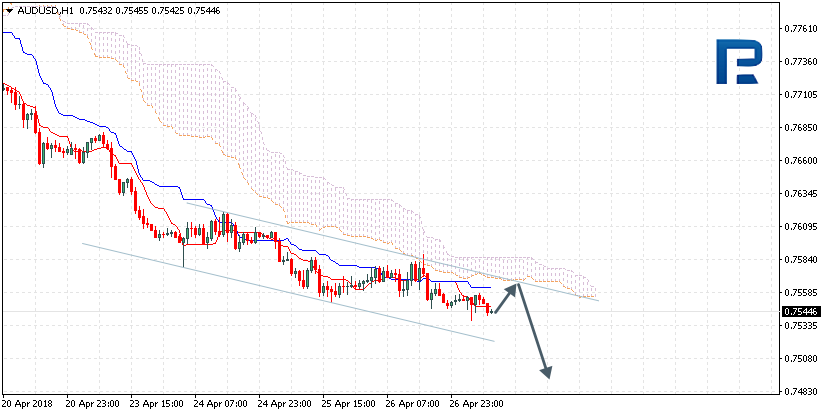
As we can see in the H4 chart, AUDUSD has reached the support level and formed several Doji, Hammer, and Inverted Hammer reversal patterns there. Judging by the previous movements, at the moment it may be assumed that these candlesticks indicate a possible correction before the instrument resumes falling.
Attention! Forecasts presented in this section only reflect the author’s private opinion and should not be considered as guidance for trading. RoboForex LP bears no responsibility for trading results based on trading recommendations described in these analytical reviews.
One very important component of the continued research we, www.TheTechnicalTraders.com, conduct into price, price patterns and price rotation is the study and application of Fibonacci price modeling. As you have seen with some of our other charting and modeling tools, we have invested a great deal of time and energy to create useful price modeling tools to assist us in our daily research and analysis.
Our Fibonacci price modeling tool is another adaptive learning model that is capable of adapting to price rotation by learning from past and current price variances as well as repeated price pattern formations. This tool is a one of a kind type of project that we covet with a great deal of respect.
Today, we are going to illustrate how this modeling system assists us and how we attempt to use it to identify trading opportunities and longer term potentials for success. As of April 24, the markets closed dramatically lower – by almost -2% on average. This move lower pushed many of the current prices into a unique price pattern that may be very temporary. We will start by attempting to illustrate the NQ chart with our Fibonacci price modeling system and we want to make one thing very clear….
Today’s downside price rotation, excluding the ES chart, setup a new potential for future bearish trending if the current price is unable to recovery back above the key Fibonacci Bullish Price Level.
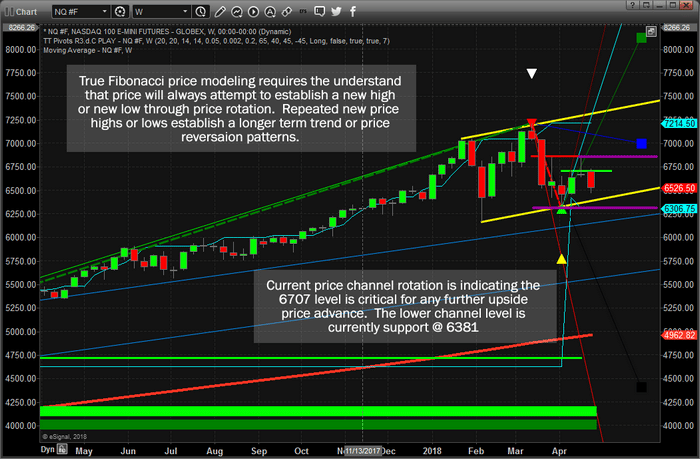
Let’s get started with the NQ chart. The first things we want you to concentrate onto are the YELLOW price channel and the PURPLE price high/low ranges established by price rotation. It is critical that you understand how price rotation, pure price, sets up all of the analysis that this modeling system completes. Nothing else is used other than price and time. The most recent price high and low levels (in most cases) establish the Fibonacci price range. This is what we use to make trending decisions.
This current NQ chart has rotated lower and is currently telling us that we should expect further downside price activity as long as price stays below the Fibonacci Bullish Price Level. Although, our ADL price modeling system is warning that the markets will enter a strong upside rally within days. Thus, it is our opinion that this recent move is a “wash-out” low price rotation that is attempting to fade the longs. The NQ Fibonacci price high is at 6867 and the Fibonacci price low is at 6307 – watch for these levels to be breached before trend accelerates.
The ES chart is set in a similar price formation to the NQ chart. Highlighted on this chart are three primary components of our Fibonacci price modeling system; the projected price levels, the Bullish & Bearish Fibonacci key price levels and the key market price rotation markers (tops and bottoms/price rotation points). Understanding our modeling system is key to your better understanding the research that we provide to you. On the right side of this chart, we’ve highlighted two key projected price levels with lines drawn in CYAN (light blue). We want you to pay special attention to those projected price levels because they became key support and resistance just a few weeks ago. If you understand the significance of this example, you’ll begin to see how past price rotations attempt to predict future price turning points using advanced Fibonacci concepts and theory.
IMPORTANT NOTE: If all of this is a little to advanced to understand, that’s ok too. Maybe you don’t want to understand or learn, and just want nothing but our best trade setups and alerts? Well, members can have our SMS trade alerts so they get only our Buy, Stop, and Profit Taking alerts. Meaning you have trade like a pro and only spend 10-30 minutes a weak to adjust a position or enter a new one as you receive an alert!
This ES chart is showing a similar analysis to that of the NQ – expect continued bearish price action unless the current Bullish Fibonacci price level is breached @ 2718.50. Again, we believe this current downside price move is a “wash-out” low price rotation within a bullish trend. One of the reasons we believe this to be the case is clear if you understand price rotation. Look at the entirety of the move recent price rotation. After establishing the key low price bottom, price has failed to attempt to take out that low.
Remember, price must always attempt to establish new highs or new lows through price rotation within Fibonacci theory. Therefore, until that low is breached, and as long as new higher low has been created, price is failing to commit to new lower lows. Thus, it must be attempting to commit to higher highs. The ES Fibonacci price high is at 2718.50 and the Fibonacci price low is at 2552.00.
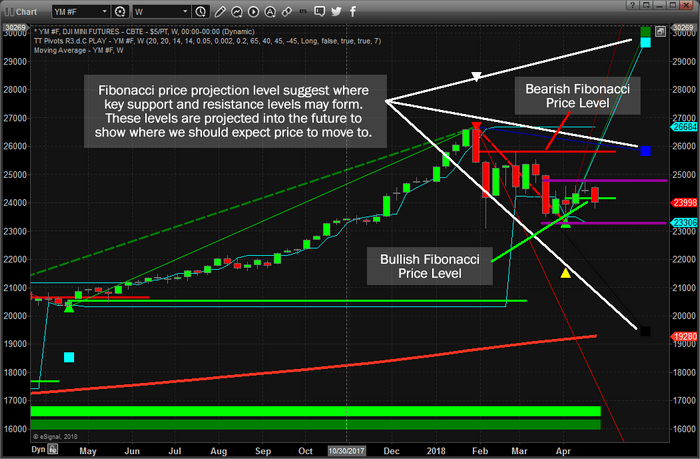
The YM chart below provides the clearest picture, in our opinion, of the detailed Fibonacci price rotation process. Very similar setups in price are still in place between all three charts. Yet, the price rotation on the YM chart provided clear confirmation that price was attempting to advance rather than collapse recently. The Bullish Fibonacci Price Level on the right side of the chart was breached and confirmed three weeks ago with a close above 24135. The NQ and ES did not achieve this key price element in Fibonacci theory.
Additionally, the BLUE downside price projection point was very shallow compared to the recent peak high. This is typically a sign that any price rotation may be shallow as well and short lived. As of the recent closing, the current close is below the Bullish Fibonacci Price Level, thus we are expecting some potential weakness in price until it advanced back above this level. Yet, our believe that this “wash-out low” is a process of targeting near priced longs is still valid. If, at the end of this week, price is back above the Bullish Fibonacci Price Level, we will have further confirmation that this downside move was just a “wash-out low”. The YM Fibonacci price high is at 24827 and the Fibonacci price low is at 23306.
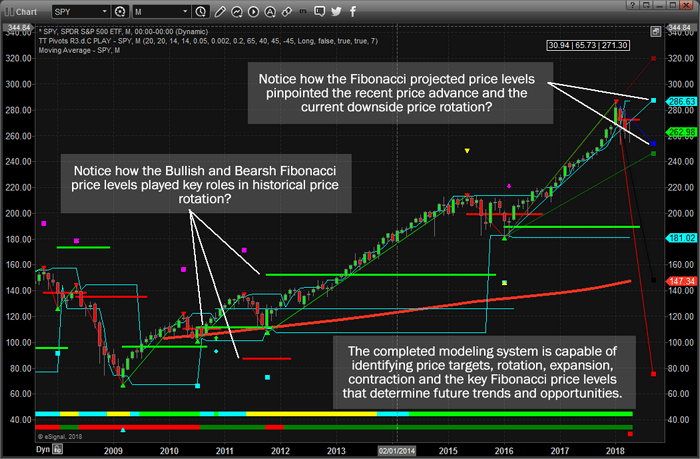
Lastly, we are going to show you a much longer term Monthly SPY chart running our Fibonacci price modeling system for comparison.
When you look at this chart below and compare the price action you see to the previous chart, remember this Monthly chart is really the key to the longer term price potential. As of right now, the current price is below the Bearish Fibonacci Price Level, which indicates a reason to be concerned with potentially further downside price activity. Yet, the projected Fibonacci price levels have clearly defined support and resistance at, or very near to, the current price rotational high and low. This would indicate that the current price rotation is within expected ranges and until a new closing price low is established below the 253.70 level. Any downward price move will find support near 246.30 (the GREEN projected price level).
Price MUST advance +4% from current levels to abate any downside pressure resulting from this recent move. In other words, we need to see a solid price advance over the next 5+ trading days, before the end of April, to technically qualify any further advance higher based on this Monthly Fibonacci modeling system. Of course, the Daily and Weekly models will tell us a much faster and more detailed shorter-term Fibonacci price model for this same price rotation.
We’ve received hundreds of comments regarding our Adaptive Predictive Learning (ADL) price modeling system and we love to hear how all of your are enjoying our research. This Fibonacci price modeling system, once you understand it as well as we do, is a very powerful price modeling tool that helps us identify unique opportunities in the markets for our clients. Each of these tools provide unique benefits and understanding as to what to expect in the future. We try to condense all of this into easy to understand daily updates for all of our valued members so you don’t have to spend decades trying to learn and understand all of this.
Currently, our ADL price modeling system is telling us the markets will attempt to rocket higher within 3~5+ weeks. You’ve probably seen that research or can view it on our web site or from our free email newsletter. Our Fibonacci price modeling system, is warning us that price could fall below support if it does not rally back above the Bullish Fibonacci Price Levels as our ADL model is predicting. Thus, we are suggesting this current downside price rotation is likely a “wash-out” price low that may become somewhat meaningless in the near future.
Follow our Daily video forecasts and our future research to learn more about how we help our clients find profits in these moves. We are already positions for what we believe will be the best opportunities for success with our members. Join us and learn how we can help you find greater success – visit www.TheTechnicalTraders.com today.
AUDUSD is trading at 0.7544; the instrument is moving below Ichimoku Cloud, which means that it may continue falling. The markets could indicate that the price may test Tenkan-Sen and Kijun-Sen at 0.7565 and then continue moving downwards to reach 0.7470. Another signal to confirm further descending movement is the price’s rebounding from the upside border of the descending channel. However, the scenario that Implies further decline may be cancelled if the price breaks the upside border of the cloud and fixes above 0.7610. In this case, the pair may continue growing towards 0.7710.
NZDUSD, “New Zealand Dollar vs US Dollar”
NZDUSD is trading at 0.7052; the instrument is moving below Ichimoku Cloud, which means that it may continue falling. The markets could indicate that the price may test the downside border of the cloud at 0.7065 and then continue moving downwards to reach 0.6970. Another signal to confirm further descending movement is the price’s rebounding from the channel’s upside border. However, the scenario that implies further decline may be cancelled if the price breaks the upside border of the cloud and fixes above 0.7110. In this case, the pair may continue growing towards 0.7210.
USDCAD, “US Dollar vs Canadian Dollar”
USDCAD is trading at 1.2875; the instrument is moving above Ichimoku Cloud, which means that it may continue growing. The markets could indicate that the price may test Tenkan-Sen and Kijun-Sen at 1.2845 and then continue moving upwards to reach 1.2980. Another signal to confirm further ascending movement is the price’s rebounding from the rising channel’s downside border. However, the scenario that implies further decline may be cancelled if the price breaks the downside border of the cloud and fixes below 1.2695. In this case, the pair may continue falling towards 1.2610. After breaking the upside border of the Triangle pattern and fixing above 1.2895, the price may resume growing.
Attention! Forecasts presented in this section only reflect the author’s private opinion and should not be considered as guidance for trading. RoboForex LP bears no responsibility for trading results based on trading recommendations described in these analytical reviews.
On Thursday the 26th of April, trading on the euro closed down against the US dollar. Sellers broke the support at 1.2115 (low from the 1st of March). Volatility on the pair was high throughout the European session.
During Mario Draghi’s press conference, the euro recovered to 1.2210. This rise was made possible by Draghi’s remarks that the ECB didn’t discuss the value of the euro at their meeting. From the session high, the bears beat the bulls back to 1.2096. In the end, the euro produced movements totalling about 180 pips, not including the fluctuations that occurred ahead of the ECB rate decision.
Buyers, having clearly weighed the pros and cons, decided to short the euro. Draghi didn’t give any clear signals as to the end of the bond-buying program. He reiterated that the QE program would not be ended until the regulator was convinced that inflation was growing steadily. After QE comes to an end, key rates will remain at their current levels for a while to come. This is all written in the ECB’s press release and is repeated every meeting.
17:00 USA: Michigan consumer sentiment index (Apr).
20:00 USA: Baker Hughes US oil rig count.
Fig 1. EURUSD hourly chart. Source: TradingView
I said yesterday that Draghi’s press conference could easily push the euro up 100 pips, followed by an equal movement in the opposite direction. The total movement in both directions amounted to 180 pips, with the euro dropping from 1.2210 to 1.2096.
The bears stopped shorting the euro at the 90th degree. At the time of writing this review, the euro is trading at 1.2099. I’m forecasting a drop in the rate to somewhere within a range of 1.2072 – 1.2045. The area between the 112th and 135th degrees looks like a reversal zone to me, but I think we could see rates make it to 1.20; the lower line of the channel. The channel is visible on both the daily and weekly timeframes.
Now I’d like to draw attention to a couple of things. The euro dropped in tandem with US10Y bond yields. If bond yields continue to decline, the EURUSD pair could proceed to move sideways above the 90th degree within a range of 1.2095 – 1.2130 provided it gets some help from some of the crosses.
There are plenty of important events today, including a speech from Mark Carney.
Until about 18 months ago, crypto-currencies were only making ripples in the trading news pond. We knew they were there, and they seemed to be making some profit for the people who got in early. But it wasn’t a very big deal in traditional trading circles and they were seen as something significantly separate as to be able to be ignored.
Most traditional traders disregarded Bitcoin as an insignificant upstart, with no future in it. However, some have seen its potential and run with it, and later with other crypto-currencies too.
Now of course, it is clear to see that crypto-currencies will be around for a long time to come, and as such they need to be included in trading strategies as something that could potentially have an effect on investments.
In this current global trading market, some traders are now asking the question, “Should I stay in Forex or move to Crypto?”
There is a polarised debate in the trading markets about Forex vs. Crypto. On one side of the argument, Crypto is the future. On the other side, Crypto is heading for a major crash and possibly even a wipe-out.
There is a pretty balanced pro/con argument for both currency types, with some of Crypto’s pros being Forex’s cons and vice versa. Here is a short comparison of the two in various criteria.
Volatility/Stability
Forex –The forex markets are very stable, consistently exhibiting only 1% variability across the markets. Large-scale fluctuations are rare. Lack of volatility in Forex can mean that realising consistent profit can be challenging.
Crypto –Crypto volatility creates a near perfect situation for considerable trading ranges. Fluctuating values between 5% and 10 % are not rare and even as high as 15% volatility is not uncommon.
Conclusion: This is a win for Crypto, with volatility being a benefit to Crypto traders and stability is both a benefit and a drawback to Forex traders.
Cost
Forex –There are several costs associated with Forex trading such as commission costs, swap, and spread.
Crypto–There are limited costs associated with buying Crypto.
Conclusion: This is a win for Crypto. Forex really does have the higher costs associated, often with someone in the middle taking those costs as profit.
Leverage
Forex –Given that profits in Forex can only be made by trading large volumes, leverage is readily available for high liquidity currencies, with brokerages offering up to 1:500 in leverage.
Crypto –Crypto-currencies don’t trade like fiat currencies. They can only be bought outright, not traded on margin. There are no contracts for difference (CFD).
Conclusion: We can call this a draw. While considerably higher leverage on the Forex markets can allow for larger profit realisation, the outright buying of crypto-currencies will allow the investment to drop in value, but a trader will still own them and can wait out the dip. Higher leverage in the Forex markets can also wipe out a trading account if the trade makes a significant loss.
Liquidity
Forex – The sheer scale of the forex market guarantees a high level of liquidity, with broad-ranging currency pairs to trade. There is never any shortage in the amount of currency traded. Annual Cash trades are estimated at around 5 Trillion.
Crypto – Comparatively small volumes of coins to trade and rarely any large volumes in one “place” for purchase. Conversely, few exchanges are large enough (or rich enough) to handle large sales of coins such as Bitcoin, unless acting as a broker.
Conclusion: Forex definitely wins in the liquidity stakes. The reason is that crypto-currencies are generally held by retail traders, which means there are no large-scale institutions holding vast numbers of crypto-currency
Insulation
Forex –The Forex market is not insulated from the global economy – it is driven by it. Consequently, prices rise and fall in correspondence with internal and external factors, most of which are newsworthy and able to be tracked and counteracted.
Crypto –Due to their decentralised nature, crypto-currencies are not affected by the same socioeconomic and geopolitical incidences that affect fiat currencies. By the same virtue, you can’t really use news events to predict the price action.
Conclusion: This is another draw. Both the Forex and Crypto markets can see this as a benefit and a drawback.
The Bottom Line
Considering all of the variables covered above, it is pretty close to a 50:50 split on pros and cons depending on your trading style, preferences and requirements. The only person who can tell you which way to jump is you. There is no quick substitute for doing your own research on this subject, and I don’t think any trader can say otherwise.
About the Author:
Amie Parnaby is a professional writer with an experience in a broad range of industries, from I.T to training, from optics to banking. Within these settings, Amie has provided quality web content, training materials and technical documentation. She is currently an in-house Content Writer at Leverate.