“Most investors are convinced that the bull market never went away.”
By Elliott Wave International
The great game of Wall Street — where huge amounts of money are at stake every trading day.
Many speculators play this game by watching for events outside of the stock market that they believe will “trigger” the next big move in prices.
However, the real driver of all those green up arrows and red down arrows is nothing more or less than investor psychology. This famous Kal’s cartoon sums it up perfectly:
First investor: “I’ve got a stock here that could really excel.”
Second investor: “Really excel?”
Fourth investor: “Sell?” — and the crowd goes, “Sell, sell, sell!”
First investor again: “This is madness! I can’t take it any more, good bye!”
Second investor: “Good bye?”
Third investor: “Buy?” — and the crowd goes: “Buy, buy buy!”
As random and unpredictable as this cartoon makes it look, EWI’s research reveals that investor psychology actually goes through similarphases during every market cycle. So, if you know the current psychological phase of the market, you can make a high-confidence prediction about the next phase.
This leads us to what we call Elliott waves, which are simply reflections of these psychological phases. In other words, each wave represents a set of investor attitudes, sentiments and behaviors during a specific phase of the market cycle.
The Wall Street classic book, Elliott Wave Principle: Key to Market Behavior, by Frost & Prechter, states:
… a knowledge of wave personality can be invaluable. Recognizing the character of a single wave can often allow you to interpret correctly the complexities of the larger pattern.
Specifically, EWI’s analysts have observed that the stock market trend develops in five waves, while the reaction against it develops in three waves. So, in a bull market, expect five waves up, followed by a downward move of three waves. In a bear market, expect five waves down, with the upward correction occurring in three waves.
With all of the above in mind, consider these recent expressions of investor psychology. The news excerpts were compiled by the editors of our Elliott Wave Financial Forecast and shown in the March issue:
Do these positive investor sentiments seem odd in the face of the stock market volatility that occurred after the January 26 DJIA high?
Well, there is an explanation.
The March Financial Forecast said:
The bullish response to the market’s decline is exactly what the Wave Principle suggests should occur at a trend reversal. Near the end of a second-wave rally in a bear market, Elliott Wave Principle by Frost and Prechter states that “investors are thoroughly convinced” that the bull market “is back to stay.” In the current case, most investors are convinced that the bull market never went away.
Since that analysis published, the DJIA’s Elliott wave pattern has provided our analysts with even more clues about the stock market’s next big move.
If you are prepared to take the next step in educating yourself about the basics of the Wave Principle — access the FREE Online Tutorial from Elliott Wave International.
The Elliott Wave Basic Tutorial is a 10-lesson comprehensive online course with the same content you’d receive in a formal training class — but you can learn at your own pace and review the material as many times as you like!
This article was syndicated by Elliott Wave International and was originally published under the headline What to Expect at a Critical Market Point: End of a Wave 2 Rally. EWI is the world’s largest market forecasting firm. Its staff of full-time analysts led by Chartered Market Technician Robert Prechter provides 24-hour-a-day market analysis to institutional and private investors around the world.
Global Forex and CFD trading company TradeFred is pleased to announce a partnership with brokerage technology provider Leverate, to enhance its customer service and marketing capabilities.
Established in 2016, TradeFred is licensed by multiple regulators, the Cyprus Securities and Exchange Commission (CySEC) and the Australian Securities and Investments Commission (ASIC). The company is backed by Betfred, the world’s largest independent recreational gaming company. Founded in 1967, Betfred has become synonymous with innovation and customer service – a reputation that owner Fred Done sought to transfer to the Forex market as a director of TradeFred.
The partnership will see TradeFred incorporate Leverate’s multifaceted trading platform that is designed to deliver enhanced conversion and retention figures. The broker will also utilise the marketing automation and business intelligence tool, Optim8, which offers in-depth and comprehensive reporting and analysis capabilities on all aspects of the brokerage – from performance to user behaviour. Optim8 also enables smart segmentation of customers to improve clients’ journeys and brokers’ success.
Chen Ben Nun, Leverate’s Head of Sales and Business Development, said: “The combined implementation of Activ8 and Optim8 will enable TradeFred to grow its operation in Forex in the same successful manner in which Betfred has been able to grow its gaming operations.”
TradeFred’s founder, Alex Mishiev, explained: “As a company that is dedicated to provide a service our clients can trust, it was essential for us to implement a smart marketing system that could be relied upon and tailored to suit their needs. In addition, our commitment to innovation means we want to position ourselves at the forefront of technological advancements. TradeFred already operates award-winning systems such as the MT4 trading platform, so naturally we wanted to do the same when it came to our marketing capabilities. By deploying the Optim8 and Activ8 suite, we can not only cement our place as fast-adopters of the latest developments, but also deliver on our promise to create a client-centric environment for our traders.
“With constantly-evolving regulatory requirements forcing the industry to become more equal, it was essential to devise a solution that set us apart. The decision to partner with Leverate, a company that has built a reputation as a pioneer leading the charge towards technical innovation, was therefore an easy one. The Optim8 and Activ8 suite represents a solution that is able to address the entire client life time cycle. It’s holistic in its approach and should therefore achieve the results that we’re seeking.”
It’s the modern gold rush. Around the world, the most sought-after mineral isn’t a precious metal, nor is it oil and gas…it’s lithium.
Lithium, or “white petroleum” as some call it, has become a crucial element in today’s high-tech economy.
Demand for lithium is soaring, and producers are frantically searching for new sources of supply. Prices have doubled in the last two years, rising as high as $16,500 per ton.
The biggest reason for the surge? The immense demand for lithium-ion batteries, needed to power electric vehicles (EV), cell phone and wind turbines.
As the Wall Street Journal reported, the surge in demand has pushed lithium miners to new areas in search of rich deposits.
Traditional production of lithium and lithium-ion batteries is concentrated in a few key areas, but with demand set to increase dramatically in the coming years, investors are searching for creative new ways to increase global supply.
A boom in Canadian lithium mining is pushing companies like Nemaska Lithium (TSX: NMX) and Power Metals Corp. (TSXV: PWM.V) to tap new deposits of lithium.
The fact that China is trying to corner the market has made the search for new deposits even more intense, as U.S. and European firms try to get around Chinese domination.
For the last five years, the commodities world has focused on the epic showdown between OPEC and U.S. shale drillers for oil market share. But it’s the war over “white petroleum” that will dominate the next decade.
Cornering the Market
In January, Zion Market Research projected lithium-ion battery sales to grow at an annualized rate of 13.7 percent, rising to $67.6 billion by 2022.
Lithium prices have risen stupendously in the last three years—from $6,500 per ton in 2015 to more than $20,000 in 2018.
China, which produces most of the world’s lithium batteries, has moved aggressively to secure steady supply. Chinese companies now own major shares in many South American lithium mines, where the bulk of the world’s lithium is produced, in order to feed Chinese battery factories.
China anticipates demand for lithium batteries to soar in coming years—mostly because they believe demand for electric vehicles (EVs) will exceed demand for gas-powered cars by 2030.
But the Chinese may be in for a surprise, as new mining companies secure deposits of lithium outside of South America.
Going Around the Chinese Wall
The Chinese may be investing heavily in South American lithium production in order to corner the market, but European and North American firms are side-stepping the Chinese autarchy to secure supplies of their own.
Europe uses 25 percent of the world’s lithium, while European auto-makers are anticipating a surge in EV production as the continent shifts away from gasoline-powered cars.
European investors are searching out lithium deposits in Germany and the Czech Republic. Meanwhile, drillers are mapping out underground lithium deposits in the UK, Portugal and Sweden.
In North America, miners are exploring for untapped lithium deposits that could rival the big finds in South America. Canadian miner Quantum Minerals Corp. (TSX-V: QMC) has expanded its Lithium Mine Project in Manitoba by 100 percent.
Another Canadian outfit, Nemaska Lithium Inc. (TSX: NMX) is hoping to exceed its current rate of production (16,000 tons) by 20 percent this year. The probable reserve of its property in Quebec is estimated at 24 million tons, which means it should have no problem reaching its production goals.
Nemaska has been a big winner on the lithium market: it rode its discoveries at their Whabouchi property in Canada to a $1.9 billion valuation.
Power Metals Corp, a hard-rock lithium driller is sitting on a deposit that could be worth billions. Rather than mine lithium through evaporation, which is very time-consuming, Power Metals uses drilling to tap into deposits of lithium spodumene trapped within the rock.
Canada could become a key source of lithium—which is good news for North American industry that may be losing access to Chinese lithium batteries.
That means that lithium miners will see a bigger market for their products—and a surge of investment into North American mining, which has the lowest risk factor in the world.
China may be cornering the market on South American lithium in order to feed its battery factories and churn out electric cars, but protectionist policies by the U.S. and aggressive expansion into European lithium production may cut the Chinese out of the global battery market.
Booming demand for lithium could be fed by the lithium mines of Canada—turning junior miners into major players virtually overnight.
Power Metals has announced a 15000m drilling program for 2018. “The explorational upside is immense,” according to Dr. Julie Selway, the company’s hard-rock lithium expert, “and each drill target can substantially increase the overall resource size.”
Canadian lithium deposit, according to Selway, represent a “sleeping giant:” once tapped, it could provide enough lithium to satisfy North American demand.
Just as the world of oil has seen intense competition between OPEC and U.S. shale, the lithium world may be defined by its own war: China vs. Everyone Else.
In this new gold rush, it pays to be prepared for anything.
Other companies transforming the lithium the space:
FMC Corp. (NYSE:FMC) founded in 1883, FMC has been around the block and back. FMC has a long history stretching between many different industries, but within all of them, FMC has remained a leader in innovation.
FMC’s involvement in the lithium industry is particularly notable. The company is one of the top three in lithium and associated technologies. It is one of the largest suppliers into electric vehicle applications using lithium hydroxide.
Strong growth in lithium is expected to drive margins for FMC and major expansion, leading analysts to give it an outperform rating. The company’s full year 2016 results were impressive, with lithium segment earnings of $21 million—up an amazing 90 percent from Q4 2015.
Magna International (TSX:MG) (NYSE:MGA) is based in Aurora, Ontario. The global automotive supplier is gutsy and innovative–and definitely tuned to the obvious future–clean transportation. A great catalyst is its development of a combo electric/hydrogen vehicle–a fuel cell range-extended EV (FCREEV). It’s not going to produce them (for now, at least) but plans to use the model to show off its engineering and design prowess and produce elements of the electric drivetrain and contract manufacturing.
The company’s auto parts are distributed to heavyweights such as General Motors, Ford, Tesla, BMW, Toyota, Volkswagen and Chrysler. These huge deals provide a safe and steady profit stream for the company. It’s insightful, forward-thinking and smart value/low cost for shareholders.
Tesla Motors Inc. (NASDAQ:TSLA): No large cap company has dazzled over the past couple of years like Tesla, which overtook giant GM this year in market cap—a major, unexpected feat. Tesla is the future, and its stock price agrees.
Tesla’s electric cars will eventually be more profitable than traditional cars, and easier to produce. Costs will keep coming down, especially now that Tesla’s has launched its battery gigafactory in Nevada, and when it gets battery (and lithium) prices down.
It is entirely feasible that Tesla will be selling over 2 million cars annually in less 6-7 years from now.
General Motors (NYSE:GM) is a household name. GM was born at the turn of the 20thcentury and has been a leading innovator in the automotive industry ever since. Even though it’s been surpassed in market cap by Tesla (of all companies), it is still the furthest ahead of the Big 3 car makers from Detroit in terms of EVs and self-driving cars.
Recently, GM acquired Cruise Automation—a self-driving car company, and it seems determined to forge ahead even faster to play catch-up with the future. Additionally, GM is a leader in the booming electric vehicle market. As countries across the world begin to pass regulations on combustion engines, GM stands to gain significantly as an early adopter in the EV game.
Alphabet (NASDAQ:GOOG): With a market cap of over $657 billion, this is the second-largest by market capitalization in the S&P 500. We love Alphabet because its foundation is intellectual property—not tangible assets.
Oh, and self-driving cars … definitely a huge part of the innovation in energy and artificial intelligence. As an early entry into the self-driving car world, Alphabet’s innovations have paved the way for a transportation revolution
Alphabet is set to continue to bring value to its investors and even as one of the largest companies in the S&P 500, Google’s parent company continues to reach new heights.
By James Stafford – OilPrice.com
NOT AN INVESTMENT ADVISOR. Oilprice.com is not registered or licensed by any governing body in any jurisdiction to give investing advice or provide investment recommendation. ALWAYS DO YOUR OWN RESEARCH and consult with a licensed investment professional before making an investment. This communication should not be used as a basis for making any investment.
RISK OF INVESTING. Investing is inherently risky. While a potential for rewards exists, by investing, you are putting yourself at risk. You must be aware of the risks and be willing to accept them in order to invest in any type of security. Don’t trade with money you can’t afford to lose. This is neither a solicitation nor an offer to Buy/Sell securities.
RISK OF BIAS. We often own shares in the companies we feature. For those reasons, please be aware that we are extremely bias in regards to the companies we write about and feature in our newsletter and on our website.
EURUSD has returned to 1.2240 and right now is still moving downwards. Possibly, today the price may break 1.2180. The short-term target is at 1.1970.
GBPUSD, “Great Britain Pound vs US Dollar”
GBPUSD has returned to 1.4000. Today, the price may fall to break 1.3920. The short-term target is at 1.3720.
USDCHF, “US Dollar vs Swiss Franc”
USDCHF is still moving upwards. Possibly, the price may reach 0.9860 and then start another consolidation range. After that, the instrument may break this range to the upside and then grow to reach 0.9898.
USDJPY, “US Dollar vs Japanese Yen”
USDJPY continues growing. Possibly, today the price may break 109.18. The target is at 109.87. Later, the market may start another consolidation range near the highs.
AUDUSD, “Australian Dollar vs US Dollar”
AUDUSD continues falling with the short-term target at 0.7570. After that, the instrument may form another consolidation range near the lows. If later the instrument breaks this range to the downside, the market may continue trading to the downside to reach 0.7420; if to the upside – start another correction towards 0.7777.
USDRUB, “US Dollar vs Russian Ruble”
USDRUB is still consolidating and moving towards 61.17. If later the instrument breaks this range to the downside, the market may continue trading to the downside to reach 58.15; if to the upside – start another correction towards 63.00.
XAUUSD, “Gold vs US Dollar”
Gold has returned to 1331.00 downwards. Today, the price may continue trading to the downside to reach the short-term target at 1308.00.
BRENT
Brent is forming another descending impulse towards 72.85. Later, the market may grow to reach 74.00, thus forming another consolidation range. If later the instrument breaks this range to the downside, the market may start another correction to reach 71.00; if to the upside – resume growing towards 75.90.
Attention! Forecasts presented in this section only reflect the author’s private opinion and should not be considered as guidance for trading. RoboForex LP bears no responsibility for trading results based on trading recommendations described in these analytical reviews.
Current market activity indicates that cryptocurrencies are set for “another considerable surge in prices gains” in the near future and Ethereum’s price could reach $2,500 by the end of the year – but investors should exercise caution.
This forecast from Nigel Green, the founder and CEO of deVere Group, one of the world’s largest independent financial services organizations, comes after a strong few days in the cryptocurrency markets.
Mr Green, whose firm launched the cryptocurrency exchange app, deVere Crypto, comments: “Most major cryptocurrencies have been posting big gains over the last few days.
“Current market activity indicates that the major cryptocurrencies are set for another considerable surge in prices gains in the near future.”
He continues: “What’s fuelling this current rally in crypto prices? There are several key motivators.
“These include the growing integration with and adoption by major banks and other financial institutions.
“Indeed, 20 per cent of all financial firms, ranging from hedge funds to banking giants, are now considering trading digital currencies in the 12 months, according to a new Thomson Reuters survey published this week.
“Another key reason for the rally is that there’s a growing awareness of the need and demand for digital, global currencies in a digitalized, globalized world.
“The upward trend is also being triggered by regulation, which most experts now believe is inevitable. This will give investors even more protection and long-term confidence in the market.”
The deVere CEO believes that despite Bitcoin taking the headlines, Ethereum could be the real story here.
He notes: “It’s interesting to note that even with an impressive one-week jump of 11.3 per cent, Bitcoin – the world’s largest by market capitalization – is the worst performer amongst the biggest cryptocurrencies.
“The price of Ethereum is predicted to increase significantly this year, and could hit $2,500 by the end of 2018 with a further increase by 2019 and 2020.
“This general upswing will be fuelled by three mains drivers. First, more and more platforms are using Ethereum as a means of trading. Second, the increased use of smart contracts by Ethereum. And third, the decentralisation of cloud computing.”
Mr Green goes on to say: “Ethereum can be expected to solidify its position as the second most valuable and used cryptocurrency token in the world. This consistency of the Ethereum token will appreciate well into the future. As entrepreneurs, venture capitalists, bankers and financial houses are looking for stability and safer trading conditions, and Ethereum is offering that security.”
Mr Green concludes: “We’re certainly entering crypto bull territory, with many retail and institutional investors now finding that cryptocurrencies can no longer ignore the opportunities.
“However, cryptocurrency markets remain volatile. Caution should be exercised and professional advice sought.”
deVere Group is one of the world’s largest independent advisors of specialist global financial solutions to international, local mass affluent, and high-net-worth clients. It has a network of more than 70 offices across the world, over 80,000 clients and $12bn under advisement.
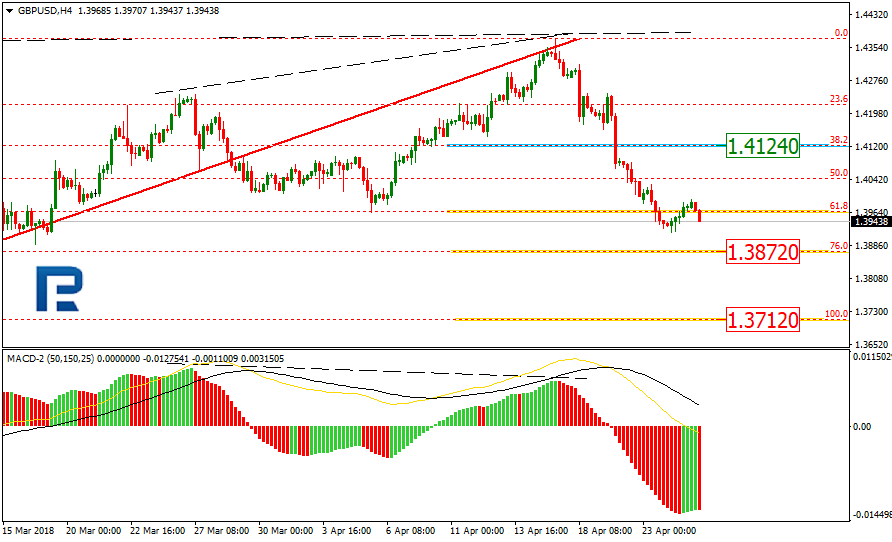
As we can see in the H4 chart, the divergence made GBPUSD reverse and start a new descending movement, which has already reached the retracement of 61.8%. The next downside targets may be the retracements of 76.0% at 1.3872 and the level of 1.3712. The resistance level is at 1.4124.
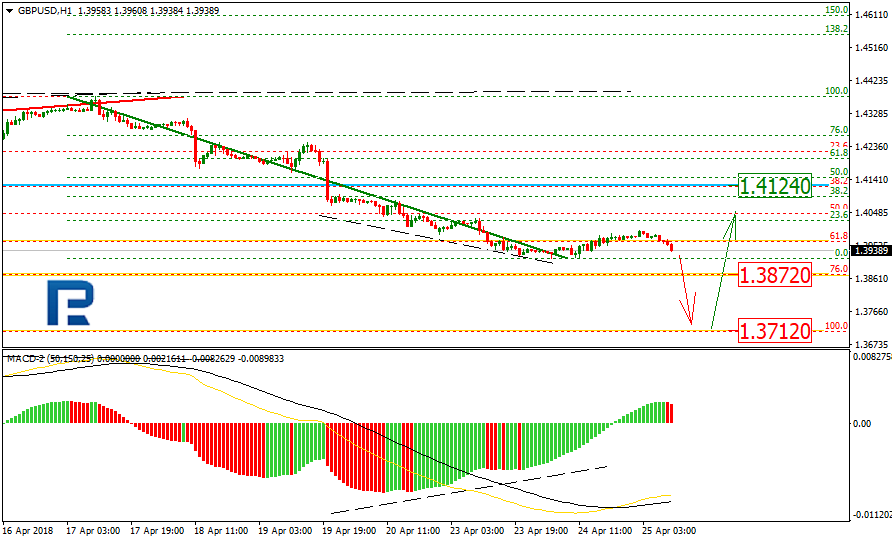
In the H1 chart, the pair is falling towards 1.3872 and has already been corrected by 23.6%. After the convergence, the instrument may reverse and start a new correction towards the current resistance area.
EURJPY, “Euro vs. Japanese Yen”
As we can see in the H4 chart, EURJPY has already reached the retracement of 50.0%. The next upside target may be the retracement of 61.8% at 134.24. At the same time, one can see the divergence being formed. The support level is at 132.21.
In the H1 chart, the short-term divergence that is being formed may indicate a possible pullback to the downside to reach the retracements of 23.6%, 38.2%, and 50.0% at 132.42, 131.75, and 131.22 respectively.
Attention! Forecasts presented in this section only reflect the author’s private opinion and should not be considered as guidance for trading. RoboForex LP bears no responsibility for trading results based on trading recommendations described in these analytical reviews.
On Tuesday the 24th of April, trading on the euro closed up, breaking its 3-day losing streak. The main factor behind the euro’s rise was the US dollar’s universal decline. As the market underwent a technical correction, participants ignored the positive US housing and consumer confidence data. The euro then corrected to the 45th degree at 1.2245.
The dollar’s correction may have been triggered by the failure of US10Y bond yields to gain a foothold above 3%. This level was tested today in Asia and there’s a risk of going up to 3.018%.
After the release of weak German data, the euro recovered to the 45th degree at 1.2245. In Asia, the dollar is trading up against all the majors. The dynamics on the euro crosses are mixed. Today’s economic calendar is fairly empty. For these reasons, today I expect to see a drop along the trend line to the 45thdegree at 1.2190. If US10Y bond yields break 3%, we could hit a new low.
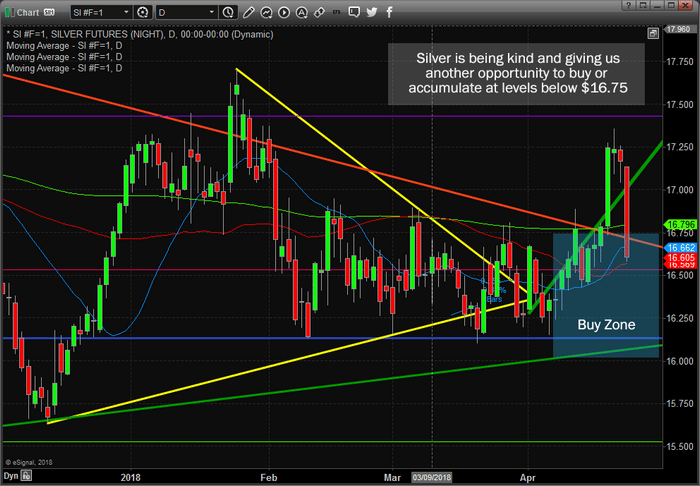
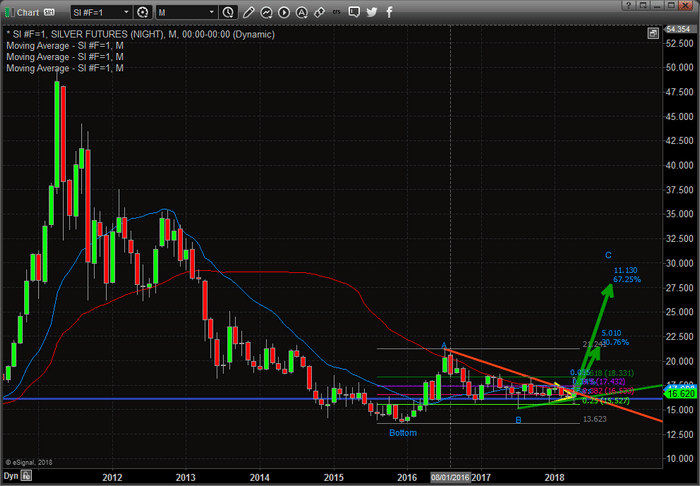
Our recent silver analysis could not have been more accurate. Please take a minute to read it before you continue reading the rest of this post if you have not already done so. The Silver price breakout, to near $17.20, last week was incredible. It established a new Fibonacci price trend, established a downward channel price breakout, coincided with a Pennant/Flag price formation breakout and the wave count of this Pennant Flag breakout was perfect.
Our research indicated that after this $17.20 price breakout happened last week, any retracement below $16.75 while price held above support near $16.00 would constitute a “BUY ZONE” where traders could begin accumulating physical metal or equity shares. The move lower today in Silver, which is related to the US Dollar and Bond yields move today, may be an absolute gift for metals traders. We mean this could be a “fire sale” type of gift if prices continue to stagnate below $16.50 for a few days.
As much as I would like to tell you that Silver is rocketing higher as we predicted, we have to learn to play these price rotations to our advantage – especially when the markets are handing you opportunities like this. Again, $16.00 is our support level currently. Anything below $16.75 and above $16.00 is our BUY ZONE. We are waiting to see how the market this week before we make a decision on accumulation, but this looks like an excellent opportunity to consider adding to our existing positions/physical holdings if one has the opportunity. Remember, the upside potential of this move could be as much as 25~70%.
If you want to know how to take advantage of these moves and stay ahead of the markets, then visit our website to learn how we help our valued subscribers find and execute success every month. These types of tools are only one component of what we offer our members – we also offer Daily video analysis of the market, advanced research posts, Daily updates and more. We know we are the only research team that can offer you these types of advanced predictive modeling systems. If you have ever wanted to know what the markets are going to do with relative certainty, join us today.
Our articles, Technical Trading Mastery book, and 3 Hour Trading Video Course are designed for both traders and investors to explore the tools and techniques that discretionary and algorithmic traders need to profit in today’s competitive markets. Created with the serious trader and investor in mind – whether beginner or professional – our approach will put you on the path to win with our stock and ETF trading signals. Understanding market structure, trend identification, cycle analysis, volatility, volume, when and when to trade, position management, and how to put it all together so that you have a winning edge. Visit: www.TheTechnicalTraders.com
Since the 1980s, a new generation of chaos capitalists have been undermining the progress of emerging economies. Under the pretext of “efficient markets,” they seek to exploit real or perceived weaknesses.
Recently, hedge funder Jim Chanos appeared on CNNMoney’s Markets Now program that was promoted heavily on the CNN: “Chanos got China right.”
Amid the global crisis, Chanos predicted that China would collapse.Nevertheless, CNN characterized his 2009 call as “brilliant.”
The question is, why?
Interplay of shorting and media
Like CNN, most international media portrays Chanos as a “financial wizard” who has made made fortunes from shorting companies ever since 2001 when he targeted the US energy company Enron that he predicted would fall before it filed for bankruptcy.
In fall 2009, Chanos predicted China would head the way of the “old Soviet Union”. In January 2010, the New York Times reported Chanos’s prediction that China’s economic crash would resemble “Dubai times 1,000 — or worse.” Few months later, Chanos said on the PBC Charlie Rose Show China was on a “treadmill to hell.”
Chanos likes to cultivate financial ploys with dominant media. In the early 1980s, when his target was the insurance firm Baldwin-United, he “guided” Forbes writer Dick Stern through his analysis. In the mid-80s, Wall Street Journal accused short-sellers like him of spreading rumors and impersonating a Journal reported to access to insider information. With Enron in 2001, Chanos fed Fortune’s Bethany McLean, who prospered from a book deal, as did Joe Nocera, another high-profile business reporter (who also has been dogged by claims of “conflict of interest”). In the process, Chanos, along with other hedgefunders like Steve Cohen and Daniel Loeb, were sued for paying negative stock-research reports that helped drive down stock prices.
After Chanos made his China prediction, David Barboza of New York Times, following in the footprints of CNBC and Politico.com, reported that “contrarian investor sees economic crash in China.” As these stories failed to create a backlash against China, Fortune, among others, released a story about “Chanos vs China,” in which the hedgefunder said that China was a huge real estate bubble.
As China’s progress prevailed, Chanos began a new round in 2015, when Joe Nocera of the New York Times, again, released a major report about “The Man Who Got China Right.” Now China’s fall was sold as a commodity bubble. “You dismiss [skeptics and contrarians] at your peril,” Nocera warned. While the story did not prove true, it contributed to the tripling of Chanos’s fund to $3 billion in half a decade.
But as China’s growth stil prevailed, Chanos began his most recent media round, this time with CNN where he declared: “Nobody ever makes any money in China,” although droves of US subsidiaries have thrived in China, from Apple and Boeing to GM. Chanos also warned countries in Africa and South America as well as Australia that relied on Chinese commodity demand and dismissed the success of Chinese firms, such as Tencent and Alibaba, as “accounting” and “corporate” frauds.
Assessing the economic realities
That’s the Chanos game – well-timed interviews, shorting of companies and nations, and collusion with dominant international media. But what about its truth value?
During the Great Depression, US living standards declined by almost 30 percent in four years. But that was not Chanos’s yardstick. Instead, he made an explicit comparison with the collapse of the Soviet Union, which caused the Russian GDP to decline by 45 percent in the ‘90s. In reality, between 2008 and 2018, the Chinese economy will triple to $13.1 trillion. Meanwhile, foreign multinationals operating in China have reaped great profits, along with investors.
Chanos’s prediction, based on the collapse of the Soviet economy, would have meant the plunge of Chinese GDP from $4.6 trillion in 2008 to $2.1 trillion today. In other words, Chanos’s projection of the Chinese economy proved to be almost 700 percent smaller than the actual reality (Figure).
FigureHow Chanos Got China Wrong: China’s GDP, 2008-18
CNN prides itself as the “world’s most trusted name in news.” So to claim that “Chanos got China right” would seem to be grossly disproportionate and as if the global news hubswould allow itself to be played by private financial interests.
Exploiting private capital to destabilize emerging economies
Historically, these financial plays may have intensified since the 1980s, when George Soros made early fortunes starting with the destabilization of Chile and commodity markets, shorting the British pound in 1992, and currency plays amid the Asian financial crisis in late ‘90s. What’s less known are the economic consequences of his “philanthropy” in world regions where destabilization has caused massive dislocations in geopolitics but fortunes to his fund.
More recent examples include hedge funds, such as NML Capital, a subsidiary of Elliott Management, a hedge fund co-led by Paul Singer, as well as Aurelius Capital and Dart Management. In late 2001, Argentina defaulted on $132 billion in loans during a disastrous depression. While 93 percent of creditors accepted discounted bonds, a small minority – US hedge funds – didn’t, even though they had bought many of their bonds at a huge discount after Argentina had defaulted. Thanks to a 2012 ruling by a New York court, Argentina was pressed to a $2.3 billion settlement, which meant a return of 1,180 percent to Singer’s NML.
While the chaos capitalists’ methods differ – Chanos likes to short his victims, Soros prefers arbitrage to paralyze his targets, Singer likes to buy up sovereign bonds on the cheap and go after countries for unpaid debts – they use private capital to enrich themselves at the expense of sovereign nations, while lobbying in Washington and political donations to make and break US administrations, mayors and governors.
In addition to liable companies, chaos capitalists target increasingly vulnerable economies. Soros’s Open Society initiatives are in Eastern Europe and emerging Asia in which “color revolutions” promote financial ploys. Starting with Peruvian debt in 1996, Singer has gone after Argentina, the Republic of Congo, and gives sizable donations to anti-Iran groups. All see great opportunities in a destabilized Russia.
Since 2015, Chanos has focused on “frontier markets,” particularly Nigeria and South Africa in sub-Saharan Africa. He manufactures perceived liabilities with media. In such “short-and-distort” campaigns, the manipulator shorts the stock or the country and then spreads misleading of false negative information to drive the price down, leading to a huge profit when the investor eventually closes the short position.
When dominant international media collude with chaos capitalists, emerging economies face real threats as the financial few are allowed to enrich themselves by impoverishing entire poor nations.
About the Author:
Dr Dan Steinbock is an internationally recognized strategist of the multipolar world.and the founder of Difference Group. He has served at the India, China and America Institute (USA) , the Shanghai Institutes for International Studies (China) and the EU Center (Singapore). For more, see http://www.differencegroup.net/
The original version was released by China Daily on April 23, 2018
Here is a short summary and this week’s links (below) to the latest Commitment of Traders changes that was released on Friday. Have a wonderful weekend.
US Dollar net speculator positions leveled at $-23.42 billion as of Tuesday
The latest data for the weekly Commitment of Traders (COT) report, released by the Commodity Futures Trading Commission (CFTC) on Friday, showed that large traders and currency speculators increased their aggregate bearish bets for the US dollar this week. Meanwhile, in the individual currency contracts this week, speculators pushed their bullish bets to a new record high level. See full article
The non-commercial contracts of WTI crude futures totaled a net position of 728,131 contracts, according to data from this week. This was a lift of 21,051 contracts from the previous weekly total. See full article
The large speculator contracts of gold futures totaled a net position of 163,069 contracts. This was a weekly advance of 7,697 contracts from the previous week. See full article
The large speculator contracts of 10-year treasury note futures totaled a net position of -371,689 contracts. This was a weekly reduction of -41,054 contracts from the previous week. See full article
The non-commercial contracts of silver futures totaled a net position of -87 contracts, according to data from this week. This was a weekly gain of 14,746 contracts from the previous totals. See full article
The large speculator contracts of copper futures totaled a net position of 23,706 contracts. This was a weekly boost of 2,796 contracts from the data of the previous week. See full article
The Commitment of Traders report data is published in raw form every Friday by the Commodity Futures Trading Commission (CFTC) and shows the futures positions of market participants as of the previous Tuesday (data is reported 3 days behind).