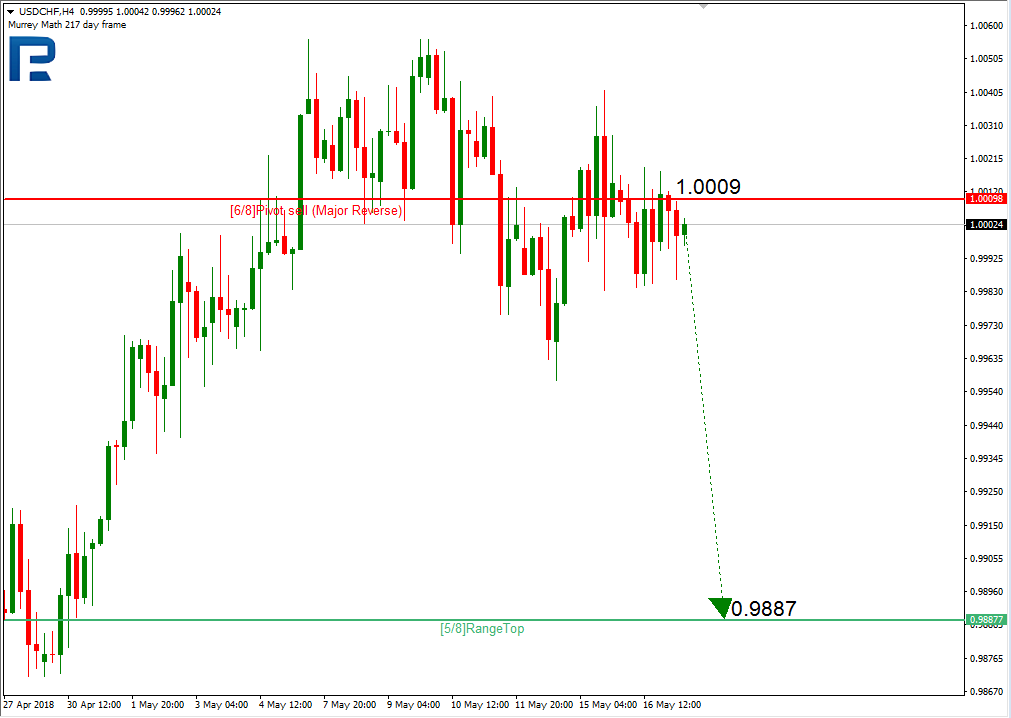
As we can see in the H4 chart, USDCHF is expected to test the support at the 5/8 level.
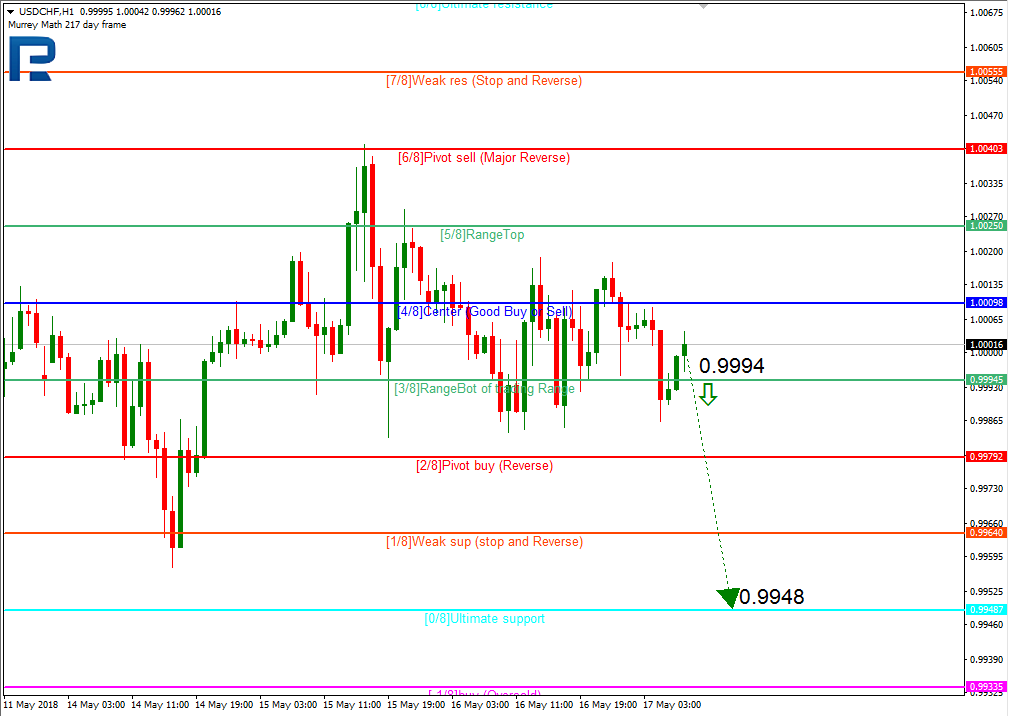
As we can see in the H1 chart, the price is consolidating between the 3/8 and 5/8 levels. If later the pair breaks the 3/8 level, the instrument may resume falling to reach the support at the 0/8 one.
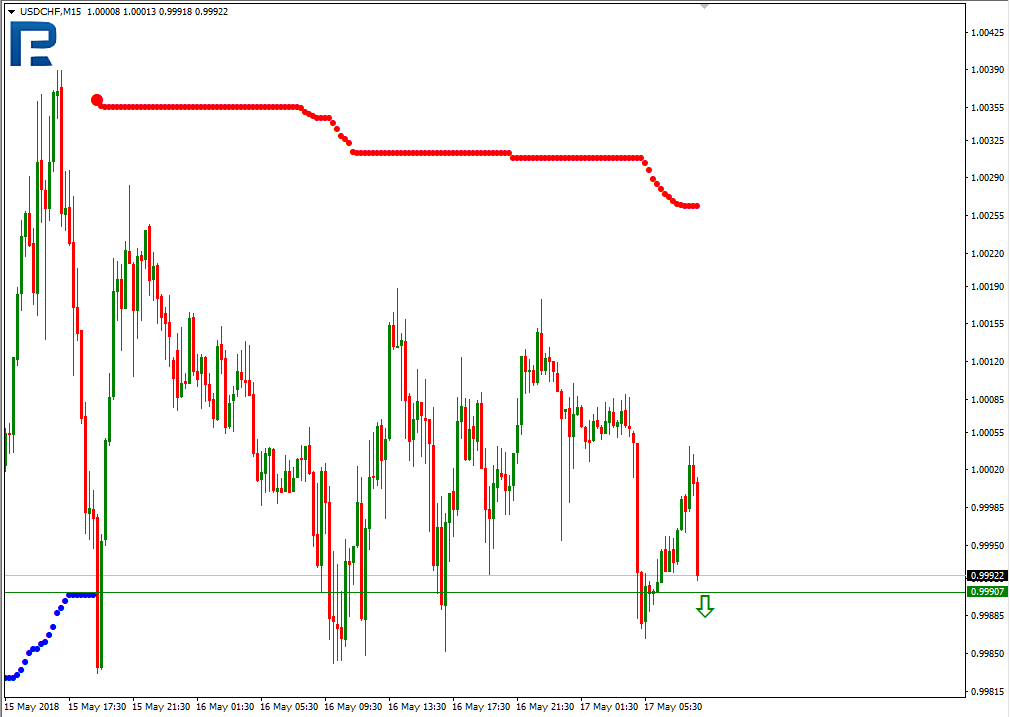
In the M15 chart, the pair may break the downside line of the VoltyChannel indicator and, as a result, continue moving downwards.
XAUUSD, “Gold vs US Dollar”
In the H4 chart, XAUUSD may break the 3/8 level and then move upwards to reach the resistance at the 4/8 one.
As we can see in the H1 chart, the price has rebounded from the 5/8 level and may resume growing to reach the resistance at the 7/8 one.
In the M15 chart, the pair may break the upside line of the VoltyChannel indicator and, as a result, continue moving upwards.
Attention! Forecasts presented in this section only reflect the author’s private opinion and should not be considered as guidance for trading. RoboForex LP bears no responsibility for trading results based on trading recommendations described in these analytical reviews.
Geopolitics has taken over the oil market, driving oil prices up to three-year highs. The inventory surplus has vanished, and more outages could push oil prices up even higher. Yet, there are some signs that demand is starting to take a hit as oil closes in on $80 per barrel.
In the IEA’s May Oil Market Report, the agency said that OPEC might be needed to step in and fill the supply gap if a significant portion of Iran oil goes offline. Saudi Arabia suggested shortly after the U.S. announced its withdrawal from the Iran nuclear deal that OPEC would act to mitigate any supply shortfall should it occur.
But while geopolitical fears helped push Brent up to $79 per barrel in recent days, the underlying fundamentals are also mostly bullish.
Venezuela’s production is plummeting, and output is 550,000 bpd below it’s agreed upon target as part of the OPEC deal. Conservative estimates suggest that the country could lose several hundred thousand barrels per day over the course of 2018, but there are several massive threats to PDVSA’s operations that could make that forecast look optimistic.
ConocoPhillips continues aggressive action to obtain control of PDVSA’s assets after an international arbitration court awarded it $2 billion in awards.
There is a great deal of confusion about what Conoco’s actions mean for Venezuela’s oil production, but the asset seizures could be pivotal. Reuters reports that the American oil major is now trying to seize two cargoes of crude and fuel near a terminal in Aruba run by Citgo, a subsidiary of PDVSA. The cargoes are holding 500,000 barrels of oil and 300,000 bpd of jet fuel, gasoline and diesel.
On top of that, Venezuela is set to hold a presidential election on May 20, an event that could be met with more painful U.S. sanctions. Conoco’s actions, combined with a crackdown by the U.S. Treasury, could send Venezuela’s oil production deeper into a death spiral.
The big question is if supply will be lost in Iran, which, coupled with the supply losses in Venezuela, could severely tighten the oil market. “The potential double supply shortfall represented by Iran and Venezuela could present a major challenge for producers to fend off sharp price rises and fill the gap, not just in terms of the number of barrels but also in terms of oil quality,” the IEA wrote in its report.
OECD crude inventories fell in March by 27 million barrels, putting total stocks at a three-year low and, crucially, 1 million barrels below the five-year average. That data point is worth emphasizing: OPEC has claimed for more than a year that it was trying to erase the inventory surplus, and at least according to IEA data, that mission has now been accomplished.
Still, the group may not be ready to take their foot off of the accelerator. They meet in a few weeks in Vienna to figure out their next steps. But with inventories now back at average levels, there is some upward pressure on oil prices, particularly with more outages looming in 2018.
However, the cure for higher oil prices tends to be higher oil prices. The IEA lowered its demand forecast for 2018 by 40,000 bpd – not a massive revision, but notable because it offers some signs that demand will slow as prices rise. Some other reports back up this notion.
There are reportedly spot cargoes for oil from West Africa, Russia and Kazakhstan that are going unsold, forcing steep discounts. “While recent data continue to point to very strong demand in 1Q18 and the start of 2Q18, we expect a slowdown in growth in 2H18.” Up until now, demand growth looked strong, but “the recent jump in oil prices will take its toll.”
“On balance, the report is tending more to the negative side. Demand for oil has been revised downwards for the second half of the year from April,” PVM Oil Associates strategist Tamas Varga told Reuters.
The IEA noted that the global economy is still “doing well,” and that “underlying demand growth remains strong around the world.” That suggests demand won’t suddenly fall off of a cliff. “Still, the fact is that crude oil prices have risen by nearly 75% since June 2017,” the agency cautioned. “It would be extraordinary if such a large jump did not affect demand growth, especially as end-user subsidies have been reduced or cut in several emerging economies in recent years.”
We can’t believe how so many people did not see this upside price swing setting up over the past few weeks. The research we conducted over the past few months was showing us a very clear picture that the US markets would advance in a dramatic format after settling a price bottom after the early February price drop. We would like to remind our readers to reference this link to see how we called this move months (published January 19, 2018) in advance. To quote our earlier work before the markets made all these moves…
“Somewhere near or after February 19th, we expect the NQ price to break to the upside with another 3~5% rally (again, another 350+ pt swing) that should end near March 15th and begin a dramatic downward price move. The ending prediction of the ADL system for April 23, 2018 is $6846.25 – pretty much exactly where we are at right now. “
When you consider the fact that we were making and publicly publishing these predictions about what price would do many weeks in advance and somewhat accurately predicting many of these price swings, one has to ask “just how powerful are these adaptive price modeling systems and what advantage can that provide me?”.
Today, we are going to share some Weekly Adaptive Fibonacci price modeling that clearly illustrates we are in for a very exciting ride in the US markets.
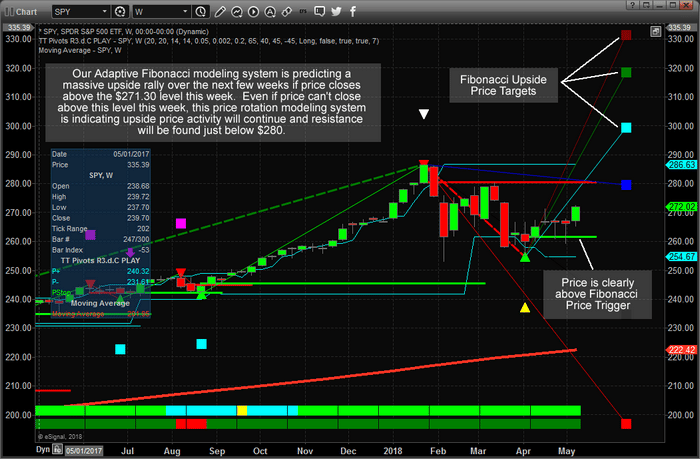
SP500 INDEX WEEKLY CHART – (SPY ETF)
This first chart of the SPY is showing us that the current price level is well above the Bullish Fibonacci Trigger level which indicates that current trend is to the upside. It also points to resistance being just below the $280 level. The current price level has already breached a previous price peak and if price advances further by the end of this week, we will consider this a confirmation of a new rotational price high which will further strengthen our opinion that price will push dramatically higher.
Please note the upside Fibonacci price targets because they indicate we could be in for a very dramatic and extended price rally from current levels. The first upside price target level is @ $299.45, the next higher level is @ $318.50 and this furthest target level is @ $331.40. These represent a +10% to +21% upside potential in the SPY. You better believe you won’t want to miss this move and you better be prepared to know how to trade it because we believe volatility is here to stay and nothing goes straight up. We currently have 5 open winning positions with three of them up over 10% already!
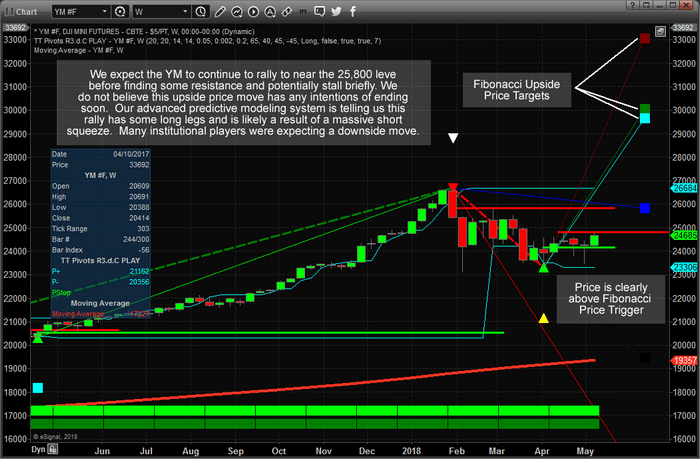
YM (DOW FUTURES) WEEKLY CHART
Taking that same analysis model and applying it to the YM (Dow Futures) Weekly chart presents an even more dramatic picture of the future price potential. The charts are fairly similar in structure, although where the SPY has already breached the most recent price peak levels, the YM has yet to accomplish this. This would be one thing we are still waiting for in terms of confirmation of the upside potential in the YM.
Yet, taking a look at the other data from this advance price modeling system, we have a very clear indication that a major price top has recently formed near the early February price peak. We can also see an intermediate price bottom has formed near April 2 – resulting in a new upside price rotation. Fibonacci price theory indicates that “price MUST attempt to establish a new price high or low at all times”. Therefore, the failure of the SPY and YM to break below the February 2, 2018 price lows indicates the markets were attempting to hammer our a bottom formation. The rotation of lower high price peaks while the February 2 ultimate low held was a very clear indication that we just needed to wait for the price rotation to establish a new high before we could call a formal end to this downside price swing.
That time is almost upon us as recent price rotation has established a new “higher” rotational price low (on April 30th) and the SPY & NQ have already breached these levels to the upside. Now, we are just waiting for the other US majors (ES & YM) to accomplish this price trigger and we will have confirmation that “price is telling us it wants to rocket higher.
Look at the upside range in the YM – incredible. The first Fibonacci target level is @ 29,683, the second one is @ 30,055 and the highest one is @ 33,058. Let me put that into perspective for you, these represent an upside potential of between +21% to +35% in the YM.
We are certain you are asking yourself “how in the world can this be possible? Everyone has been saying the markets are going to rollover and tank??” We are simply reporting what our modeling systems are telling us is the most likely outcome and we want to urge you to understand these predictive price targets could be months out into the future.
Additionally, new price rotation will create revised price targets as one of the key functions of Fibonacci price theory is that “price will always tell you where it wants to go” as long as you understand how to apply proper Fibonacci price theory.
The final component to all of this research is to ask yourself WHY the US markets would have the potential for +10% to +20% or more upside price moves if everyone thinks the US markets are going to rollover and start trending down? Could it be that so many people have concluded the wrong analysis? Could it be that something dramatic is about to unfold in the global markets that would make the US markets appear to be the “best and safest asset on the planet”? Could it be that we are setting up for a massive leg higher and nearly everyone on the planet has failed to see the upside potential?
Our members have access to much greater insight and analysis than we can share here publically. We reserve our most advanced price modeling systems, predictive analysis and research for our exclusive membership levels. We are warning you that a massive upside swing is about to setup and you’ll want to be prepared for it because this could be a true “once every ten years” type of move. We also urge you to consider joining www.TheTechnicalTraders.com as a member to receive all of our detailed updates, daily videos, trading signals and more. If you don’t believe we can assist you in your future with our research, analysis and other features and benefits, you can cancel your subscription and move onto something else. Either way, we urge you to be prepared for this next move higher and take a few minutes to read over our most recent public research posts.
Throughout this year, many analysts have focused on the price of Gold, Platinum & Silver markets for insight to the fear levels that exist in the global markets. Demand for Gold and Silver have been near historically high levels for the past 12+ months and the ratio of Gold to Silver has continued to show that Silver is extremely undervalued in relative value to Gold. We’ve highlighted these facts in previous articles to our readers.
The recent news regarding economic and political concerns regarding a wide range of Emerging Markets and established economies, we believe, has continued to drive upward price pressures in the precious metals markets. We feel the Metals & Miners are setting up a unique opportunity for patient and skilled traders/investors. Possibly, the opportunity of a lifetime if our analysis is correct.
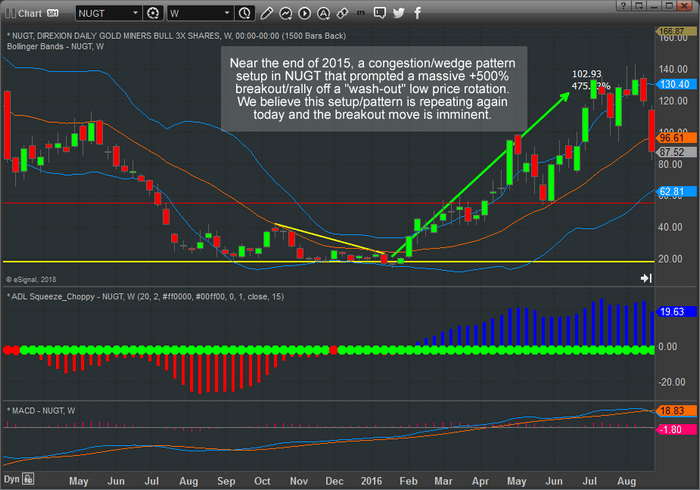
2015 GOLD MINERS – WEEKLY NUGT CHART PATTERN
Near the end of 2015, NUGT was setting up a congested wedge formation, that lasted 7 months, with clear support near $20. This pennant formation retested support over 6 times before a “wash-out low” price pattern formed as price attempted the eventual breakout. These types of “wash-out” patterns are common as price begins to accelerate into new trends.
Washout lows tend to flush out stops and positions from traders that have their stops too tight for the markets. In this manner, the market is rotating in a matter to reaffirm support before the new bullish trend extends. Notice how quickly price expanded in this uptrend and how price moved above the $30 level in just a week before continuing well above the $120 level. We are illustrating the explosive capabilities of a congestion trade setup like this – well over 500% from the $20 support level.
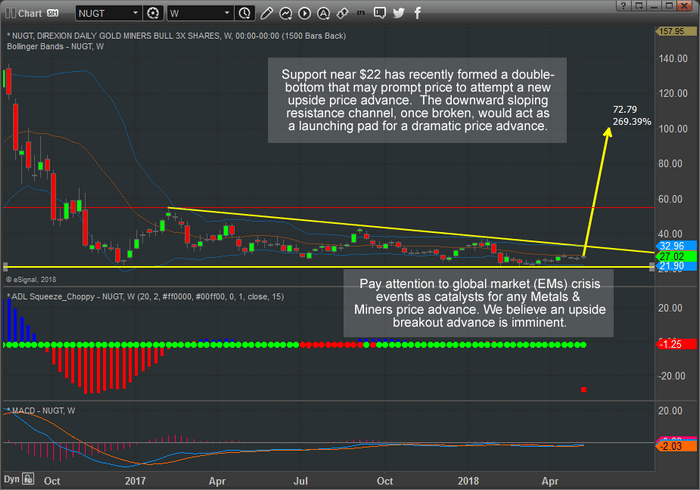
2018 GOLD MINERS – WEEKLY NUGT CHART PATTERN
Take a look at a current 2018 NUGT chart (below) and please pay very close attention to the similarities between these two charts. We can’t stress how important it is to understand the opportunity we are showing you today with regards to these patterns and the potential for traders to take advantage of this setup.
The current price pattern setting up in NUGT is another congested wedge formation with support near $22. This pattern has been setting up in the pennant formation for over 12+ months. Price initially rallied from the initial bottom formation (December 2016) and established a price peak @ $54.80 (highlighted in RED).
Afterward, the price has continued to rotate between support and the downward sloping resistance channel presenting traders with a very extended congestion pattern. What interests us the most about this current pattern is the length of the congested wedge pattern. We believe the upside pricing pressure that is being built up within this wedge could be 2x to 3x (or more) the pressure from the 2016 upside breakout. This would indicate that NUGT could rally well past the $100~140 level when this breaks – again a 500%+ price advance.
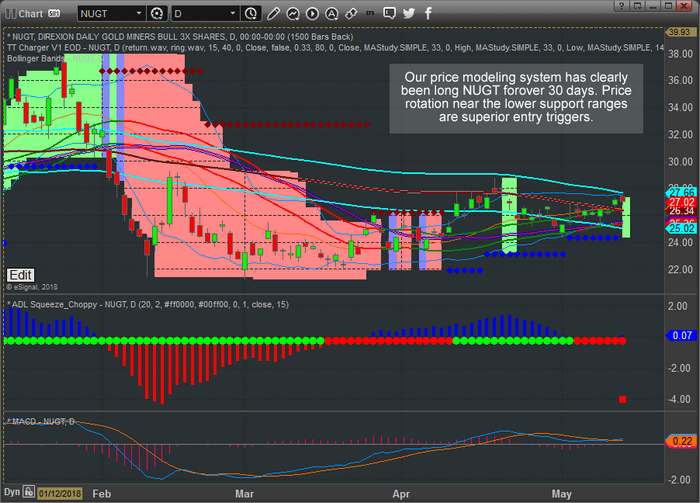
2018 GOLD MINERS – DAILY CHART PATTERN
This Daily NUGT chart shows one of our price modeling systems and shows it has clearly indicated a new bullish trend began on April 10. Lower price support is currently near $24 and ultimate support is near $22. You can see from this modeling system chart that any upside breakout above the CYAN Standard Deviation channel would be very positive within this bullish trend and likely prompt a further upside price rally.
Clearly, any chance at a new trade entry near or below $24.50 is acceptable with risk near $2 per share. Remember, if this breakout/rally happens as we expect, a “wash-out” price rotation may precede this move where stops need to be soft in nature. Support is near $22, but the “wash-out” price rotation may attempt to test price levels below $22 before the massive upside rally begins. So be aware that the smart play is to understand the risk of this trade and play it knowing a “wash-out” price rotation may happen as price breaks these channels.
It is not often that the markets provide traders with these types of setups. These are the type of trades that can make 400~500% or more on a single trade over 4~6 months. We focus on finding opportunities for our members and delivering success for them every month. Members to our Wealth Building Newsletter have already been alerted to this trade setup, and others and will know when a position should be initiated.
Our other recent trade alerts, that are up well over 10% each are UGAZ, FAS, and TECL. These have been rocketing higher – as we predicted. On Friday we closed our TECL position which hit our resistance level and we locked in the 18.3% gains with our members. The single point of success for all of us is to manage our assets well in an attempt to achieve greater long-term success.
If you’ve been following our research and analysis and find it valuable, please visit www.TheTechnicalTraders.com to support our research team and become a valued member. The markets are full of incredible opportunities like this and we focus on delivering critical market research, analysis, Daily video content, detailed trade triggers and continued support for our members. We know you will not find anything like our proprietary price modeling systems and adaptive predictive modeling systems anywhere else.
Our 53 years experience in researching and trading makes analyzing the complex and ever-changing financial markets a natural process. We have a simple and highly effective way to provide our customers with the most convenient, accurate, and timely market forecasts available today. Our stock and ETF trading alerts are readily available through our exclusive membership service via email and SMS text. Our newsletter, Technical Trading Mastery book, and 3 Hour Trading Video Course are designed for both traders and investors. Also, some of our strategies have been fully automated for the ultimate trading experience.
EURUSD is moving downwards. Possibly, today the price may reach 1.1812 and then grow towards 1.1875. Later, market may continue its decline with the target at 1.1760.
GBPUSD, “Great Britain Pound vs US Dollar”
GBPUSD is still consolidating around 1.3535. Today, the price may reach 1.3440 and then grow towards 1.3580, thus forming another consolidation range. If later the instrument breaks this range to the upside, the market may start another correction to reach 1.3750; if to the downside – resume falling inside the downtrend with the target at 1.3355.
USDCHF, “US Dollar vs Swiss Franc”
USDCHF is still consolidating. If the instrument breaks this range to the downside, the market may start another correction to reach 0.9850; if to the upside – resume growing with the target at 1.0110.
USDJPY, “US Dollar vs Japanese Yen”
USDJPY has broken 110.00 upwards and continues extending this structure. Possibly, today the price may fall to test 110.00 from above and then grow to reach 110.66. After that, the instrument may start another decline to return to 110.00 and then resume growing to reach 111.11.
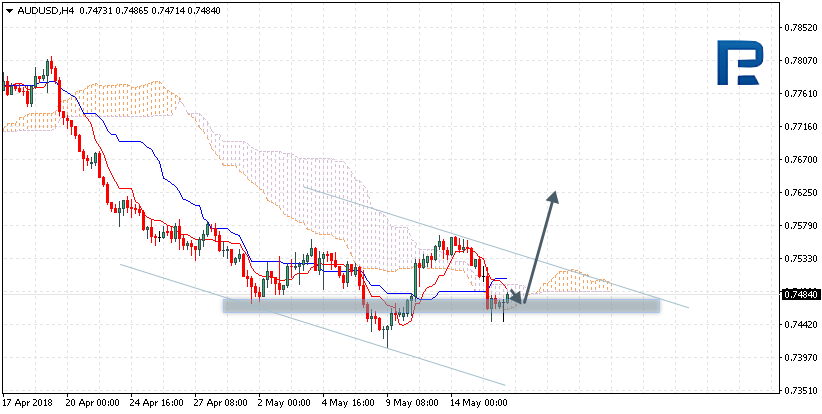
AUDUSD, “Australian Dollar vs US Dollar”
AUDUSD continues moving downwards. Possibly, the price may reach 0.7425 and then grow towards 0.7494. Later, the market may continue trading downwards with the target at 0.7320.
USDRUB, “US Dollar vs Russian Ruble”
USDRUB is growing towards 62.88. After that, the instrument may resume moving downwards to reach the short-term target at 58.90.
XAUUSD, “Gold vs US Dollar”
Gold has reached the target of the descending wave at 1292.00. Today, the price may form another consolidation range. If later the instrument breaks this range to the upside, the market may reach 1303.00; if to the downside – resume falling inside the downtrend with the target at 1285.00.
BRENT
Brent has reached the short-term upside target at 79.50 upwards. Possibly, today the price may start another correction to reach 78.00 at least or even test 77.00 from above. Later, the market may resume growing with the target at 80.20.
Attention! Forecasts presented in this section only reflect the author’s private opinion and should not be considered as guidance for trading. RoboForex LP bears no responsibility for trading results based on trading recommendations described in these analytical reviews.
AUDUSD is trading at 0.7484; the instrument is moving inside Ichimoku Cloud, which means that it is moving sideways. The markets could indicate that the price may test the downside border of the cloud at 0.7475 and then continue moving upwards to reach 0.7625. Another signal to confirm further ascending movement is the price’s rebounding from the support level. However, the scenario that Implies further growth may be cancelled if the price breaks the downside border of the cloud and fixes below 0.7440. In this case, the pair may continue falling towards 0.7370.
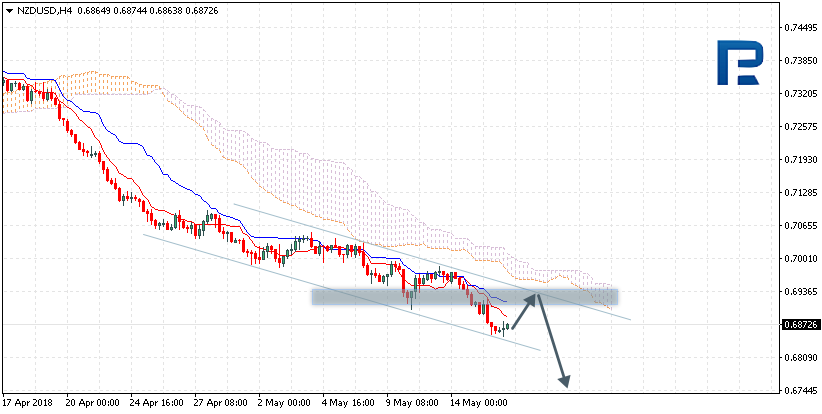
NZDUSD, “New Zealand Dollar vs US Dollar”
NZDUSD is trading at 0.6872; the instrument is moving below Ichimoku Cloud, which means that it may continue falling. The markets could indicate that the price may test the downside border of the cloud at 0.6935 and then continue moving downwards to reach 0.6745. Another signal to confirm further descending movement is the price’s rebounding from the resistance level. However, the scenario that implies further decline may be cancelled if the price breaks the upside border of the cloud and fixes above 0.7010. In this case, the pair may continue growing towards 0.7120.
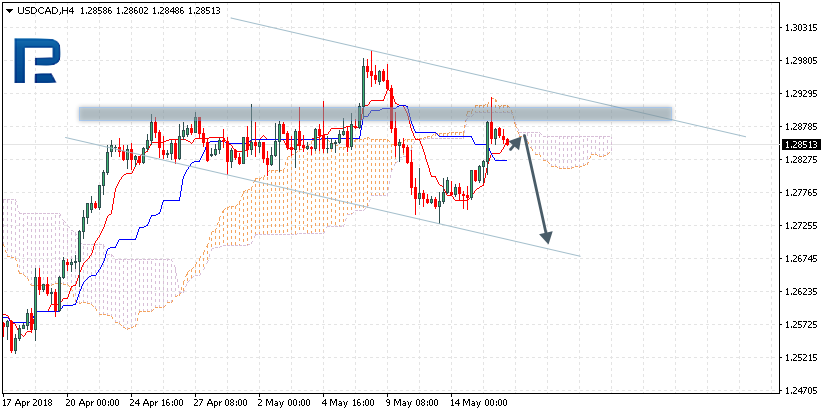
USDCAD, “US Dollar vs Canadian Dollar”
USDCAD is trading at 1.2851; the instrument is moving below Ichimoku Cloud, which means that it may continue falling. The markets could indicate that the price may test the downside border of the cloud at 1.2860 and then continue moving downwards to reach 1.2685. Another signal to confirm further descending movement is the price’s rebounding from the resistance level. However, the scenario that implies further decline may be cancelled if the price breaks the upside border of the cloud and fixes above 1.2885. In this case, the pair may continue growing towards 1.3050.
Attention! Forecasts presented in this section only reflect the author’s private opinion and should not be considered as guidance for trading. RoboForex LP bears no responsibility for trading results based on trading recommendations described in these analytical reviews.
One of the world’s largest independent financial services organizations has added a further two digital currencies to its cryptocurrency exchange app due to public demand being “fueled by digital money becoming ever more mainstream.”
With the additions of Stellar Lumens (XLM) and Monero (XMR), users of deVere Crypto, deVere Group’s crypto platform app, can now buy, sell, store and exchange seven major cryptocurrencies. Existing digital coins on the app were Bitcoin (BTC), Ethereum (ETH) Litecoin (LTC), Ripple (XRP) and Dash (DASH).
The announcement comes after it is confirmed that IBM is to use Stellar for its first cryptocurrency on a public blockchain.
Nigel Green, founder and CEO of deVere Group, comments: “We’ve further expanded our offering on deVere Crypto to include Stellar and Monero due to clients demanding an even more extensive crypto portfolio.
“People are piling into cryptocurrencies. The surge in demand is being fueled by digital currencies becoming ever more mainstream. Both retail and institutional investors are finding it increasingly hard to ignore the potential opportunities of cryptocurrencies.”
He continues: “There are four key drivers for this current expansion of the crypto sector.
“First, the growing appreciation and understanding of the need for digital, global and decentralized currency in an increasingly digitalized and globalized world.
“Second, some of the world’s major tech companies, banking groups, financial institutions and household-name investors are investing in, using and/or beginning to adopt cryptocurrencies.
“Third, regulation of the sector is now becoming inevitable. This has been noted by the Head of the IMF and can also be evidenced by the July deadline for suggested cryptocurrency regulation set at the G20 summit this year.
“And fourth, the technology behind cryptocurrencies is improving all the time. For instance, scalability issues are being improved to bolster transaction processing capacities.”
Regarding the addition of the two new digital coins to deVere Crypto, Mr Green says: “All the digital coins have different characteristics, strengths and values. As such, these additions help to achieve portfolio diversification within this specific asset class and their individual traits make them useful in different ways for investors.”
Earlier this year, he observed: “Those cryptocurrencies that have made it onto the deVere Crypto app have been painstakingly analyzed and evaluated by the deVere Crypto Research Department, run by 10 of the world’s leading blockchain and crypto experts.
“Other companies, I believe, overlook this essential process and we are the only ones to be doing this level and scope of research.”
The deVere CEO concludes: “Whilst it is now becoming fully mainstream, the cryptocurrency sector remains highly volatile and advice should be sought by an independent financial adviser.
“That said, I fundamentally believe in the potential of digital money in today’s world.”
deVere Group is one of the world’s largest independent advisors of specialist global financial solutions to international, local mass affluent, and high-net-worth clients. It has a network of more than 70 offices across the world, over 80,000 clients and $12bn under advisement.
We continue to appreciate the positive and supportive comments we are receiving from our followers and members. We can’t tell you how pleased we are that all of you are enjoying our efforts to provide you with the best market research and analysis we can offer. Today, we are highlighting some important Fibonacci price levels and how they should continue to drive price action over the next 3~10 days or so. Let’s get started.
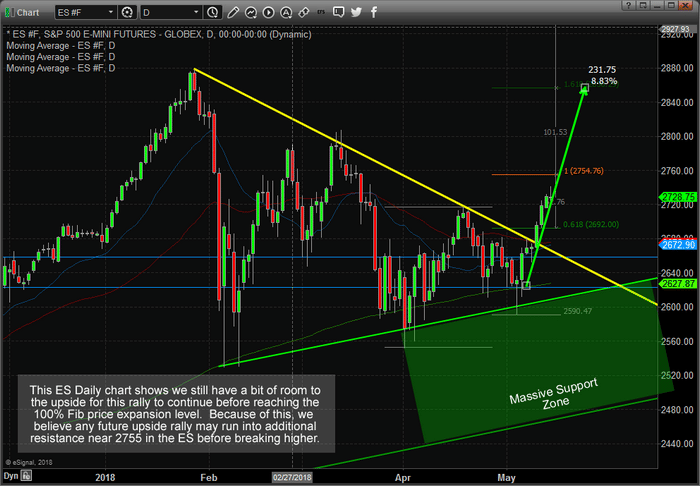
This first Daily ES chart shows a pretty big picture of the Fibonacci price legs (the Fibonacci price “ladder” as we will refer to it in this article) and how these legs work in tandem with other types of support and resistance channels/level as price expands or contracts within new trends. As you probably remember, one of the key factors to understanding Fibonacci price theory is that “price MUST attempt to establish new highs or lows at all times”. Therefore, as we can see by recent price action, new price highs have been reached. This is a clear indication that a new bullish trend is in place and we should now be searching to key levels to enter new trades.
We know the massive support zone exists below 2620 in the ES and we know a critical price channel exists between 2625 & 2660. We don’t believe price will retrace enough to threaten any of these levels. We believe price may retrace to near 2700 before finding additional support and developing a new base for a “ladder move” higher (likely to near 2855).
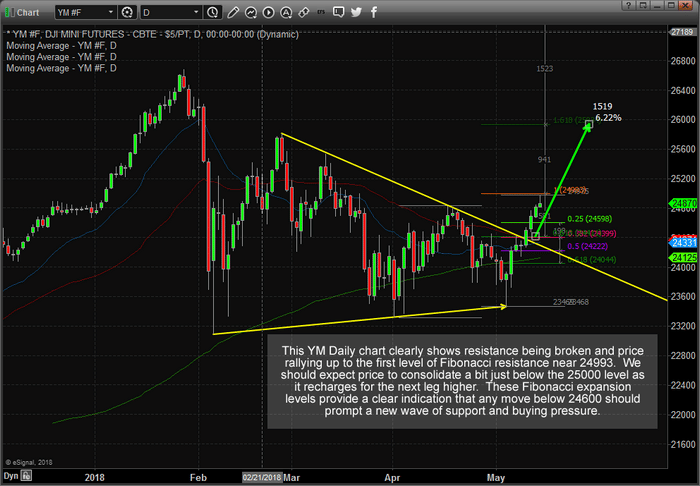
To confirm this analysis lets take a look at the YM (DOW futures) Daily chart below as well. The Daily YM chart, below, paints a fairly similar example as the ES (S&P500 futures) chart, above). Yet, this YM chart shows that the recent high price is very close to the Fibonacci 100% price level (a “ladder rung”) and should find moderate resistance near this level (24993). We expect price may rotate lower to near 24598 before finding support and establishing a quick, possibly V-shaped or large lower wick type price rotation, bottom that would propel price higher to the next Fibonacci ladder leg near 25937.
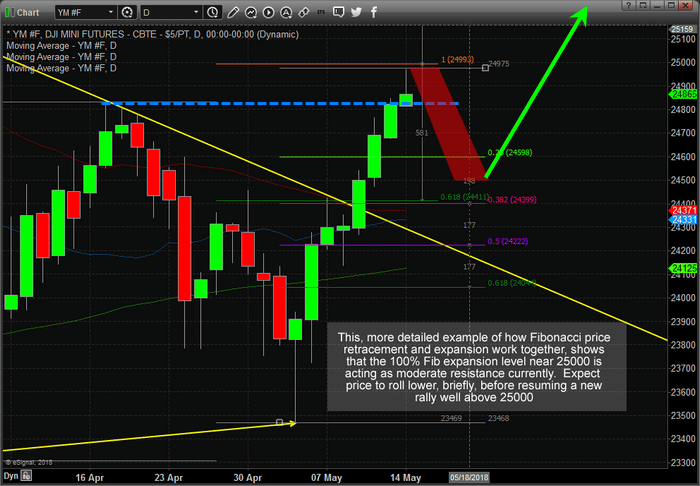
This, zoomed in view of the Daily YM price chart below with our Fibonacci price levels drawn, helps to better understand what we expect to see. As we keep trying to instill into your thinking, “price MUST attempt to establish new price highs or lows as it continues to develop trends and trend reversals in Fibonacci Theory”. Therefore, price MUST attempt to rotate lower after establishing a new price high (as it has done recently) only to FAIL to establish a new price low (which would be a move to below 23460 – a long way away). In doing so, the failure to establish a new price low (through price rotation) would indicate that price MUST do what? That’s right, establish another NEW PRICE HIGH.
It is our belief that any price rotation below 24700, when price appears to be holding or forming support, would be a tremendous opportunity to identify new long entries. Of course, the deeper the downside move, the better the entry levels will be created, but we don’t believe this future downside price rotation will be very deep – possibly just below 24500 as the lowest points for the YM.
If you have been following our research and analysis, you know we called this move nearly a month ago and have been sticking to the analysis of our advanced modeling and predictive analysis systems.
We offer some of the most complete and informative research anywhere and we invite you to visit www.TheTechnicalTraders.com to learn how we can help you find and execute better trades. Your subscriptions help us continue to deliver these incredibly valuable research reports and we urge you to consider how our work has helped you over the past few months. If you feel our work is superior and valuable, then support our research team and start using our research. 2018 is proving to be a fantastic trading year and we urge everyone to join us in creating greater success.
Our articles, Technical Trading Mastery book, and 3 Hour Trading Video Course are designed for both traders and investors to explore the tools and techniques that discretionary and algorithmic traders need to profit in today’s competitive markets. Created with the serious trader and investor in mind – whether beginner or professional – our approach will put you on the path to win. Understanding market structure, trend identification, cycle analysis, volatility, volume, when and when to trade, position management, and how to put it all together so that you have a winning edge.
On Tuesday afternoon, AUDUSD is trading downwards; the statistics from China left the Aussie no chances.
The Australian Dollar resume falling against the USD on Tuesday. The current quote for the instrument is 0.7516.
In the morning, the RBA’s latest Meeting Minutes report was published. The document says that the next step of the regulator’s monetary policy will rather be increasing the benchmark rate than decreasing it. Right now, the RBA sees no reasons to tighten its policy in the nearest future. When it comes to the inflation, the regulator’s members agree that it will growth slowly and steadily. The same applies to the labor market.
In general, the report provided no surprises and the Aussie might remain neutral if it hadn’t been for the Chinese statistics. The Retail Sales in China added only 9.4% y/y in April after expanding by 10.1% y/y in March and against the expected reading of +10.0% y/y.
The report on the Industrial Production in April was more positive, but couldn’t make things better. The indicator increased by 7.0% y/y after adding 6.0% y/y the month before and against the expected reading of +6.4% y/y.
Macroeconomic indicators from China are very important for the Aussie, because this country is Australia’s main trade and economic partner.
Attention! Forecasts presented in this section only reflect the author’s private opinion and should not be considered as guidance for trading. RoboForex LP bears no responsibility for trading results based on trading recommendations described in these analytical reviews.
In the afternoon, the main currency pair started moving more actively based on the published reports from the Euro Area.
On Tuesday morning, EURUSD was pretty calm, because there weren’t any significant reasons to move. However, such reasons may appeared in the afternoon. The current quote for the instrument is 1.1920.
The statistics published by the Eurozone in the afternoon look rather mixed, although nobody expected any surprises. The second estimate of the GDP Growth Rate in the first quarter 2018 was +2.5% y/y, the same as expected. On QoQ, the indicator added 0.4%.
At the same time, the Industrial Production expanded only by 3.0% y/y in March against the expected reading of +3.7% y/y. On MoM, the indicator increased by 0.5%, which may be considered as a god result, but expectations were +0.7%.
Earlier, Germany also failed the Euro: the country’s preliminary report on the GDP showed +0.3% q/q, which is worse than expectations and the reading of the fourth quarter 2017, 0.4% q/q and 0.6% q/q respectively.
These numbers will influence the market for several more hours, but later investors will switch their attention to the statistics from the USA to be published in the evening. One of the most anticipated reports is the Retail Sales, which is expected to be quite strong and may help the USD to strengthen. .
Attention! Forecasts presented in this section only reflect the author’s private opinion and should not be considered as guidance for trading. RoboForex LP bears no responsibility for trading results based on trading recommendations described in these analytical reviews.